Which step first adds specific start and end dates?
Scheduling and Tracking
WBS, network diagrams, critical path (ES/EF/LS/LF/slack), PERT, Gantt charts, schedule compression and earned value. Each final had a full network-diagram/critical-path question plus Gantt, burn-chart and crashing/fast-tracking questions, so this is the highest-scoring deck.
How to read this page
Every original slide is shown unchanged. Yellow marks on a slide point to a numbered note: hover or tap a mark to jump to its note, and hover a note to see its marks. Questions tagged Past exam appeared on a real paper; Prediction questions are likely angles, not confirmed. Pick an answer to each question: a wrong pick tells you why it is wrong, so you can try again.
All 80 slides
- 1 Scheduling and Tracking
- 2 Outline
- 3 Schedule Development
- 4 Planning, Estimation, Scheduling, Tracking
- 5 How to Schedule?
- 6 Definition
- 7 Controlling factors in schedule development
- 8 Work Breakdown Structure (WBS)
- 9 Work Breakdown Structure (WBS)
- 10 WBS Outline Example
- 11 WBS Types
- 12 Process WBS
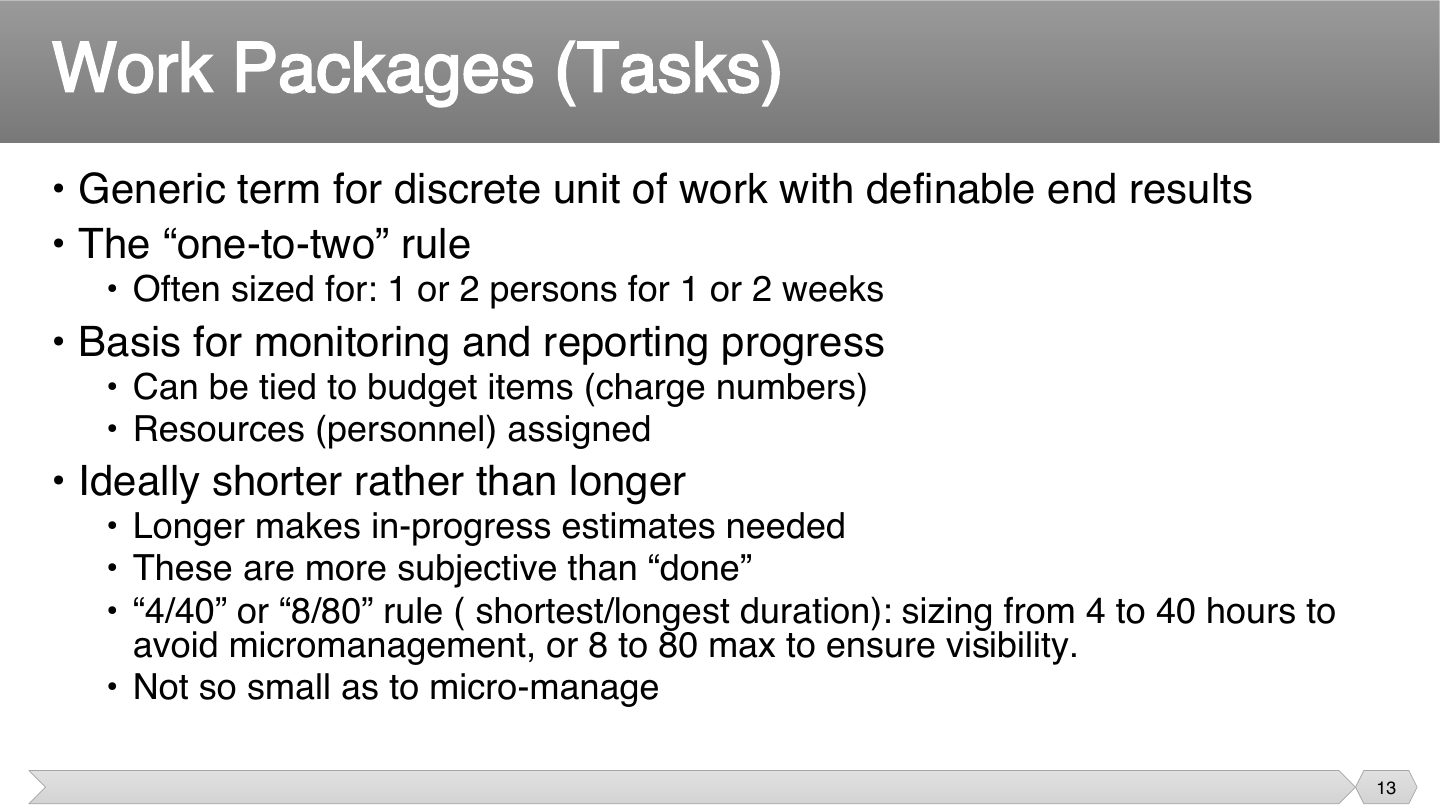
- 13 Work Packages (Tasks)
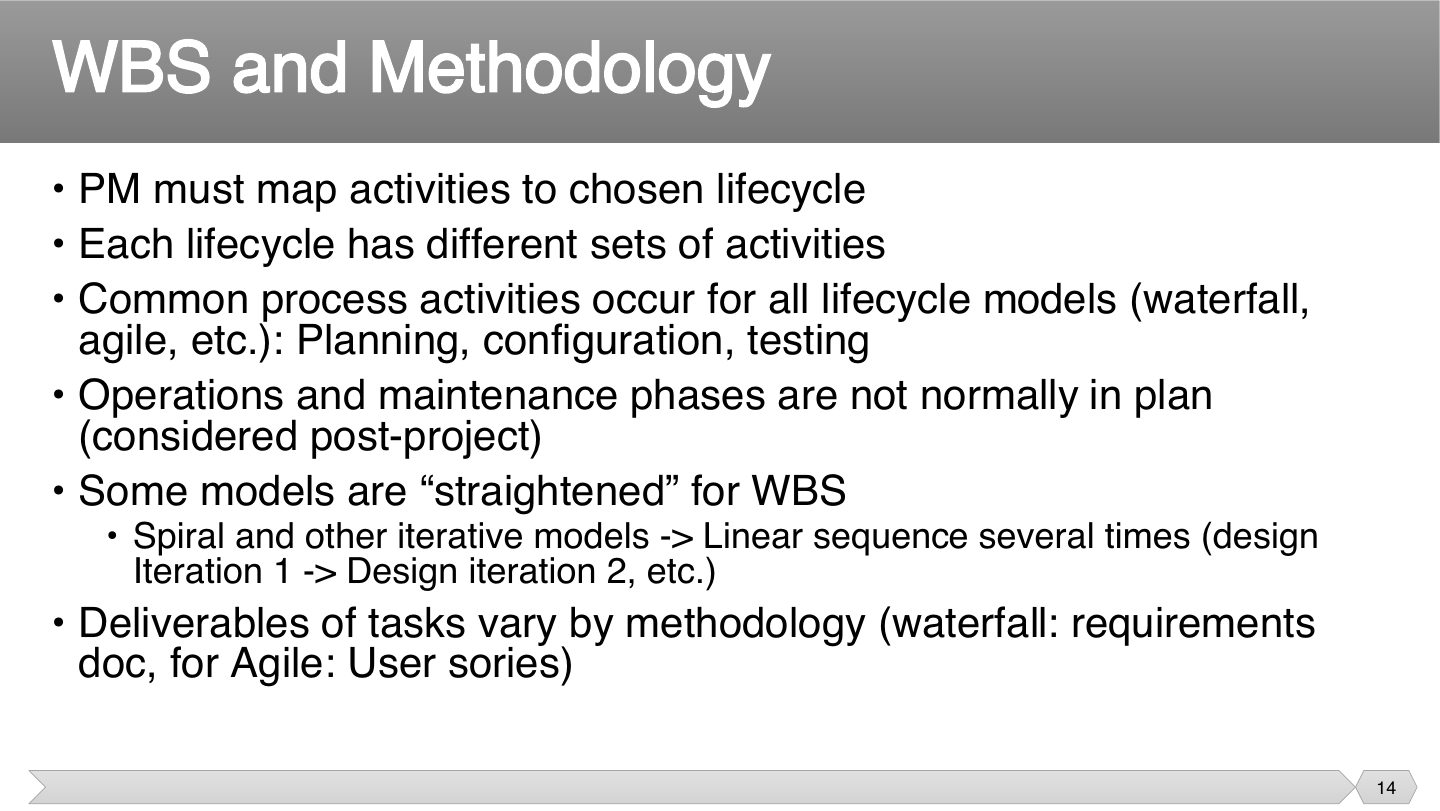
- 14 WBS and Methodology
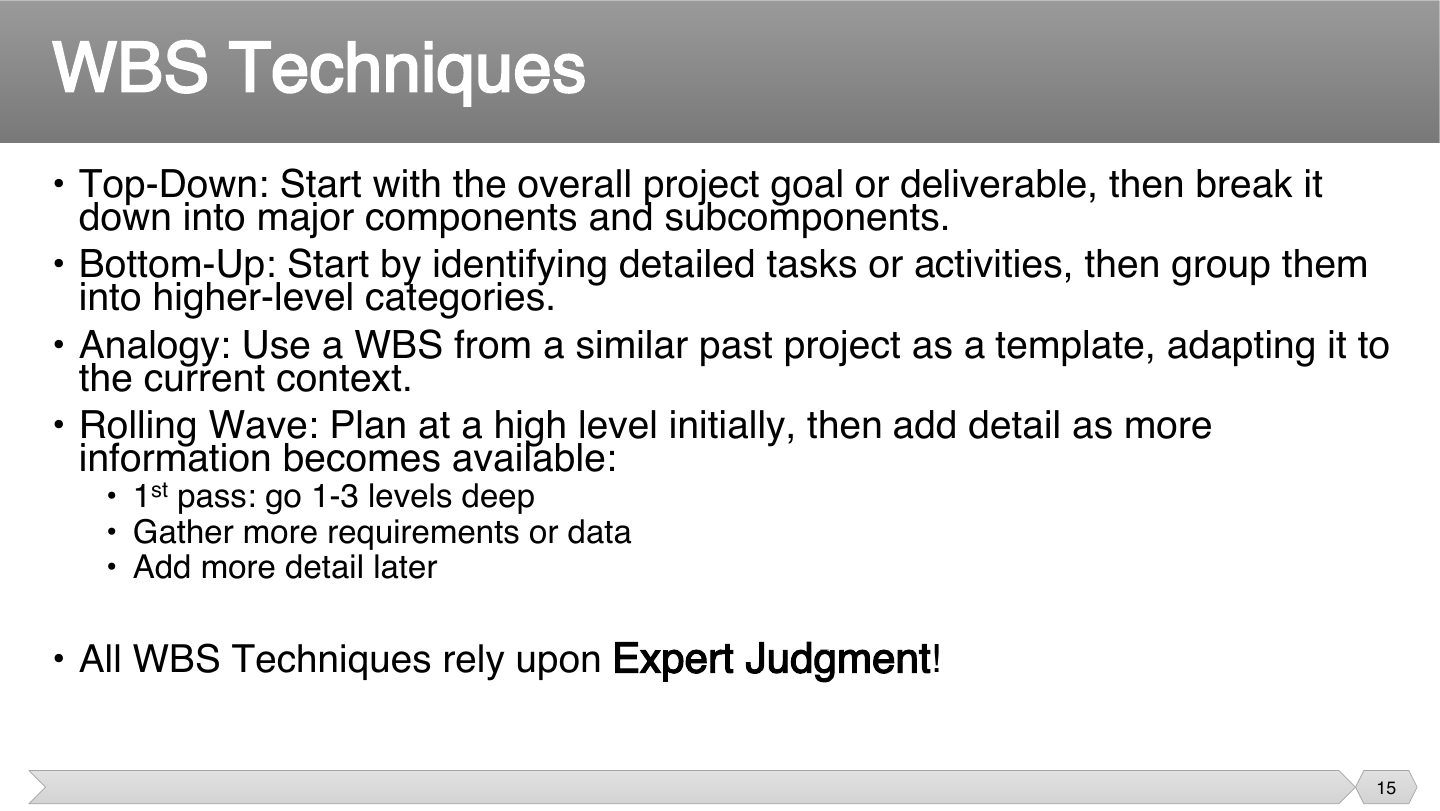
- 15 WBS Techniques
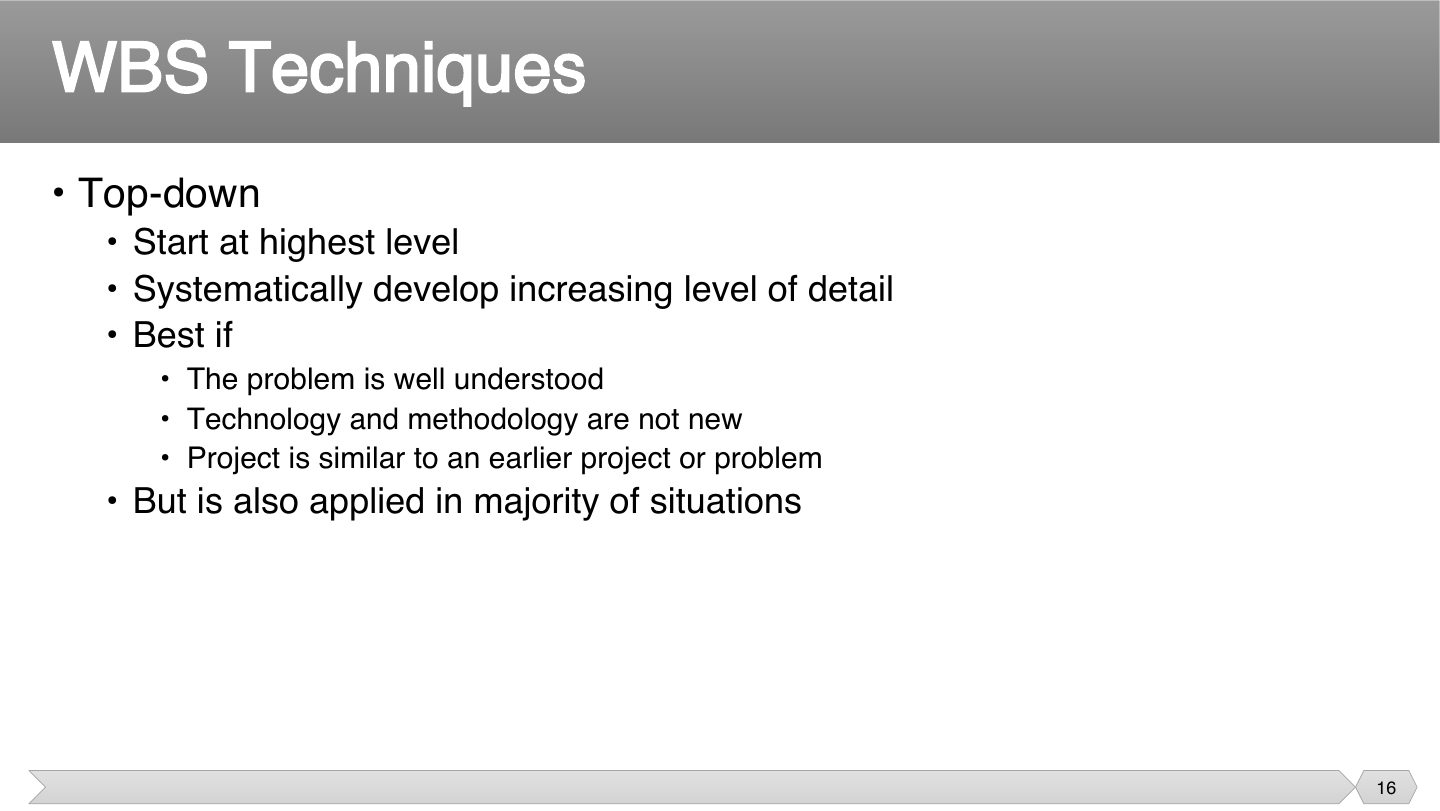
- 16 WBS Techniques
- 17 WBS Techniques
- 18 WBS Techniques
- 19 WBS Techniques
- 20 WBS basis for many things
- 21 WBS Guidelines
- 22 Network Analysis
- 23 Network Analysis
- 24 Network Analysis
- 25 Network Analysis Terminology
- 26 Creating a precedence table
- 27 Sample precedence table
- 28 Precedence Network Diagram
- 29 PERT Estimation Technique
- 30 What is a PERT?
- 31 PERT
- 32 PERT Chart
- 33 PERT estimation technique
- 34 Slack Time
- 35 Critical Path Method
- 36 Critical Path Method
- 37 Critical Path Example
- 38 What is a Gantt chart?
- 39 Gantt Chart
- 40 Gantt Chart
- 41 Gantt Example
- 42 Critical Chain Method
- 43 Critical Chain Method
- 44 Critical Chain Method
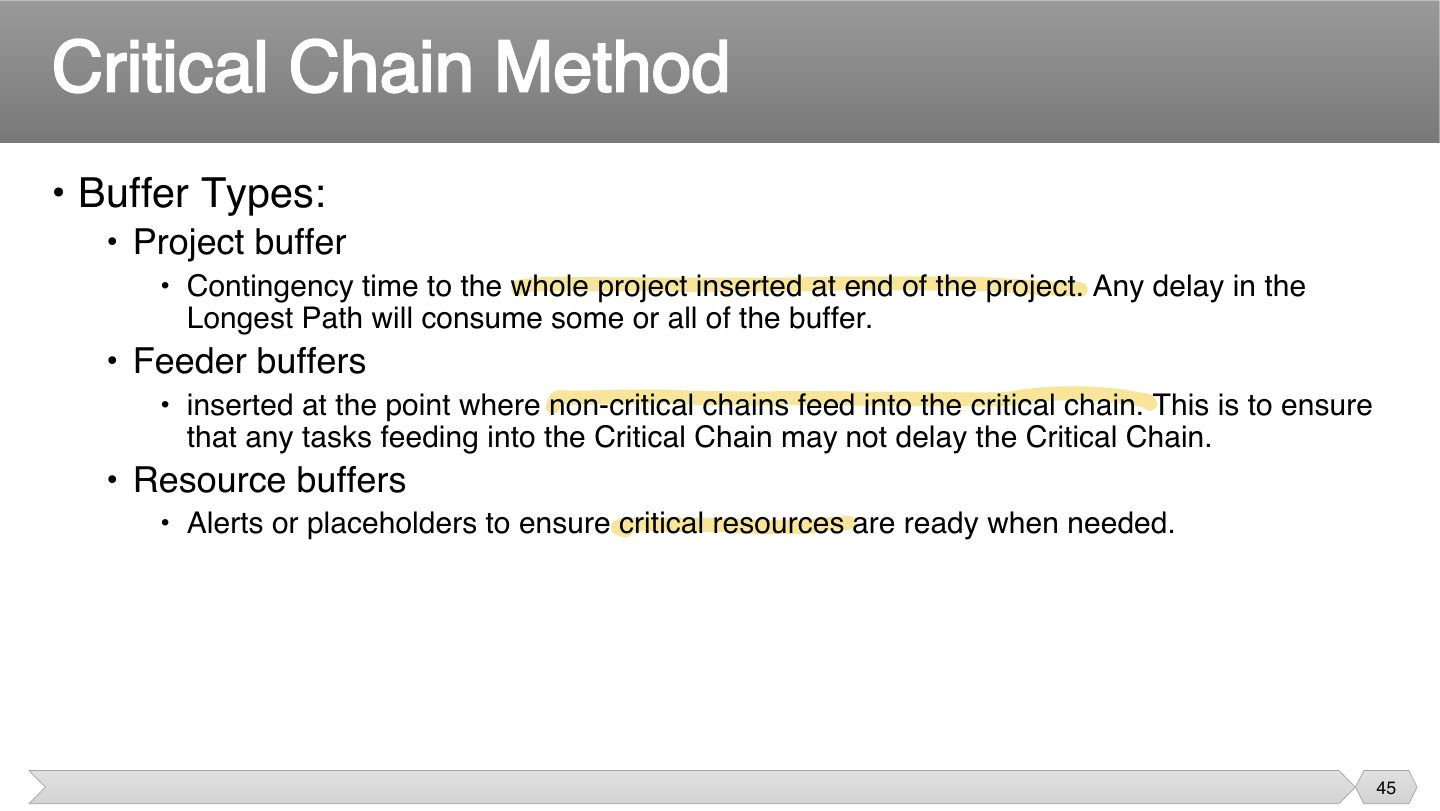
- 45 Critical Chain Method
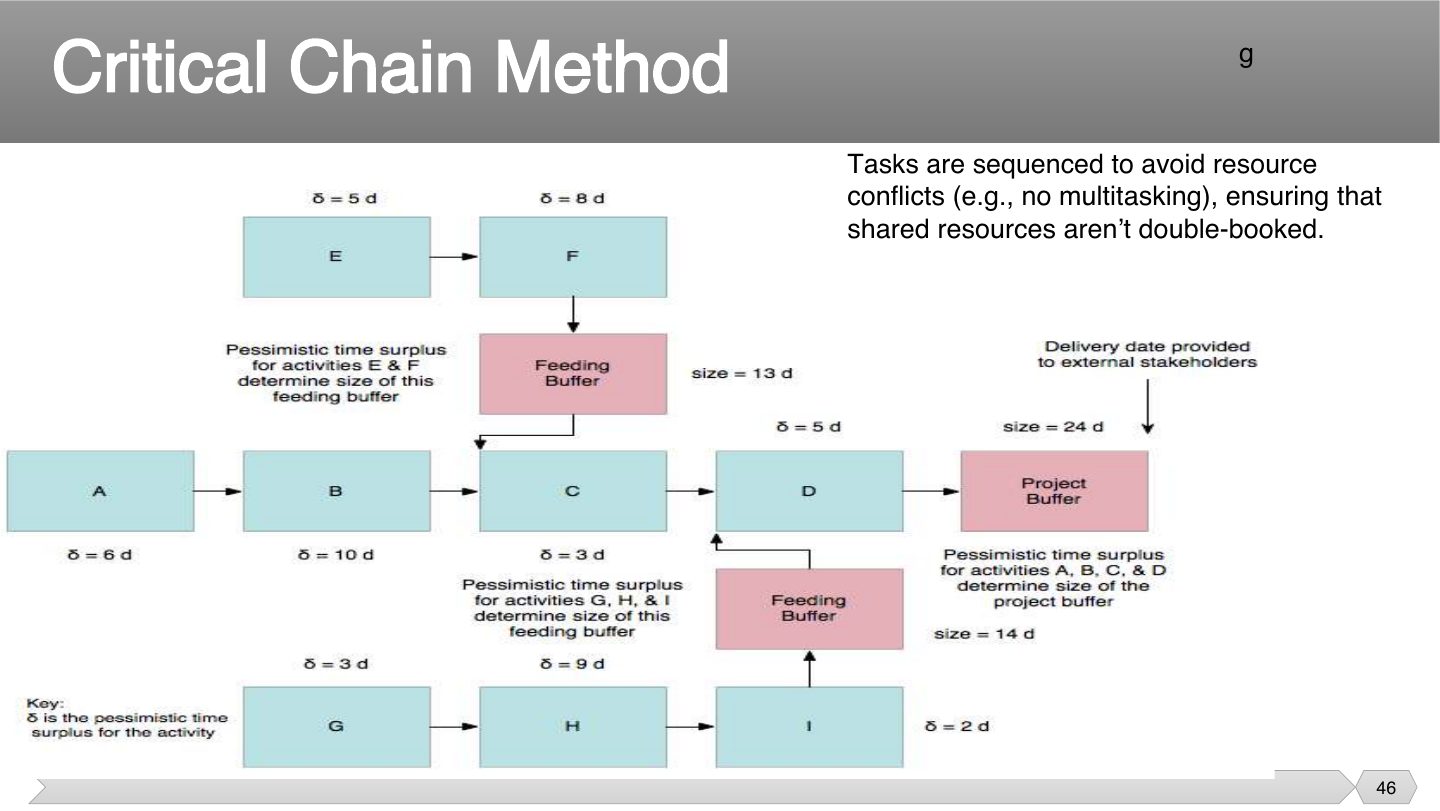
- 46 Critical Chain Method
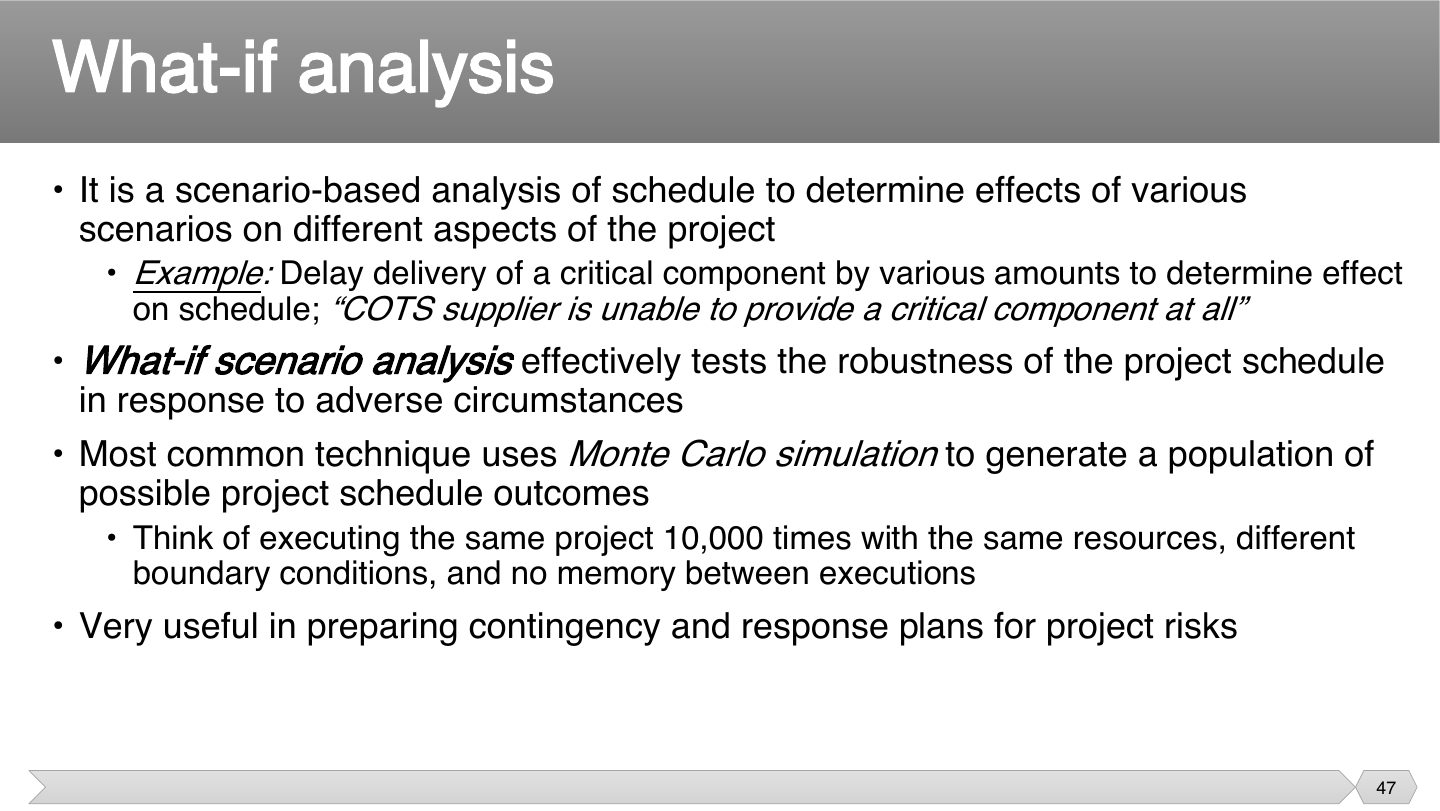
- 47 What-if analysis
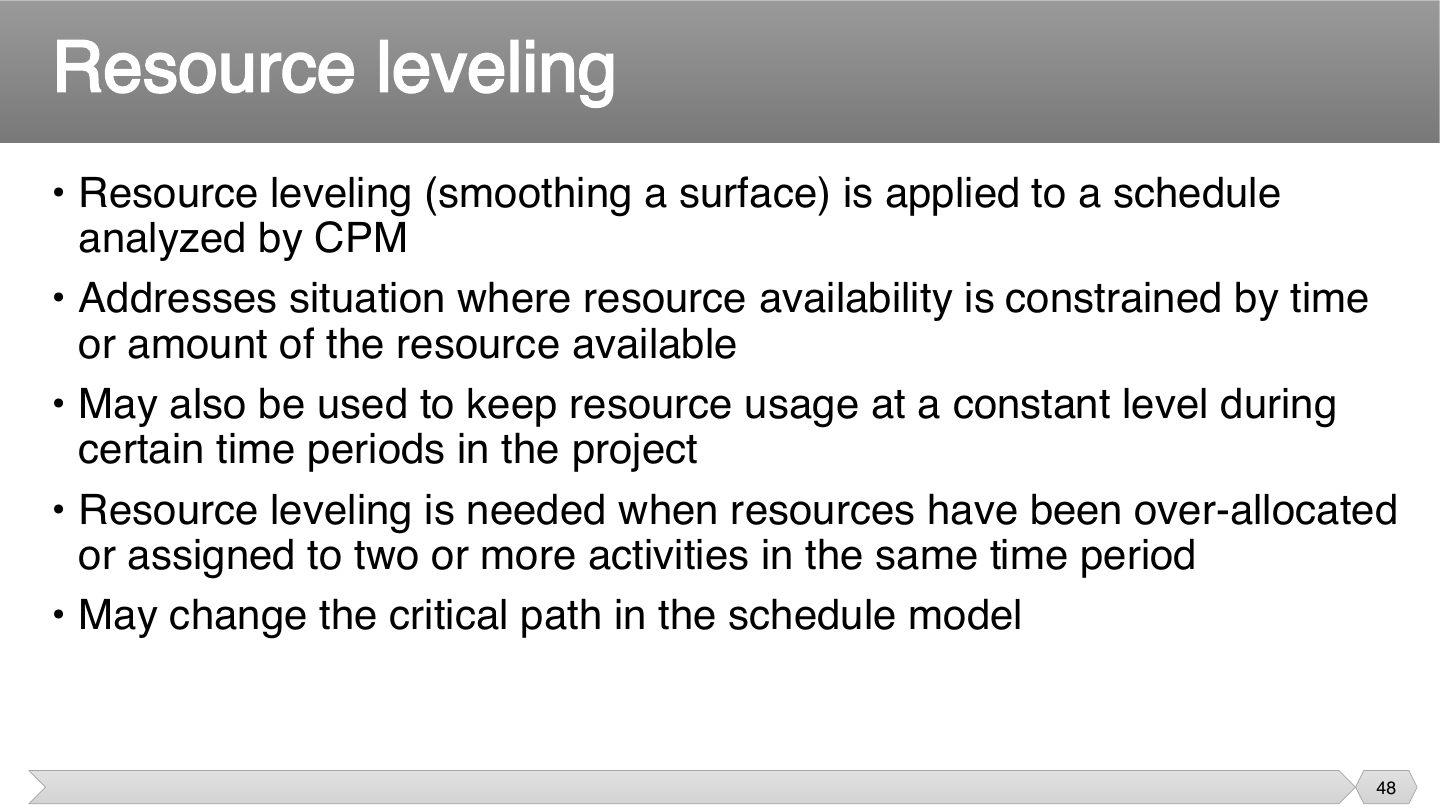
- 48 Resource leveling
- 49 Resource leveling
- 50 Applying leads and lags
- 51 Calendars
- 52 Schedule development output
- 53 Reducing Project Duration
- 54 Schedule compression
- 55 Schedule compression
- 56 Mythical Man-Month
- 57 Mythical Man-Month
- 58 Mythical Man-Month
- 59 Mythical Man-Month
- 60 Mythical Man-Month
- 61 Quick Summary of the Scheduling Workflow
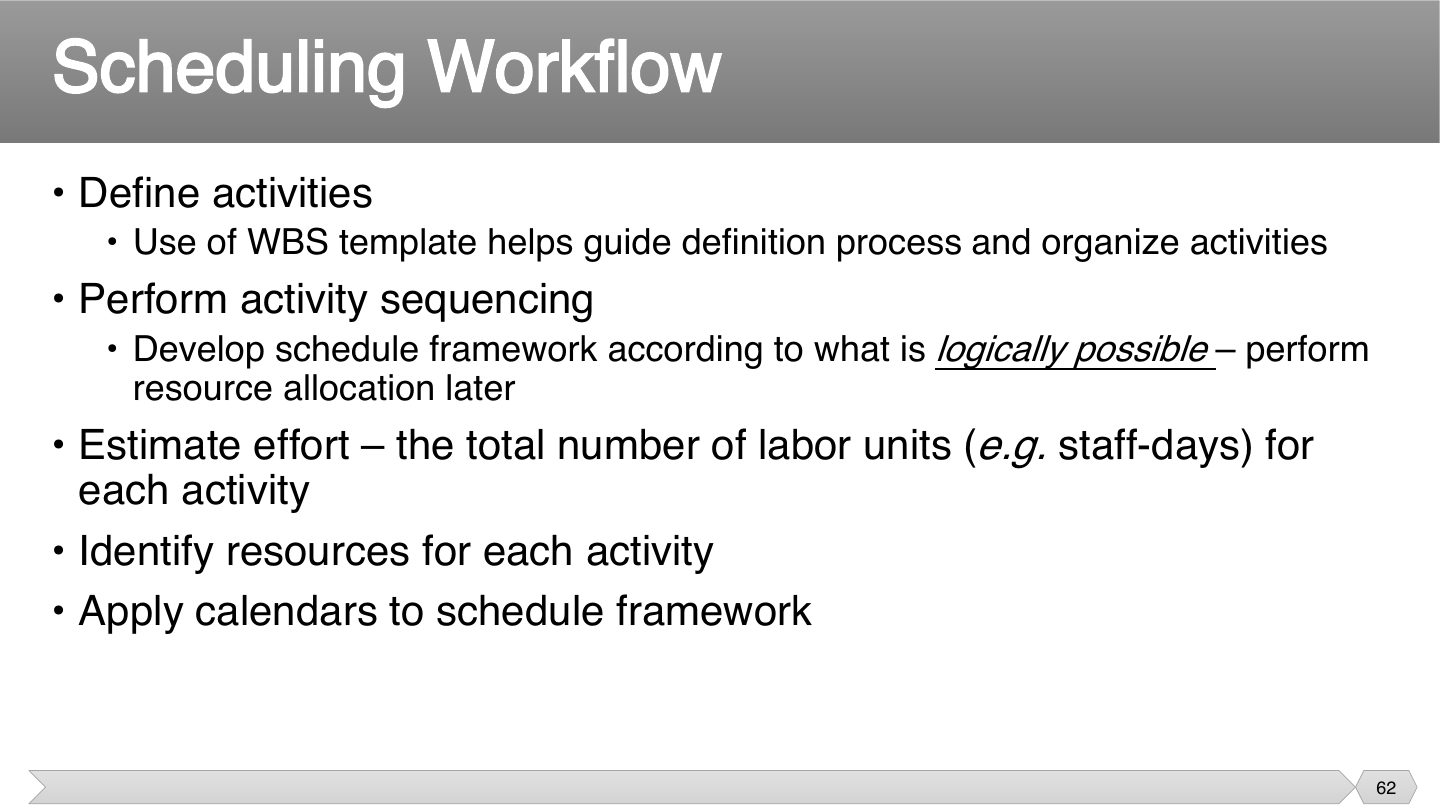
- 62 Scheduling Workflow
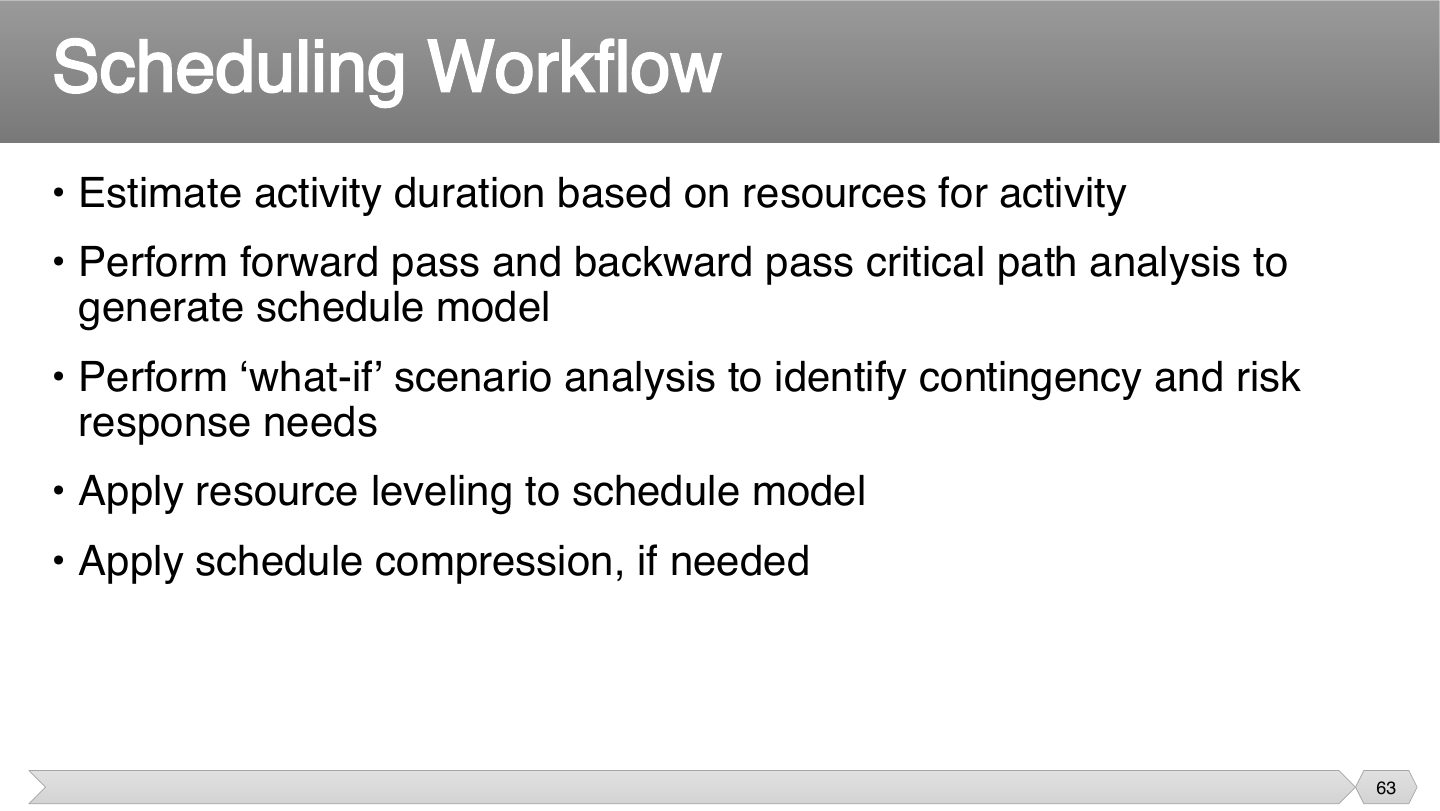
- 63 Scheduling Workflow
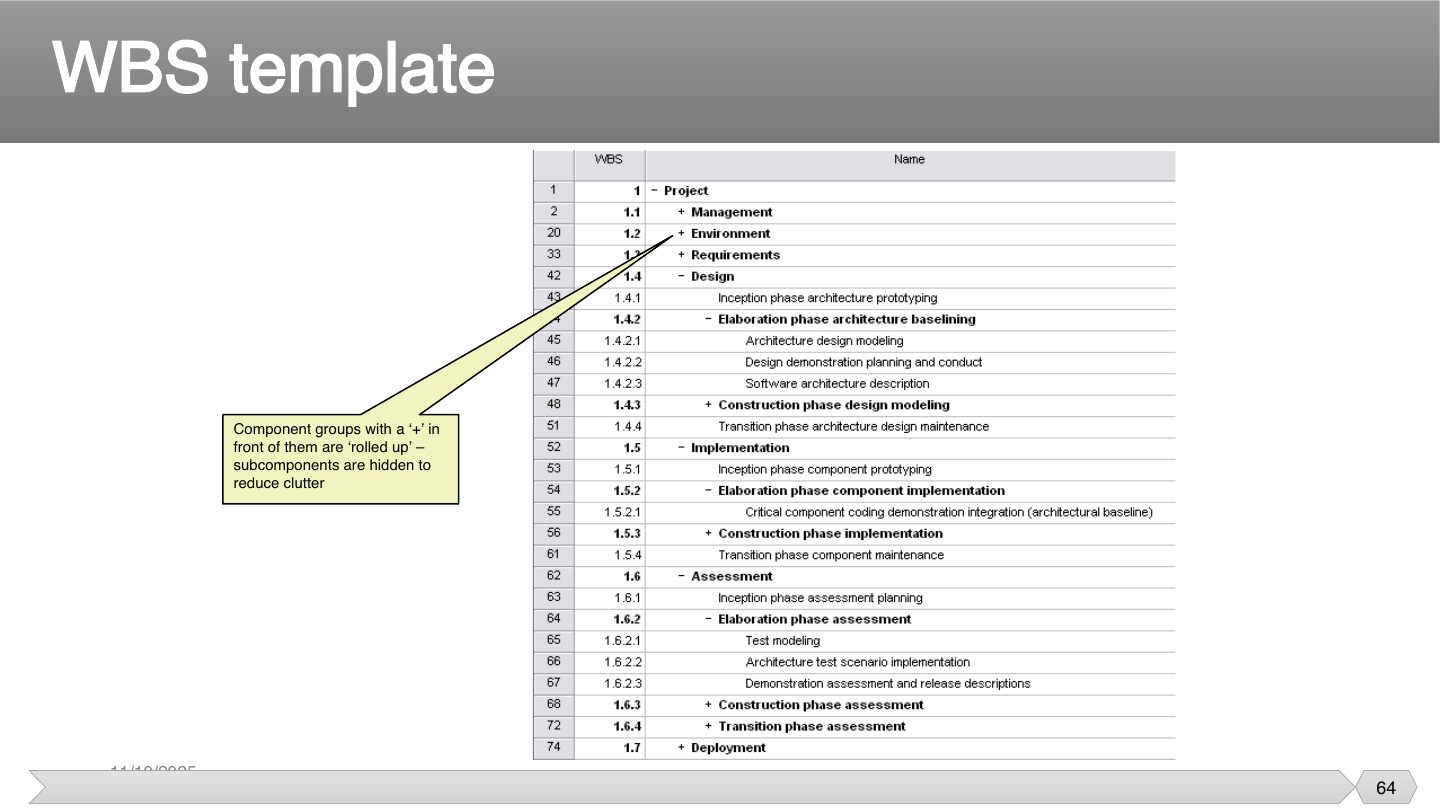
- 64 WBS template
- 65 Activity Sequencing
- 66 Critical Path: Early/Late Start and Finish with Float
- 67 Schedule Compression
- 68 Determining resource utilization
- 69 Project Tracking
- 70 Tracking and Visibility
- 71 Percent Complete
- 72 Percent Complete
- 73 Earned Value
- 74 Using Earned Value Tracking
- 75 Earned Value Example
- 76 Earned Value Tracking
- 77 Project Velocity (PV)
- 78 Project Velocity (PV)
- 79 Burn down chart
- 80 Summary
Scheduling and Tracking
Notes
Workflow: WBS → sequence (network) → durations → critical path → Gantt → compress → track (EV, velocity, burn-down).
Outline
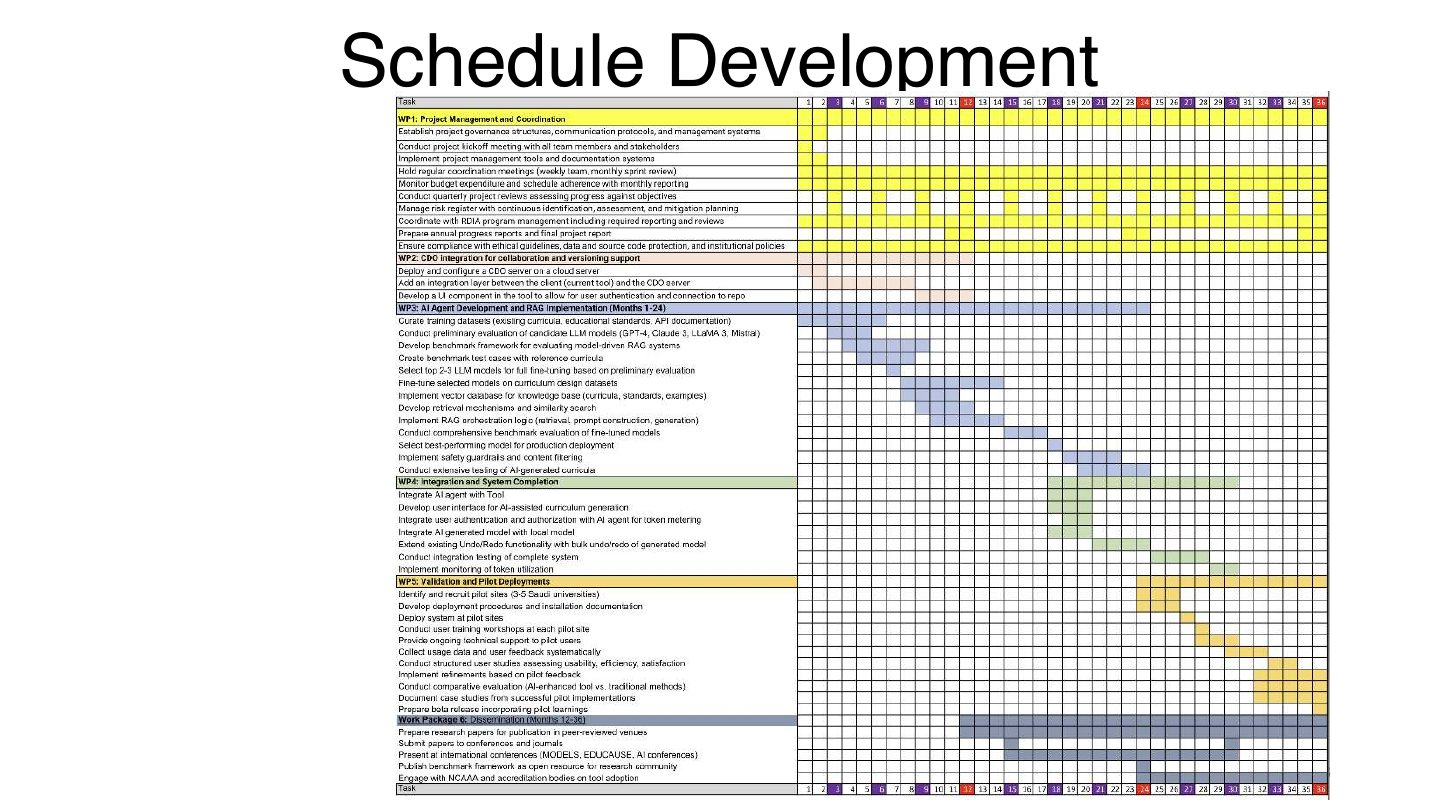
Schedule Development
Notes
A real schedule: hundreds of WBS rows with bars over time. This is where the chapter ends up.
Planning, Estimation, Scheduling, Tracking
Notes
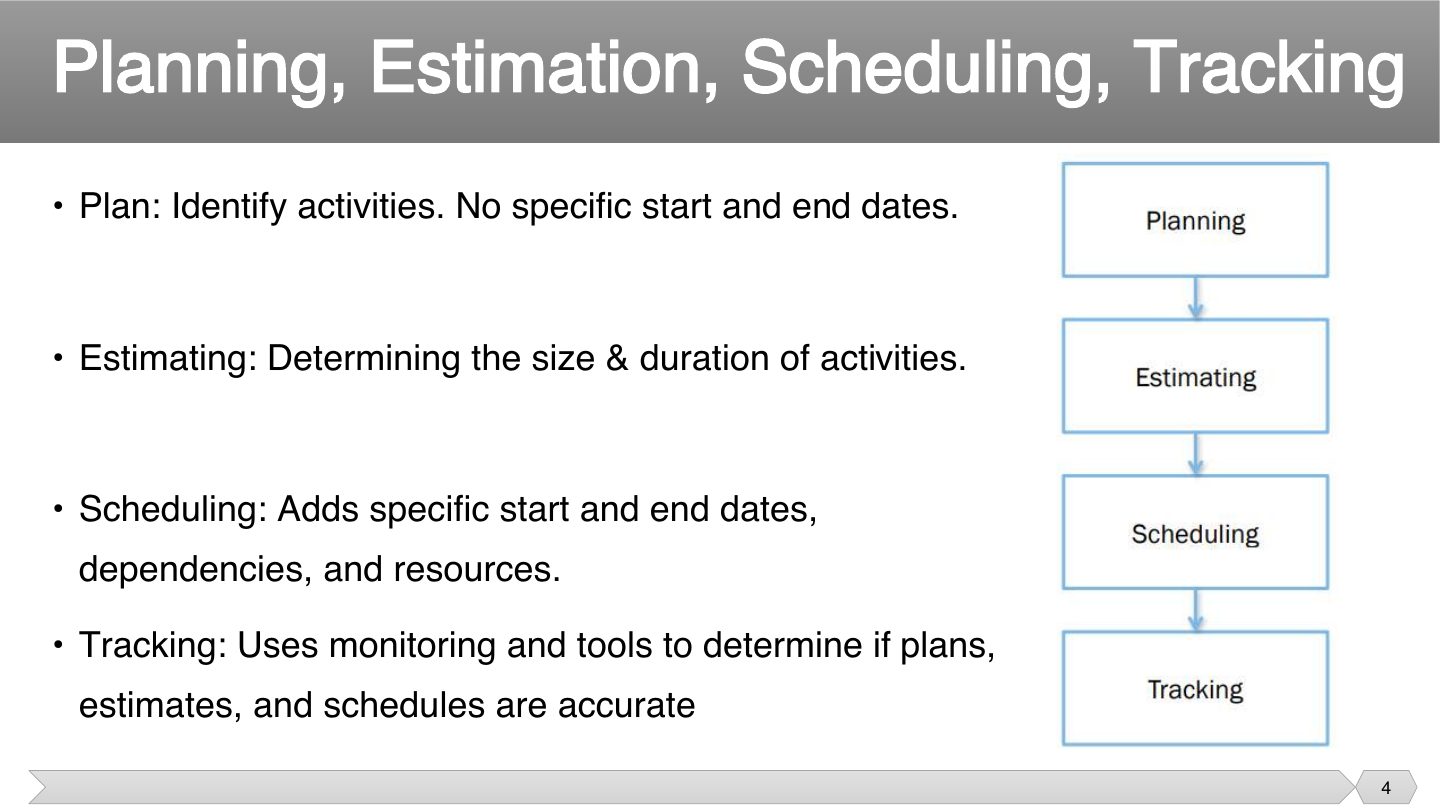
These four words are often mixed up, but each adds something. Planning lists what has to happen, estimating sizes it, scheduling puts dates on it, and tracking checks whether reality is following along.
Tips & tricks
- PEST, already in order: Plan, Estimating, Scheduling, Tracking.
Exam angle
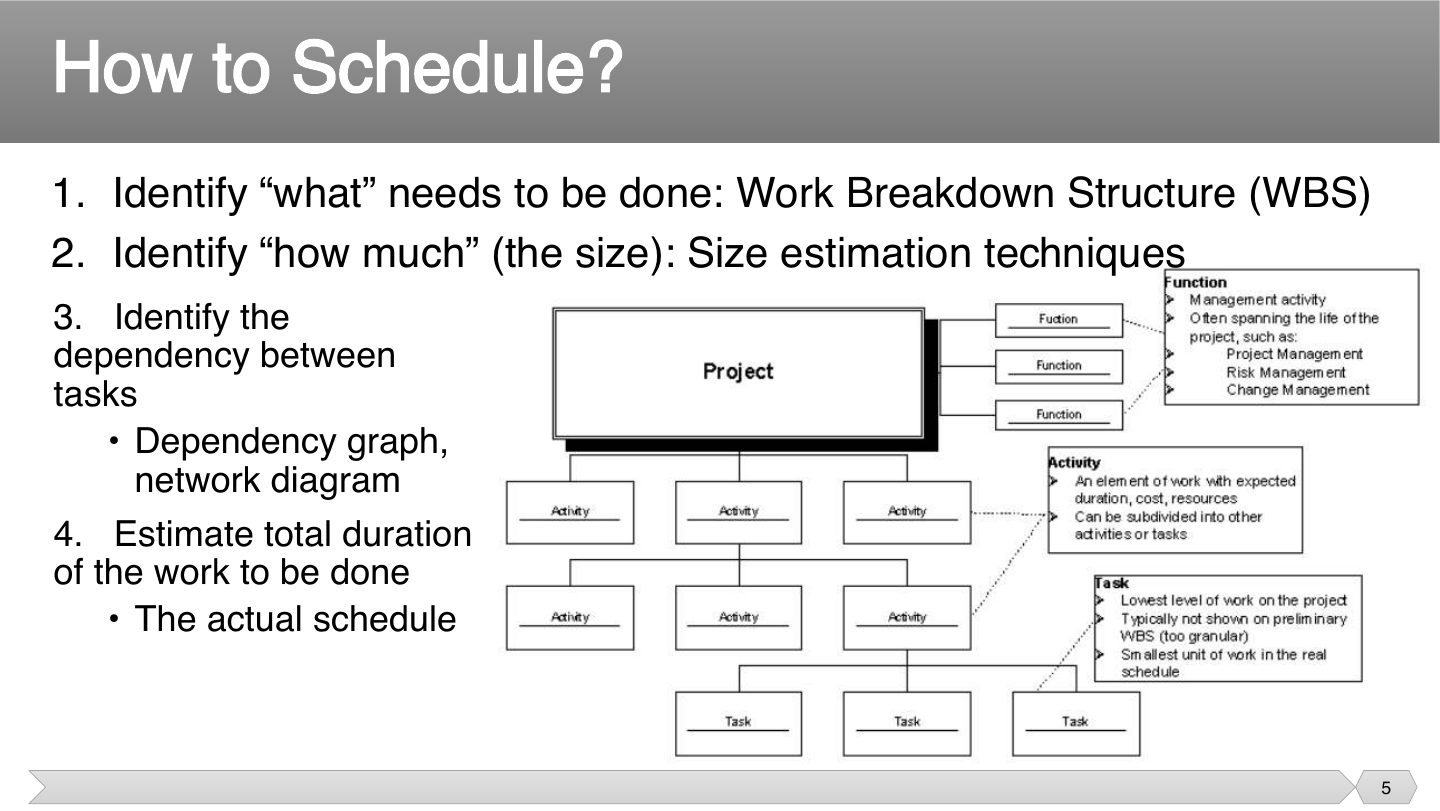
How to Schedule?
Notes
Each question depends on the last. You can’t size work you haven’t listed, and you can’t set dates before you know what depends on what. So a WBS comes first.
Exam angle
What is the first step in scheduling?
- That’s the third step.
- That shows a finished schedule.
- That comes last.
- You can’t size or sequence what you haven’t listed.
Definition
Notes
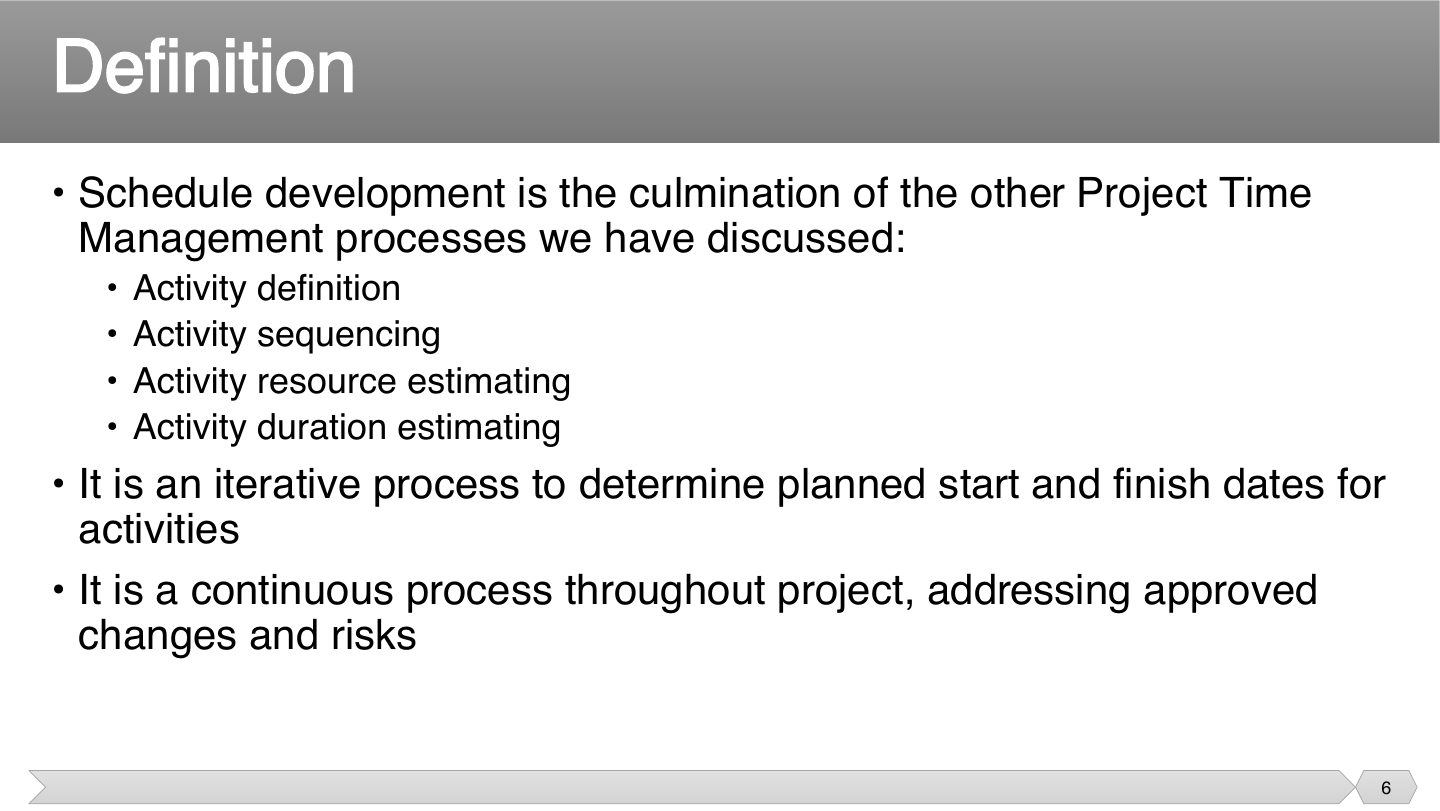
A schedule isn’t a separate activity but the result of all the earlier work. It’s also never really finished, as approved changes and risks keep altering it, which is why iterative and continuous matter.
Tips & tricks
- The order matters here: Don’t Skip Real Dates. Definition, Sequencing, Resource estimating, Duration estimating.
Exam angle
Schedule development is finished once, at the start of the project.
- The slide says it’s a continuous process.
- It’s continuous throughout the project, addressing approved changes and risks.
Controlling factors in schedule development
Notes
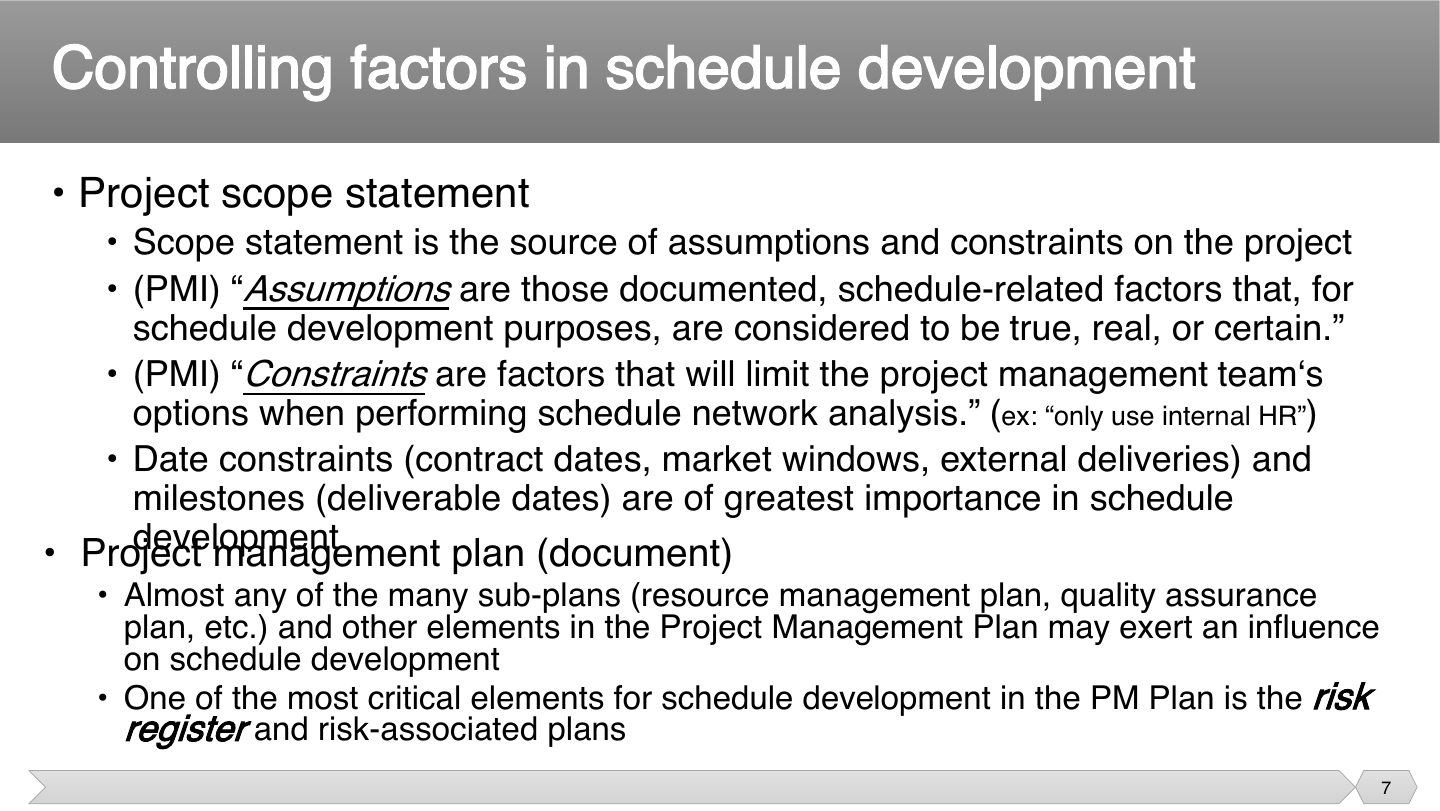
If you assume a server is available and it isn’t, your schedule breaks. A constraint is different: it’s a real limit, such as only using in-house staff. Knowing which is which tells you what could change.
Why does the risk register matter for dates? Each risky task may need extra time or a backup. So a schedule that ignores the risk register is too optimistic.
Exam angle
Related question: Q1.3 · the project scope statement
“Only internal HR staff may be used” is an example of a:
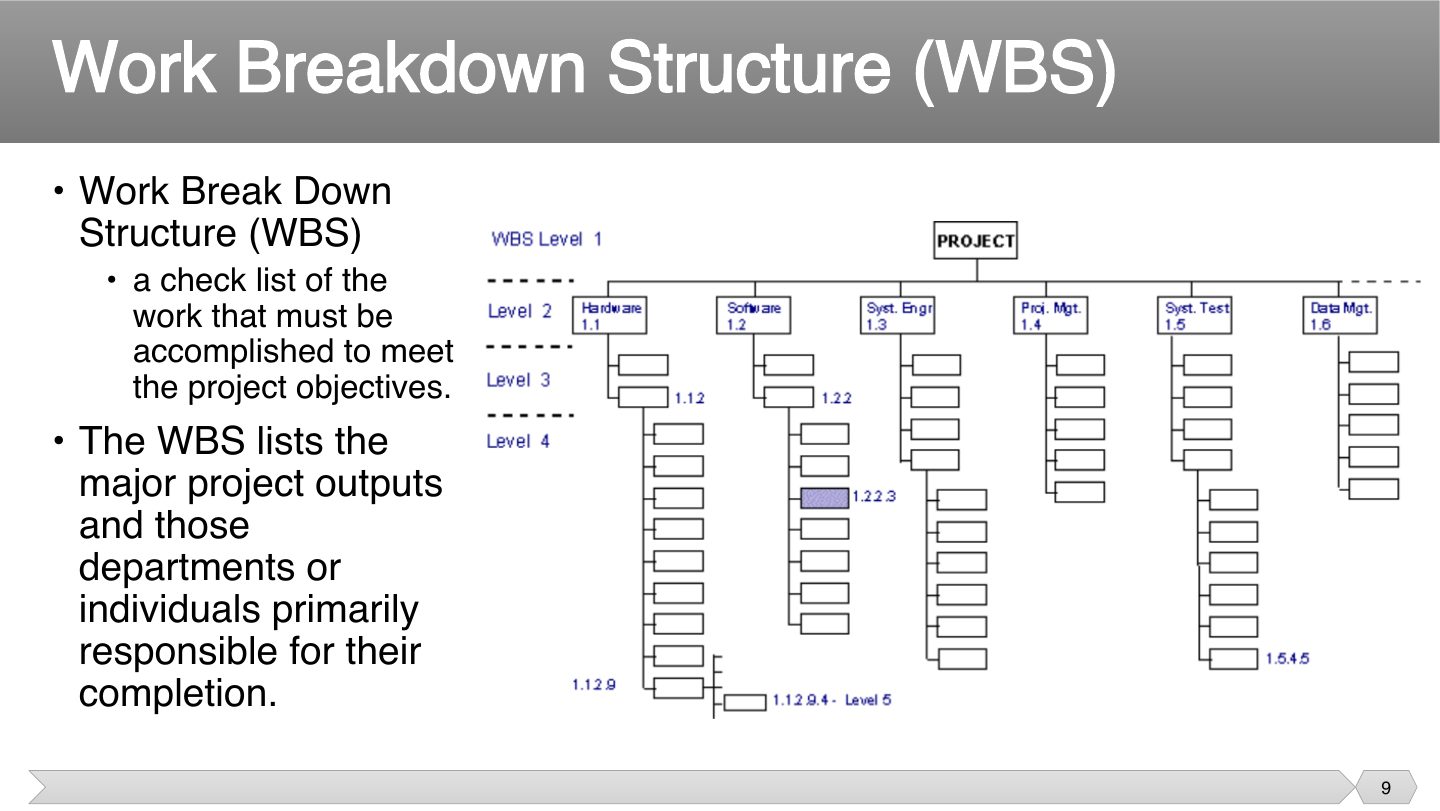
Work Breakdown Structure (WBS)
Work Breakdown Structure (WBS)
Notes
If it isn’t in the WBS, nobody will do it and nobody budgeted for it. So it’s more than a to-do list: it’s the agreed picture of all the work, with clear owners.
Seen again Ch 1.2, slide 39: Scope decomposed with a WBS
Seen again Ch 5, slide 21: RBS is analogous to WBS
Exam angle
What does a WBS list?
- It’s broader than money.
- That’s a calendar.
- That’s an RBS or register.
- It’s a checklist of all the work.
WBS Outline Example
Notes
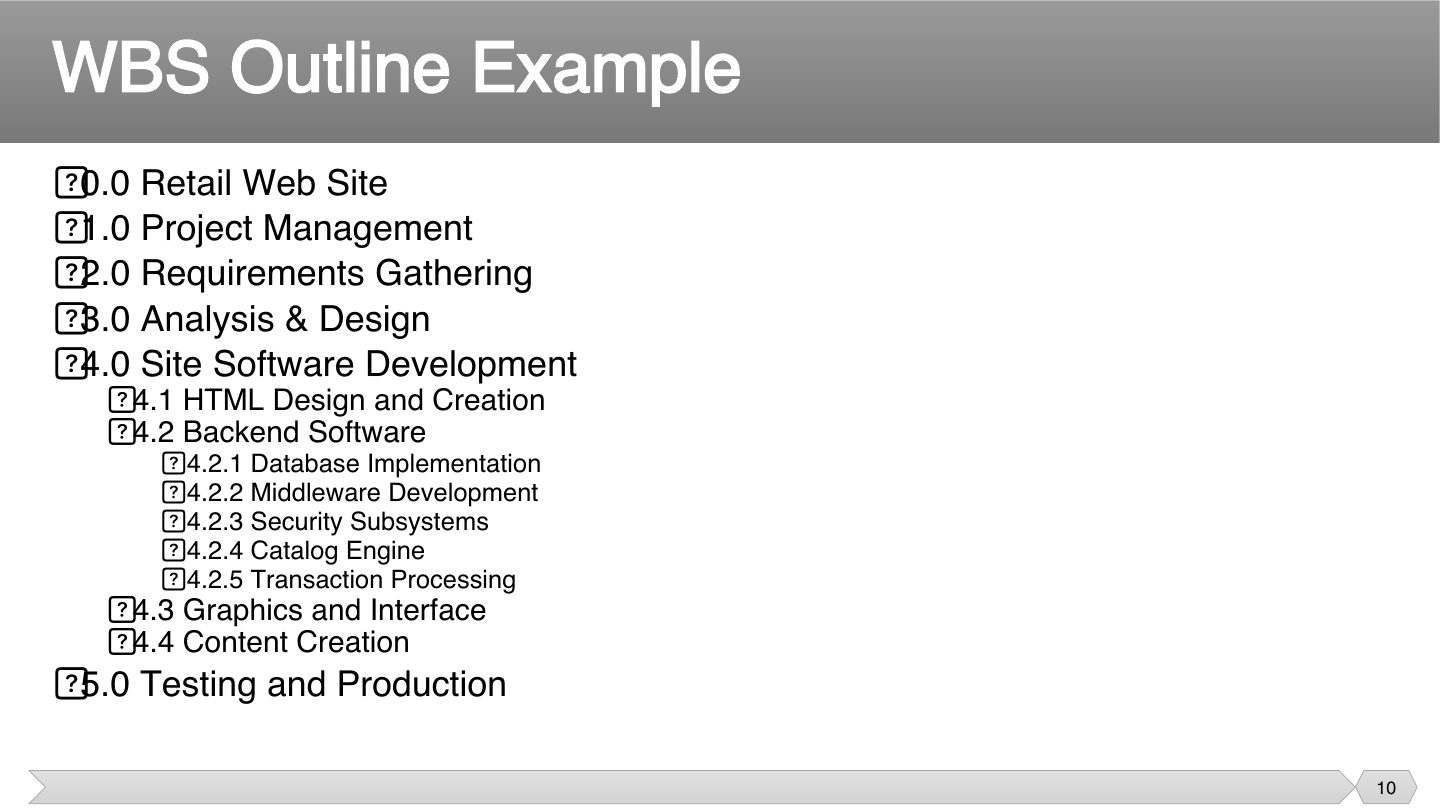
Numbering shows the hierarchy: 4.2.3 is under 4.2, which is under 4.0.
Exam angle
In a WBS outline, 4.2.3 sits under which item?
- That’s a different branch.
- That’s a different branch.
- That’s a sibling of 4.2.
- The numbering shows the hierarchy.
WBS Types
Notes
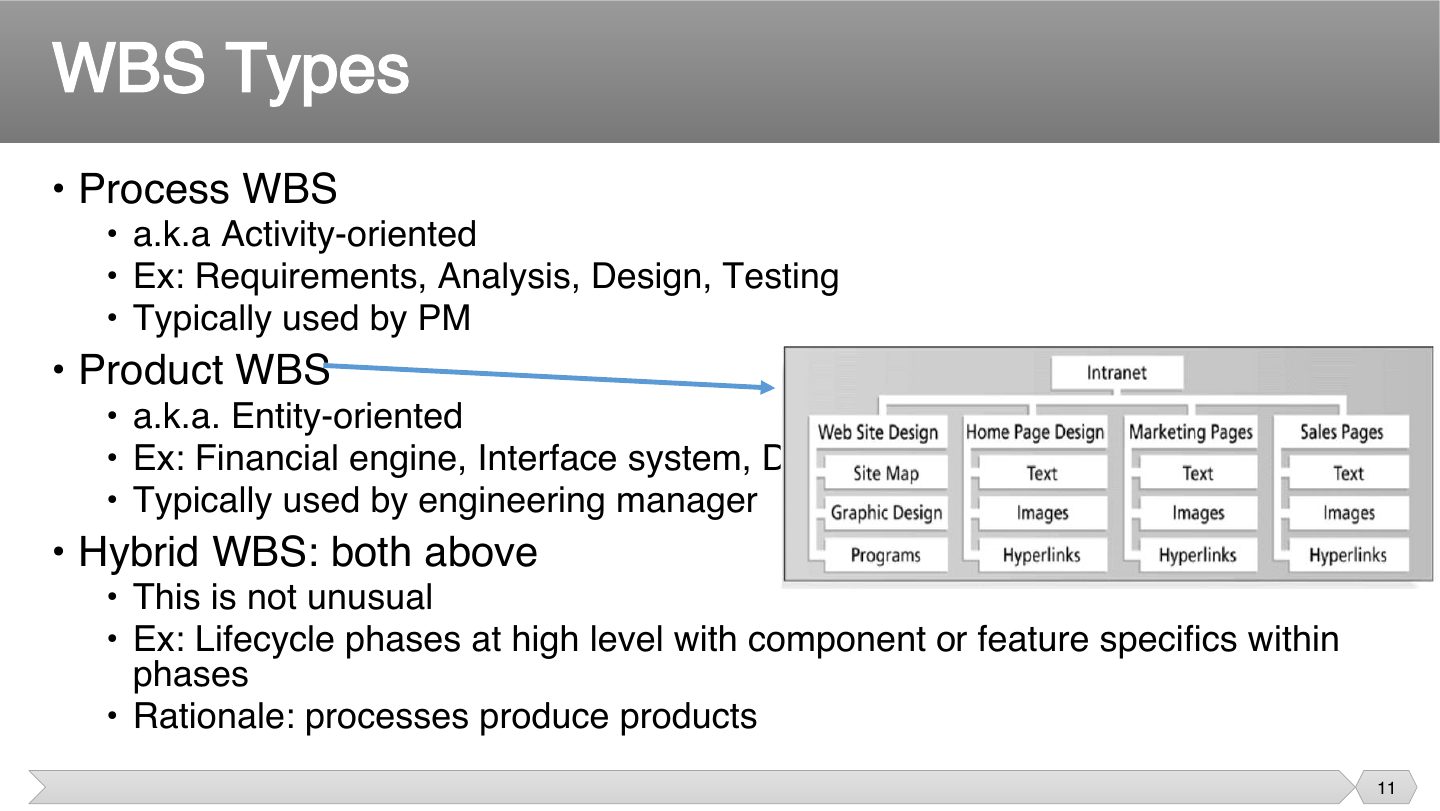
A process WBS asks “what steps do we go through?”, so it suits a PM tracking the work. It’s organized by activities such as requirements and testing.
A product WBS asks “what parts does it have?”, so it suits an engineering manager thinking about components such as the database.
Hybrid = phases on top, components inside. Common.
Tips & tricks
- HiPPo: Hybrid, Process, Product.
Exam angle
A WBS listing “Requirements, Design, Testing” is a:
Process WBS
Notes
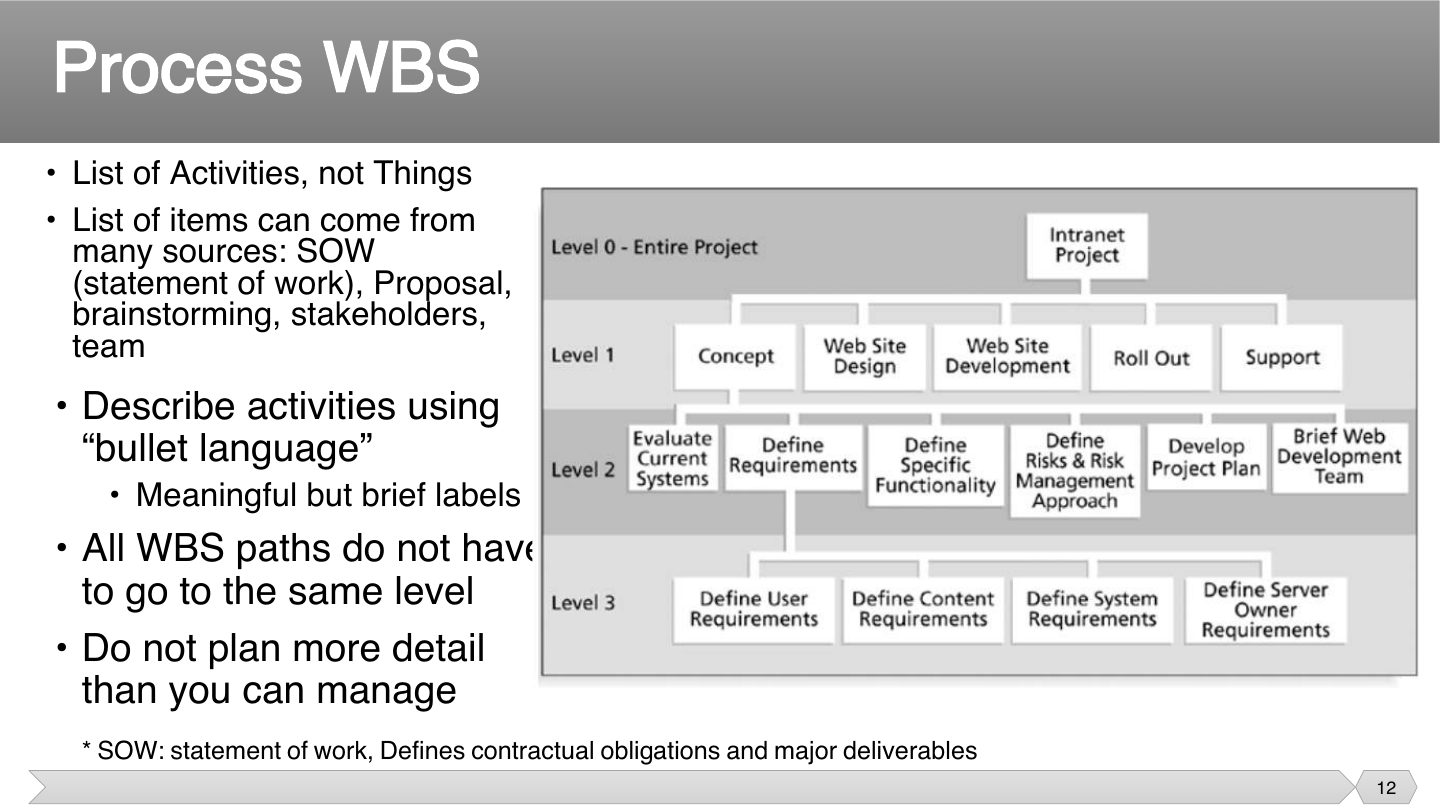
Short labels are easier to scan and discuss. Branches may end at different levels because some work needs more detail, and you shouldn’t plan beyond what you can actually manage.
Exam angle
Must all WBS branches go to the same depth?
- It’s stated generally.
- The slide says otherwise.
- Don’t plan more detail than you can manage.
- It’s stated generally.
Work Packages (Tasks)
Notes
This is the level where you can assign, budget and check the work. If you can’t say clearly when a work package is done, it’s not defined well enough.
Too big and you can’t see trouble until it’s late, and too small and you’re micromanaging. One-to-two gives a size that’s easy to estimate and easy to track.
Memory trick 8/80: no package under 8 hours (micromanaging) or over 80 hours (invisible).
Exam angle
According to the 8/80 rule, a work package should take:
WBS and Methodology
Notes
A WBS has to match how you’ll actually work. Iterative work loops, but a list can’t, so you “straighten” it by writing out each round. Operations usually aren’t included, as they happen after the project.
Exam angle
Why are operations and maintenance not normally in the plan?
- They do.
- That’s what the slide says.
- That isn’t it.
- They come after.
WBS Techniques
Notes
Choose by what you know. Clear problem? Work from the top. Similar past project? Reuse its structure. Still unclear? Rolling wave details near-term work now, and later work later.
Tips & tricks
- Slides 15 to 19, RABBiT: Rolling wave, Analogy, Bottom-up, Brainstorming, Top-down.
Exam angle
Which WBS technique plans 1–3 levels now and adds detail later?
- That’s the definition.
- That starts from detailed tasks.
- That reuses a similar WBS.
- That develops detail systematically from the top.
WBS Techniques
Notes
You can only break something down from the top if you understand it. So top-down suits a familiar problem. On something new, you’d miss parts without noticing.
Exam angle
When is top-down WBS best?
- You’d miss things.
- It’s widely used.
- That suits bottom-up.
- That’s on the slide.
WBS Techniques
Notes
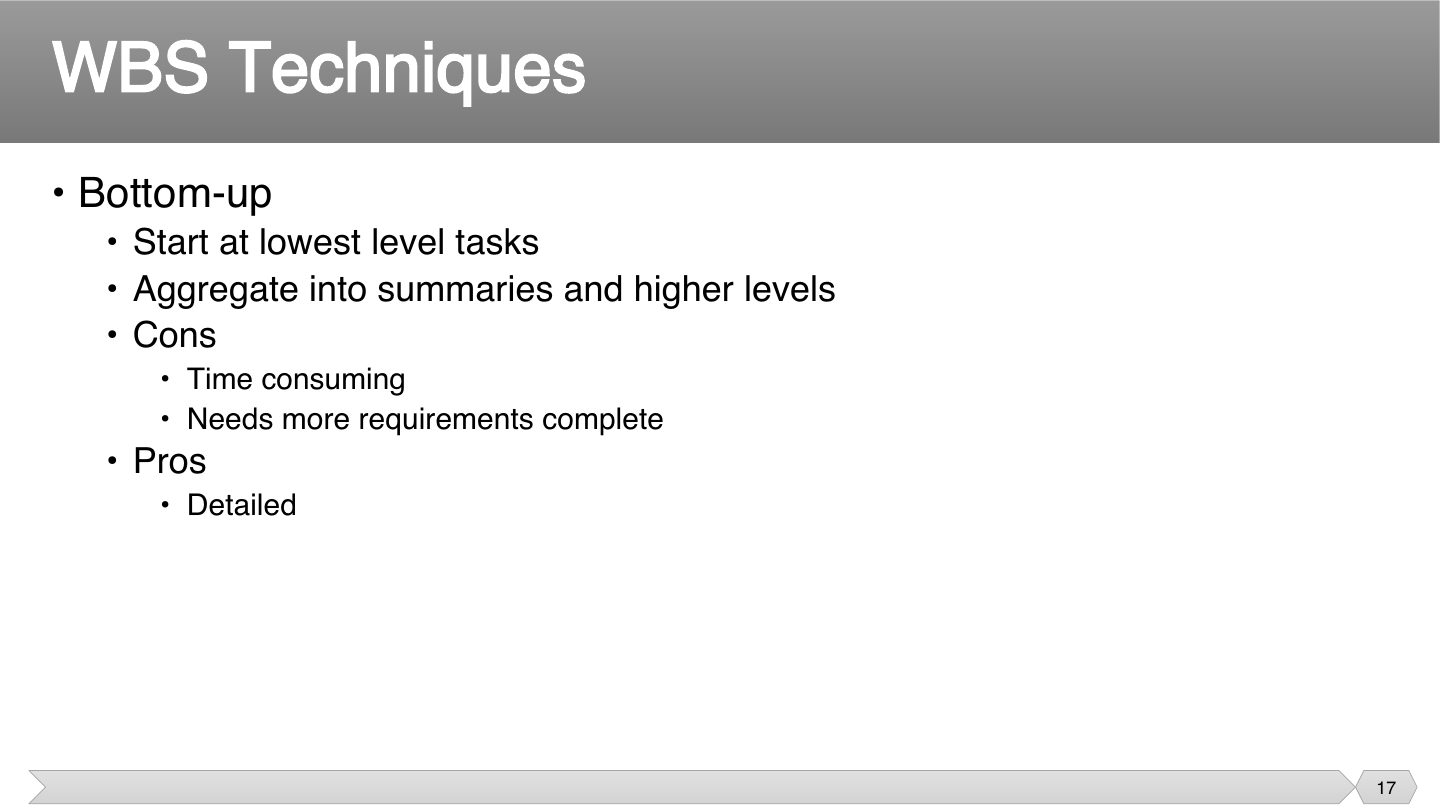
Starting from all the small tasks gives you lots of detail, but you need to know them first. So bottom-up needs more complete requirements and takes longer.
Exam angle
What is a drawback of bottom-up WBS?
- Those are its cons.
- It aggregates into summaries.
- People are needed.
- Detail is its strength.
WBS Techniques
Notes
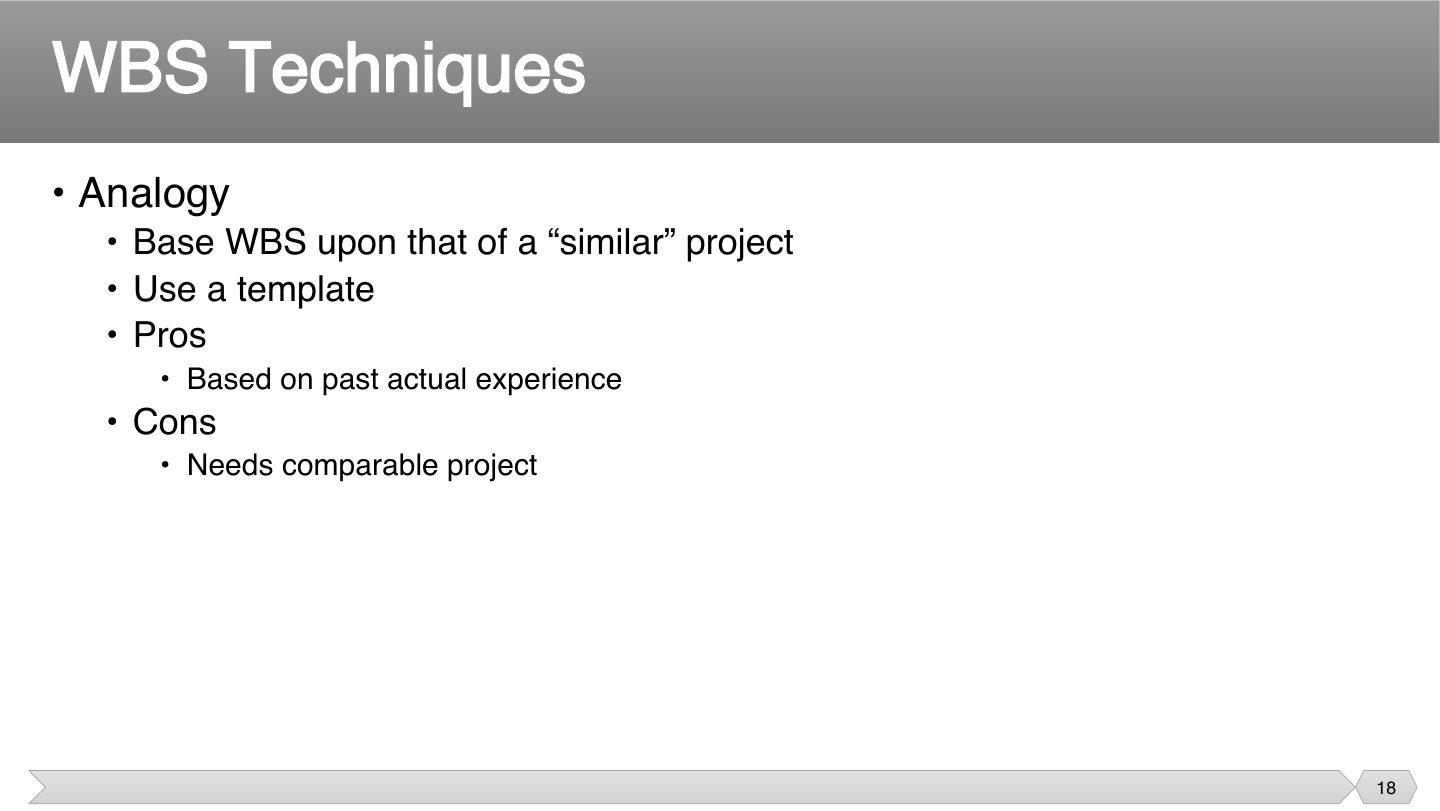
Why start from nothing if a similar project exists? A template saves time and reminds you of tasks you’d forget. But it only helps if that project is really comparable.
Exam angle
What does using analogy for a WBS need?
- That’s its stated con.
- It needs similarity.
- It relies on experience.
- That’s for risks.
WBS Techniques
Notes
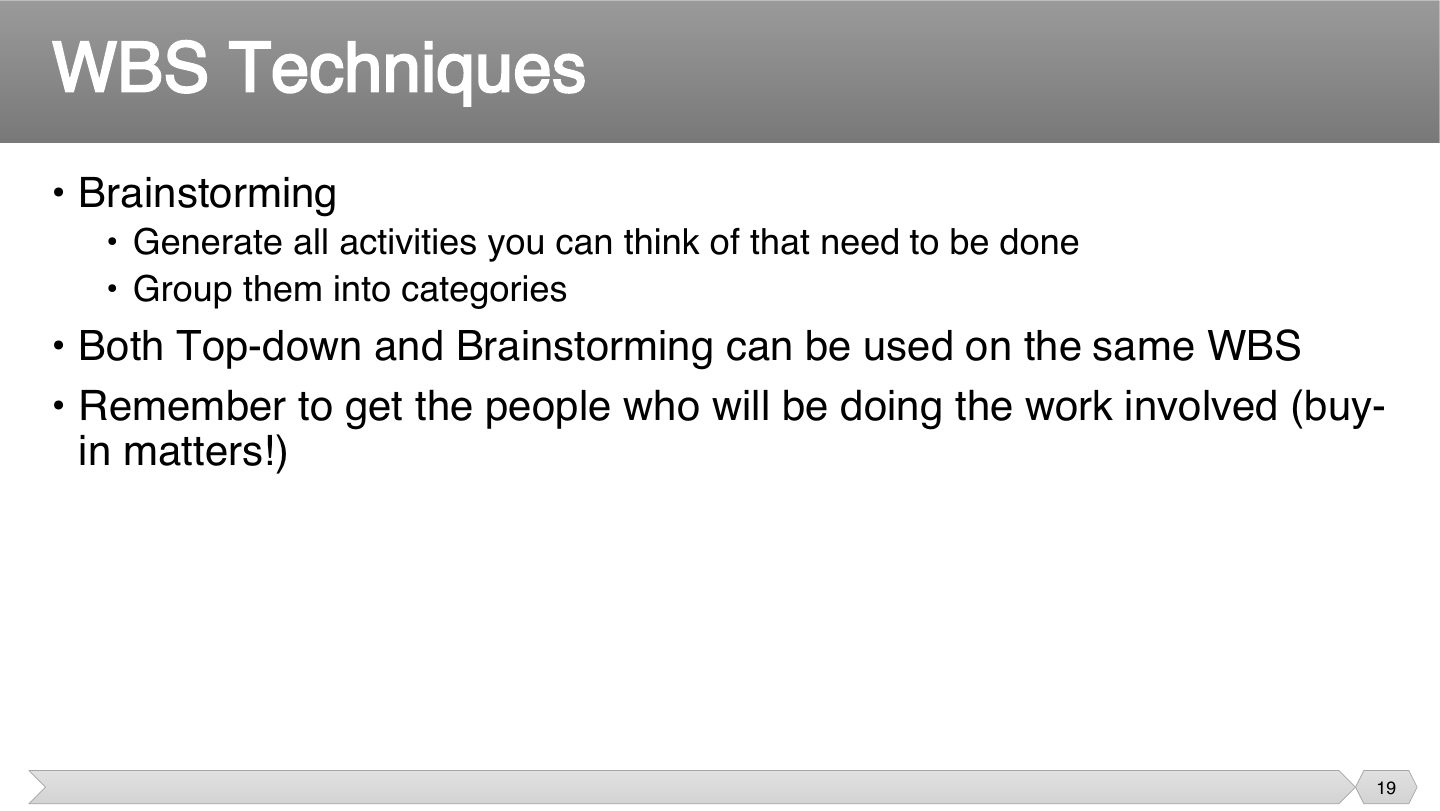
Brainstorming catches tasks that a formal breakdown misses. Bring in those doing the work, since they know what’s really involved and commit more to a plan they helped build.
Exam angle
Why involve people who’ll do the work when brainstorming a WBS?
- That’s the slide’s reminder.
- That isn’t the reason.
- It’s part of planning.
- That isn’t it.
WBS basis for many things
Notes
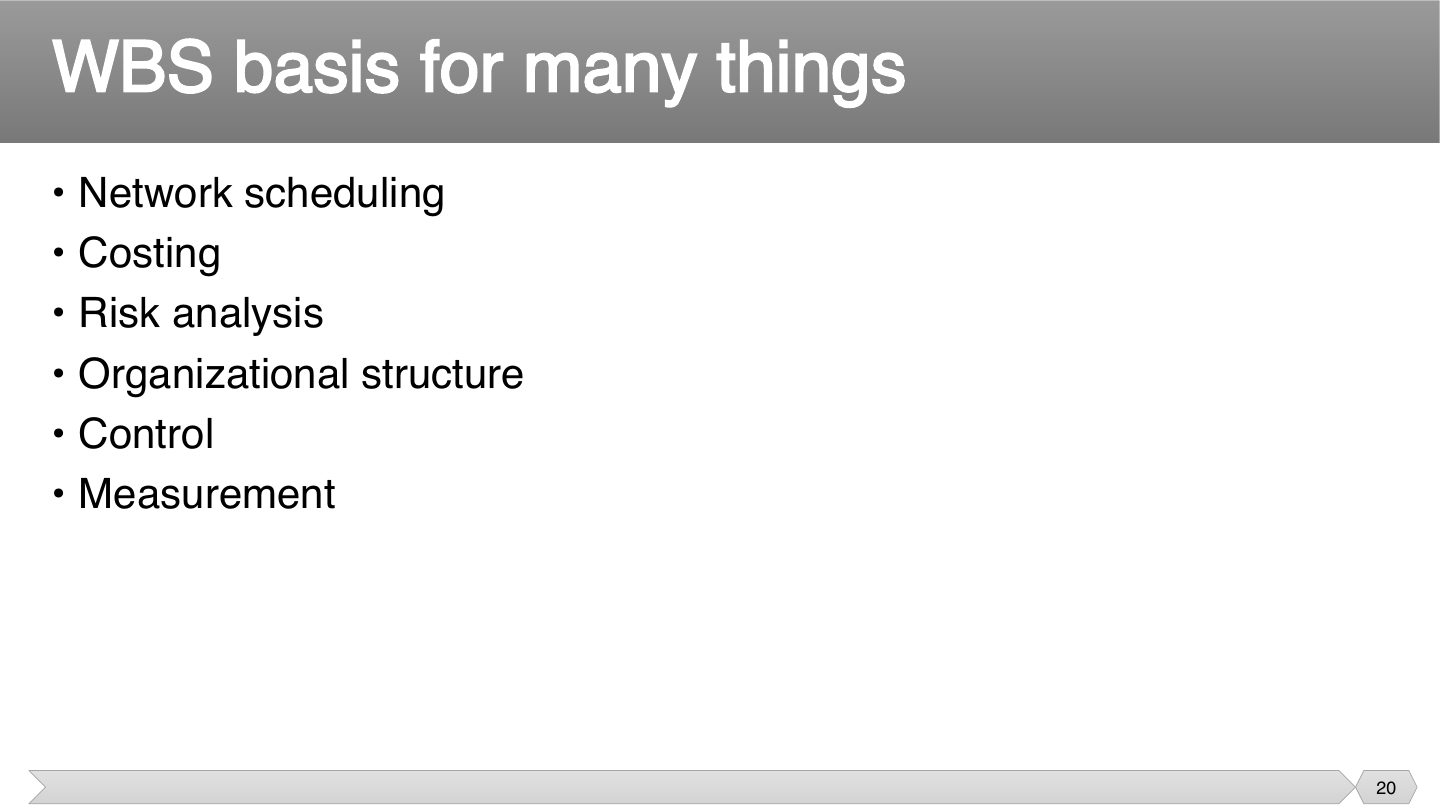
Almost everything hangs off the WBS: you cost it, schedule it and check risks against it. So a poor WBS spreads problems into all of them, which is why it’s worth getting right.
Tips & tricks
- CROC MaN: Costing, Risk analysis, Organizational structure, Control, Measurement, Network scheduling.
Exam angle
Which is based on the WBS?
- That’s unrelated.
- That’s unrelated.
- It’s on the slide’s list.
- That’s unrelated.
WBS Guidelines
Notes
You won’t schedule or budget for work you forgot, so it appears later as a surprise. That’s why what’s missing hurts most. Stop splitting once you can estimate a piece with confidence.
Exam angle
According to the guidelines, what often hurts most?
- Unlisted work has no time or money assigned.
- That’s common.
- That’s good practice.
- Those are recommended.
Network Analysis
Network Analysis
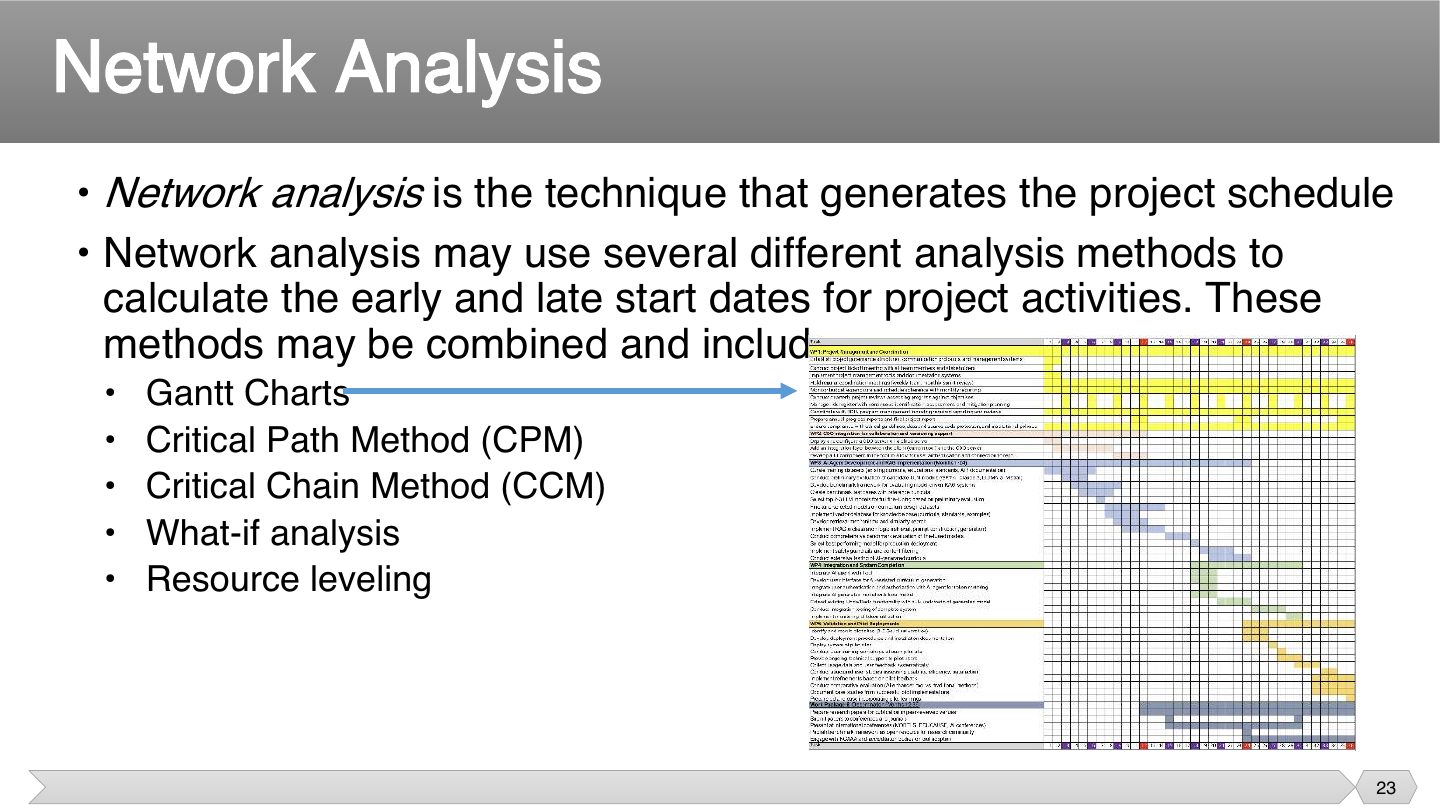
Notes
Having a list of tasks doesn’t make a schedule. Network analysis works out the dates, and each method answers a different question, such as “what can’t slip?” or “what if this is late?”.
Tips & tricks
- Sentence, in slide order: Good Crews Check Work Regularly. Gantt charts, Critical path, Critical chain, What-if analysis, Resource leveling.
Exam angle
Q2.1 · three scheduling techniques
Q2.3 · scheduling techniques and staying on track
Network Analysis
Notes
The precedence diagram shows what must happen before what. Seeing that lets you spot which tasks could run in parallel, and that’s how you find ways to shorten the schedule.
Exam angle
What does the Precedence Diagram Method establish?
- That’s on the slide.
- That’s procurement.
- That’s unrelated.
- That’s unrelated.
Network Analysis Terminology
Notes
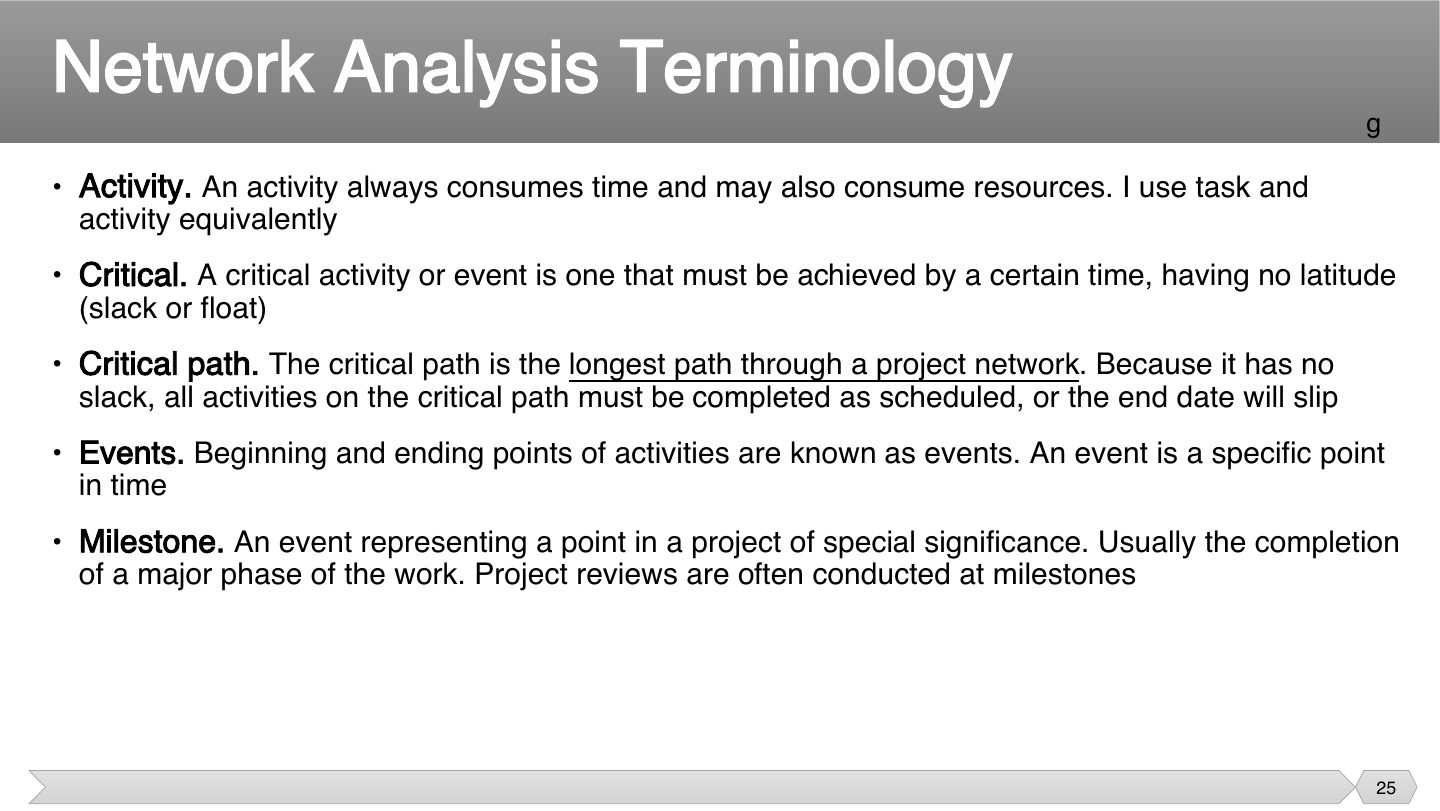
Why the longest path? Because the project can’t finish until its longest chain of work is done. Every task on it has no spare time, so any delay there moves the end date.
A milestone takes no time and uses no resources. It’s a checkpoint marking that something got done, such as a completed phase.
Trap The critical path is the LONGEST path, not the shortest. Its length is the SHORTEST possible project time.
Exam angle
Q4 · network diagram, ES/EF/LS/LF, slack, paths, minimum time
Q4 · network diagram and minimum completion time
Q1.2 · Gantt chart, milestone and dependency
Q6.2–6.4 · Gantt chart: what, advantages, limitations
The critical path is:
Creating a precedence table
Notes
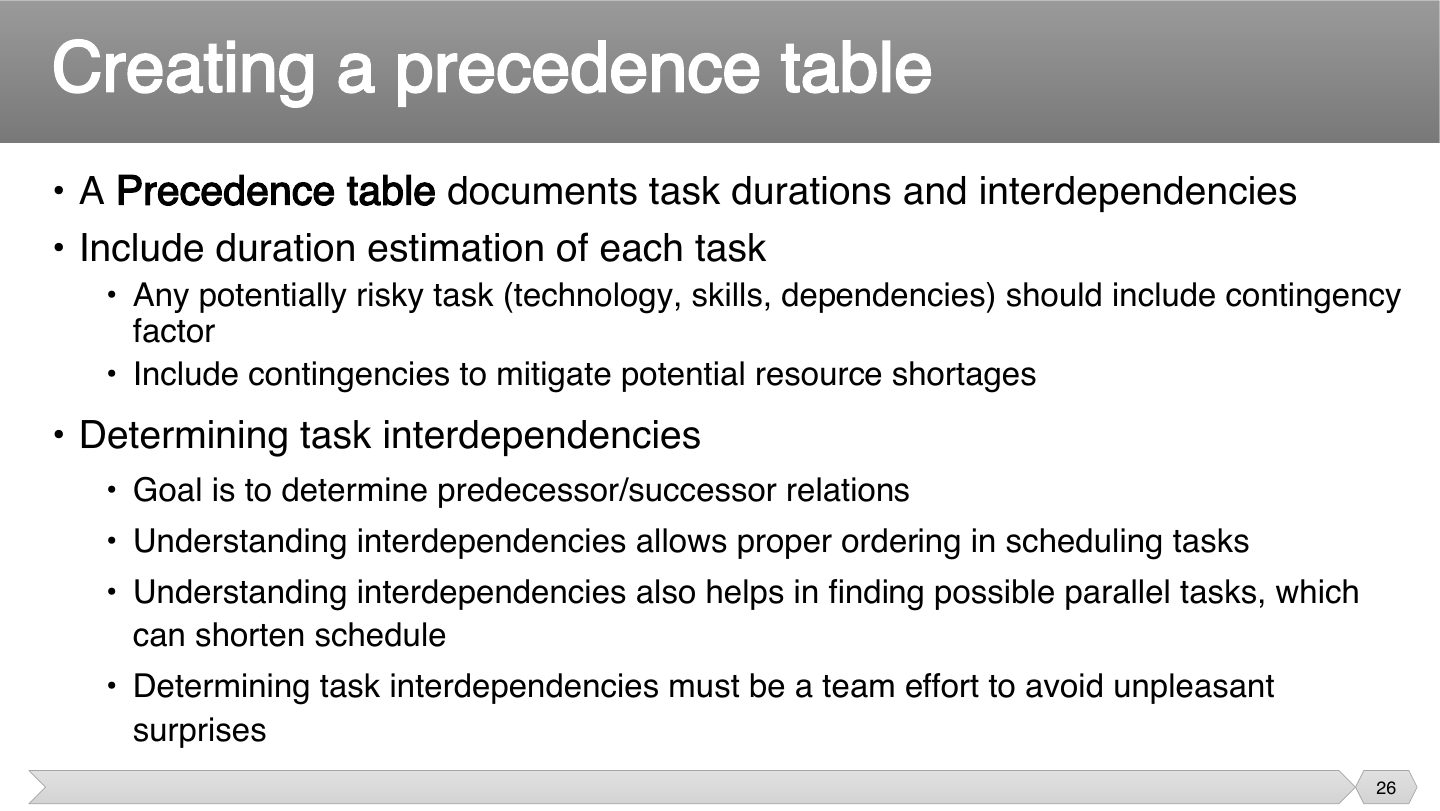
This is the input for the network diagram, so errors spread from here. Ask the team, since they know what really depends on what. Risky tasks get extra time here, rather than hidden later.
Exam angle
What’s in a precedence table?
- That’s a dashboard.
- That’s procurement.
- That’s the definition.
- It’s not just money.
Sample precedence table
Notes
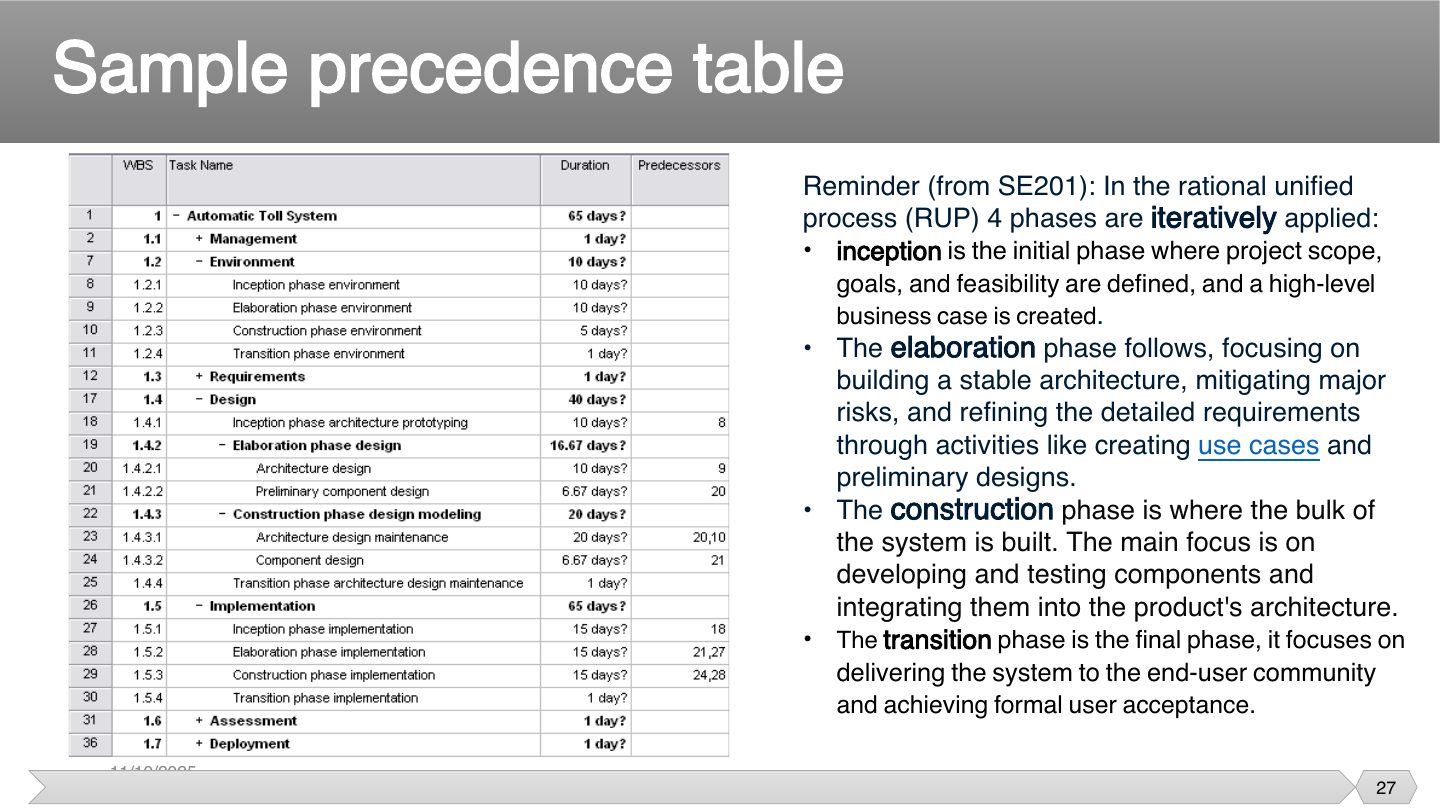
The right side of the original slide recaps the four RUP phases (see Chapter 4 slides 26–30).
Seen again Ch 4, slide 26: Iterative SDLC phases
Exam angle
A task has two predecessors. What does this mean?
- That’s how dependencies work by default.
- Both must finish.
- It has two.
- That’s reversed.
Precedence Network Diagram
Notes
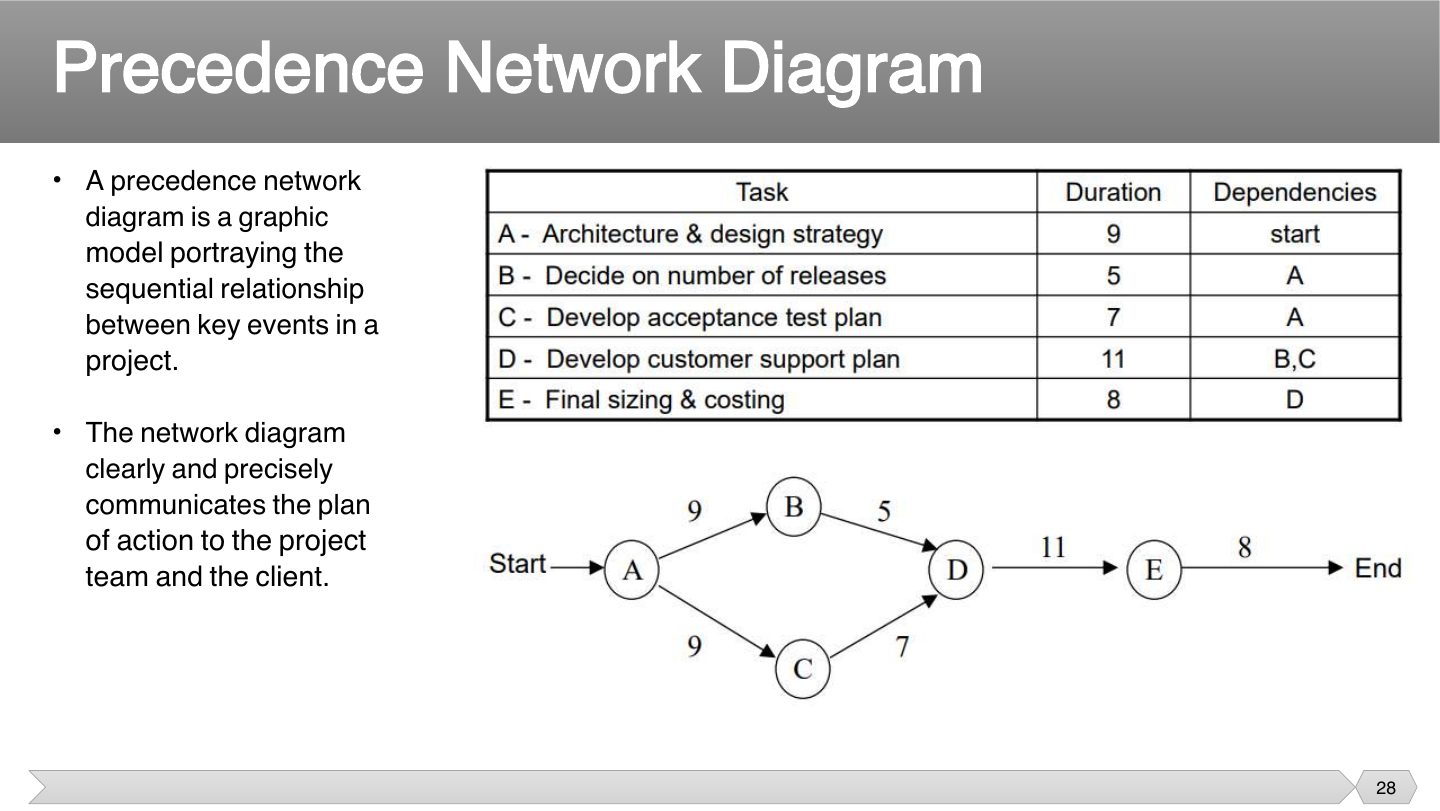
Draw: one node per activity, arrows from each predecessor. D has two predecessors (B, C), so two arrows enter D.
Tip Exam drawing: add Start and End nodes, write duration on each node, and check every activity in the table appears once.
Exam angle
Q4 · network diagram, ES/EF/LS/LF, slack, paths, minimum time
Q4 · network diagram and minimum completion time
Final 242 network: A5; B(A)5; C(A)7; D(A)9; E(B,D)3; F(E)5; G(F)2; H(C,G)2. Give ES/EF/LS/LF, slack, all paths and the minimum completion time.
Compare with the model answer
Forward pass: A 0–5, B 5–10, C 5–12, D 5–14, E 14–17, F 17–22, G 22–24, H 24–26. Backward pass (LS–LF): H 24–26, G 22–24, F 17–22, E 14–17, D 5–14, B 9–14, C 17–24, A 0–5. Slack (LF−EF): A 0, B 4, C 12, D 0, E 0, F 0, G 0, H 0. Paths: A-B-E-F-G-H = 22, A-D-E-F-G-H = 26, A-C-H = 14. Critical path A-D-E-F-G-H; minimum completion time 26.
PERT Estimation Technique
What is a PERT?
Notes
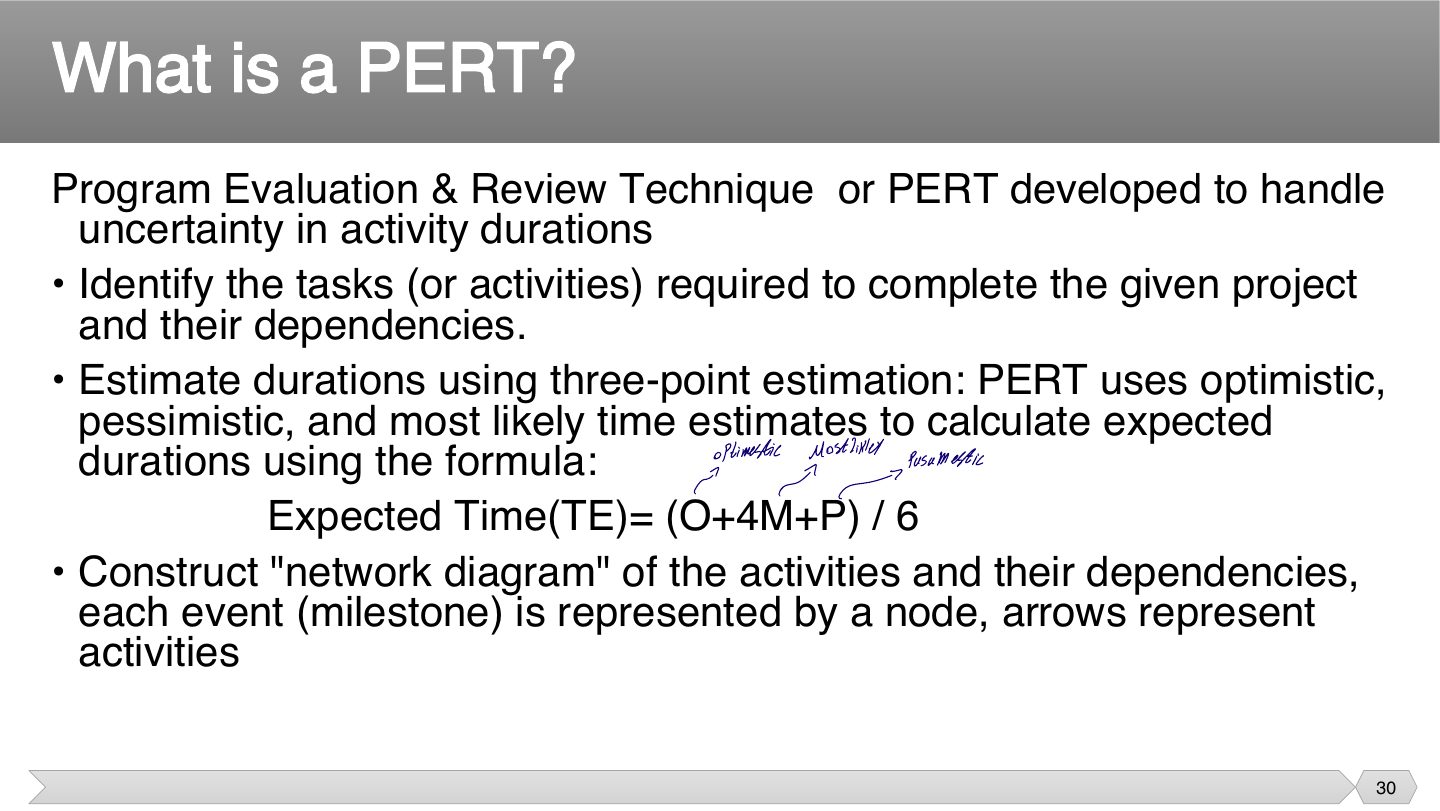
A single estimate pretends you know how long something takes. PERT uses three and weights the likely one, which reflects real uncertainty better, especially on new work.
Instructor Labels over the formula: optimistic, most likely, pessimistic.
Seen again Ch 6, slide 34: Three-point estimating
Exam angle
What does PERT handle that a single estimate doesn’t?
- That’s not it.
- That’s not it.
- That’s not it.
- It uses three estimates.
PERT
Notes
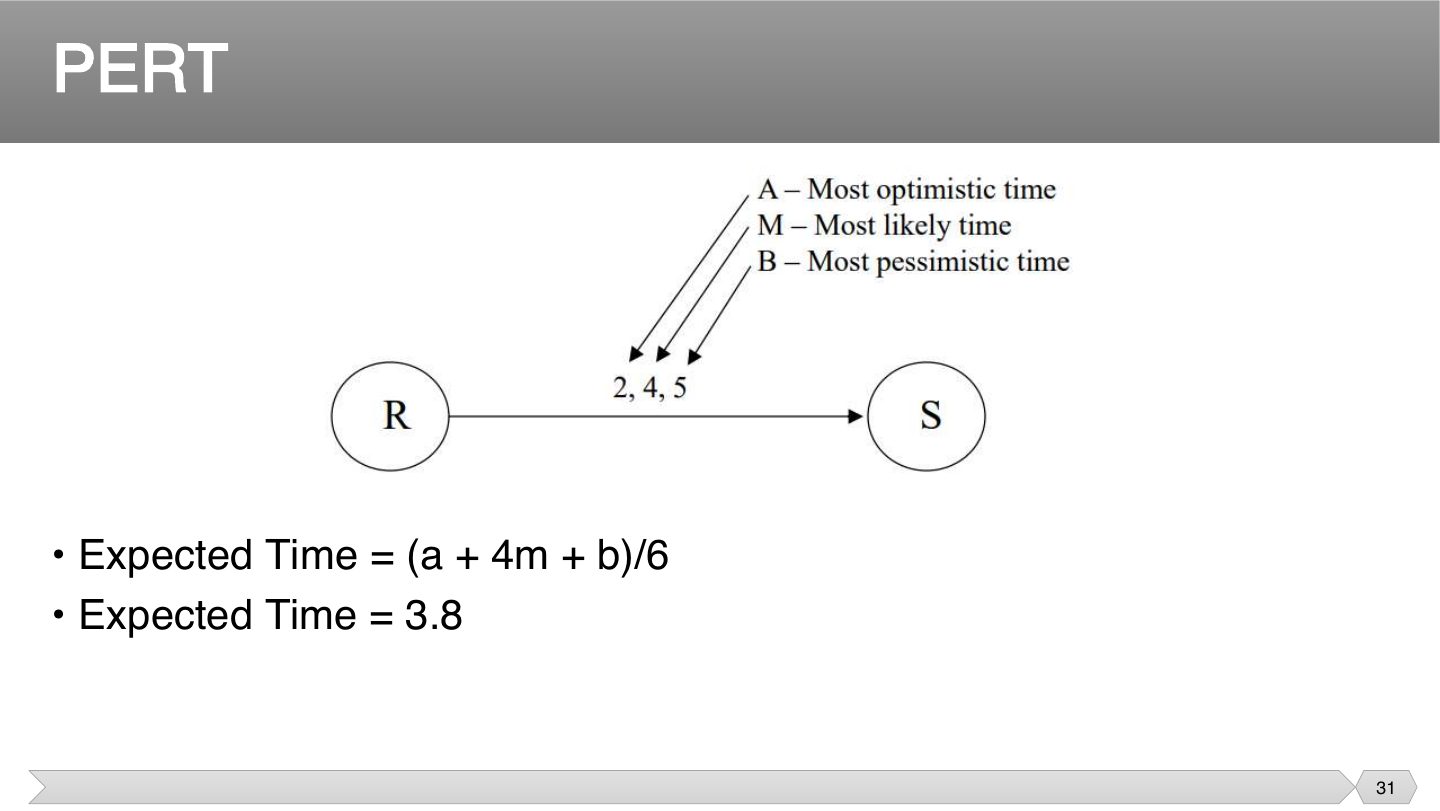
(2 + 4×4 + 5) / 6 = 23/6 ≈ 3.8.
Exam angle
O = 3, M = 6, P = 15. Expected time?
- (3 + 24 + 15)/6 = 7.
PERT Chart
Notes
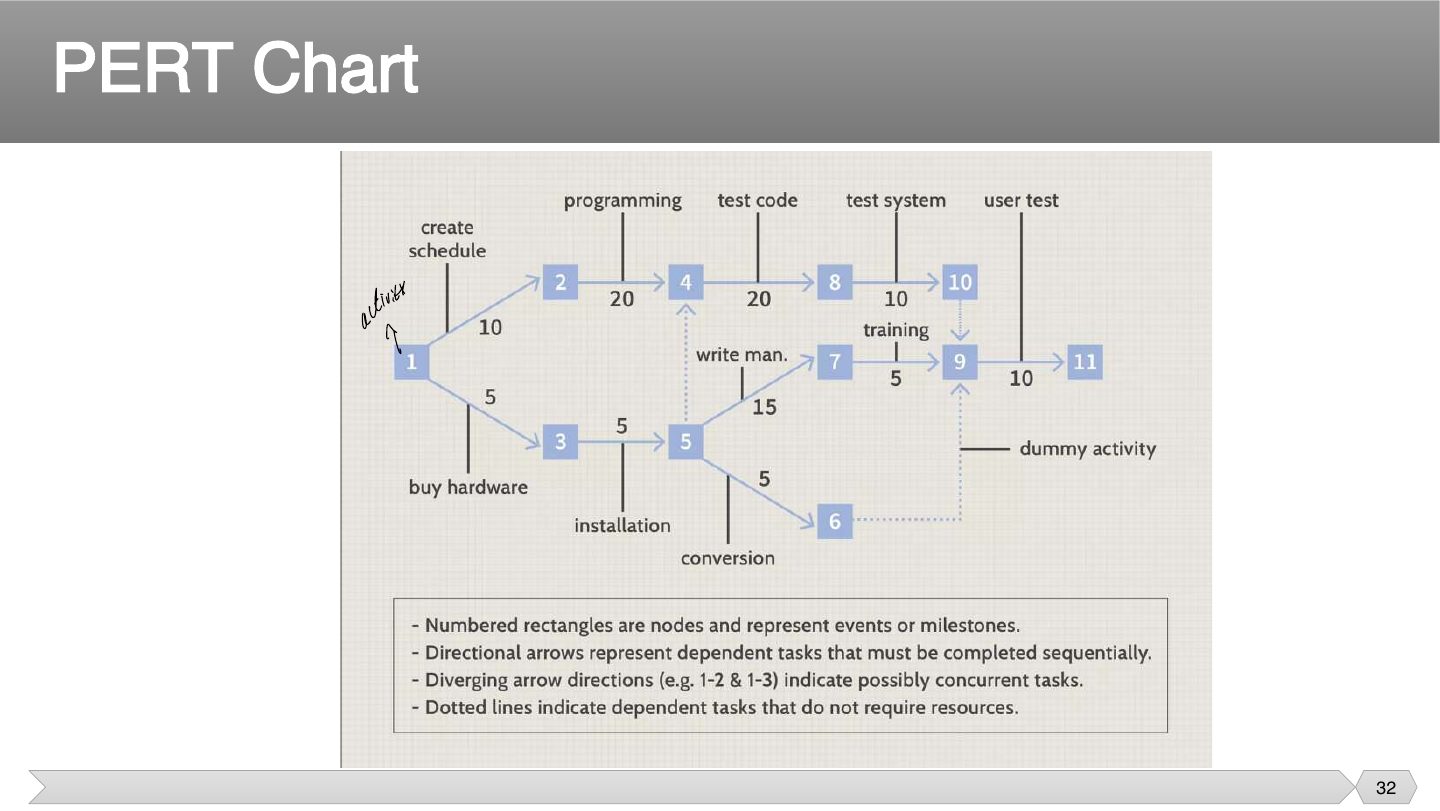
Here the circles mark points in time and the arrows carry the work. A dummy arrow takes no time, and only shows that one thing must wait for another.
Exam angle
In this PERT chart, what do the dotted arrows show?
- That’s not what it means.
- That’s not what it means.
- They show a dependency that takes no time.
- That’s not what dotted means.
PERT estimation technique
Notes
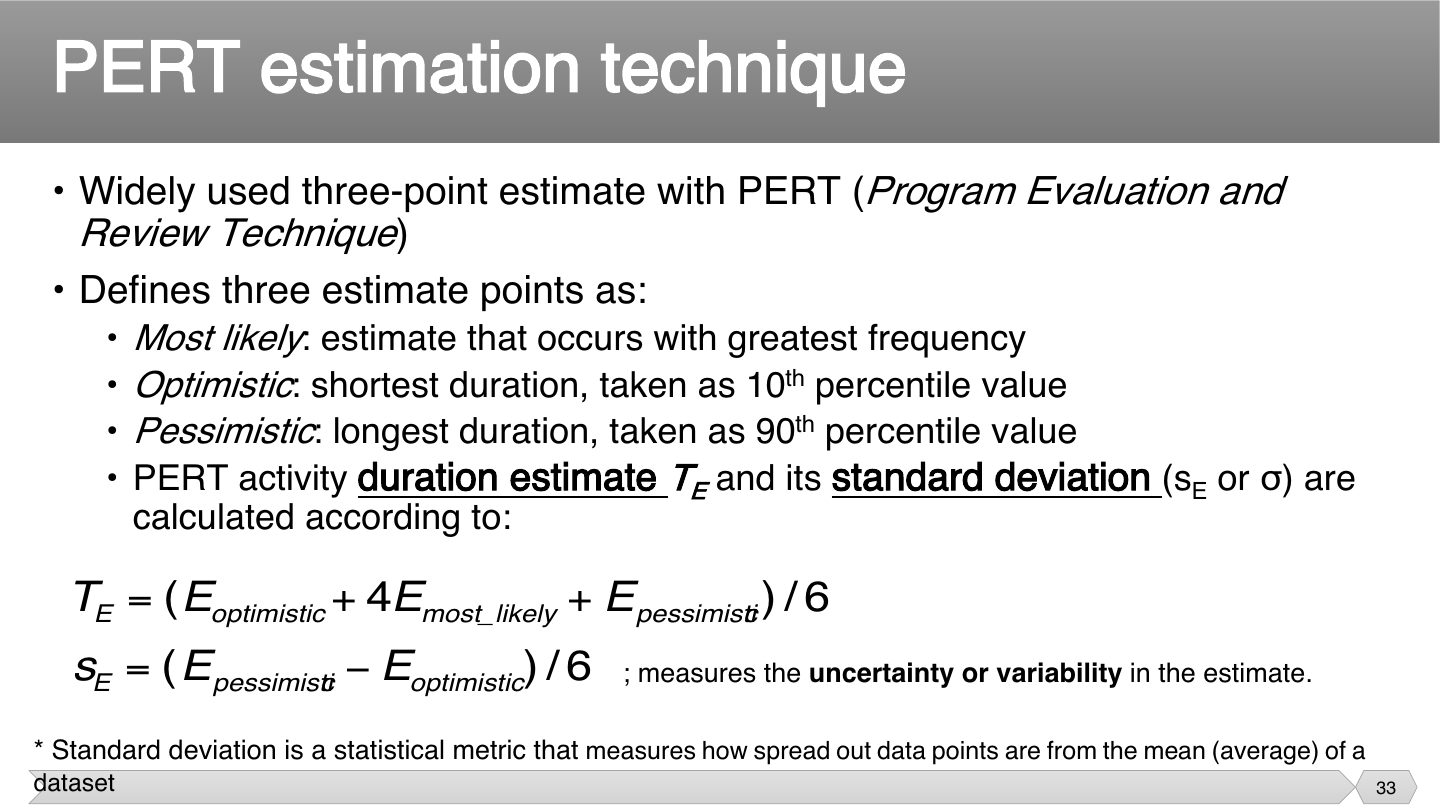
σ tells you how uncertain the estimate is. A task estimated at 4–6 days is much safer than one estimated at 1–20, even if they share the same expected time.
Tips & tricks
- MOP again: Most likely, Optimistic, Pessimistic.
Exam angle
O = 4, P = 16. What is the PERT standard deviation?
- (16 − 4)/6 = 2.
Slack Time
Notes
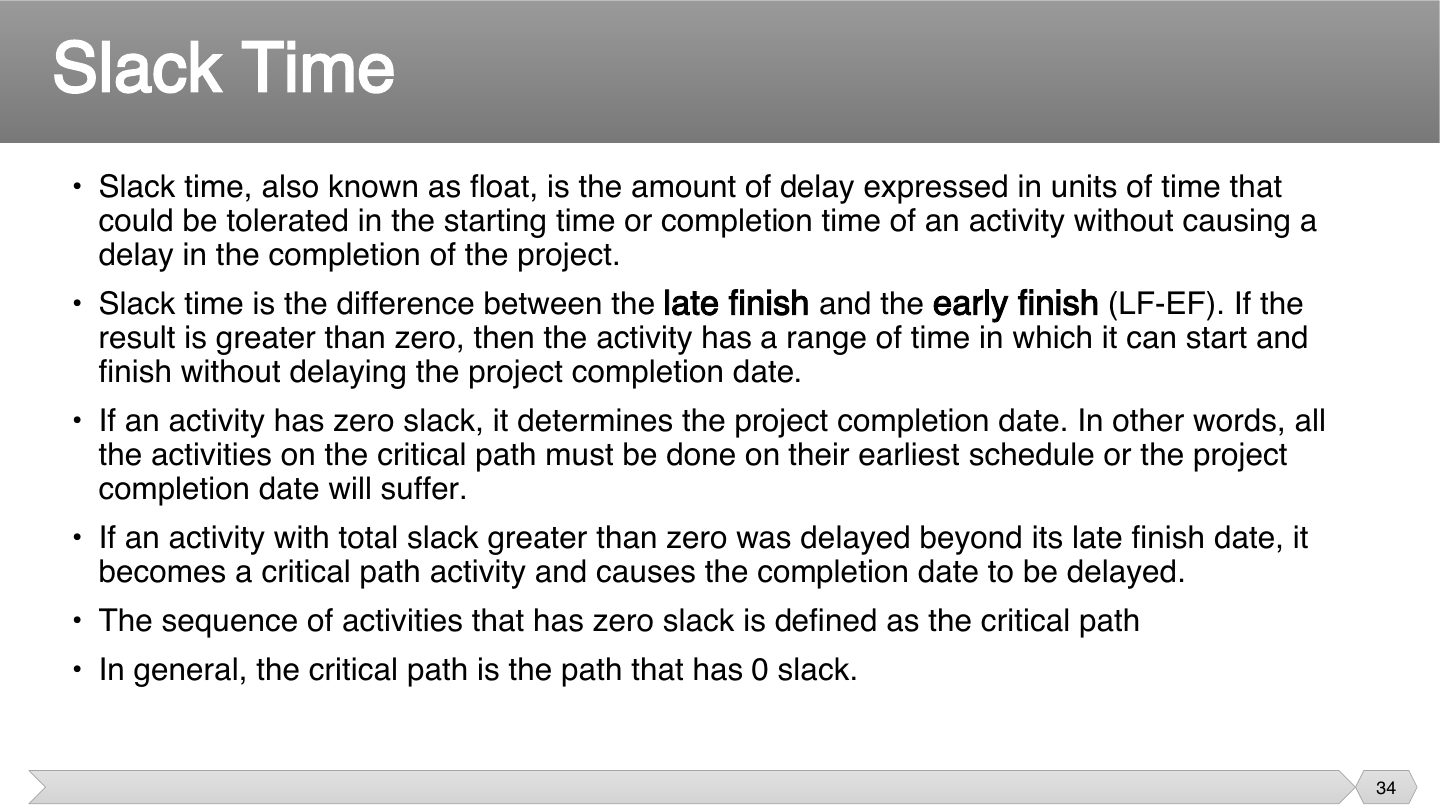
Slack is how much a task can slip without moving the end date. It’s worked out by comparing the latest and earliest finish.
If there’s no spare time, any delay moves the whole project. So zero slack is how you recognize a critical task.
Exam angle
Q4 · network diagram, ES/EF/LS/LF, slack, paths, minimum time
Q4 · network diagram and minimum completion time
Critical Path Method
Notes
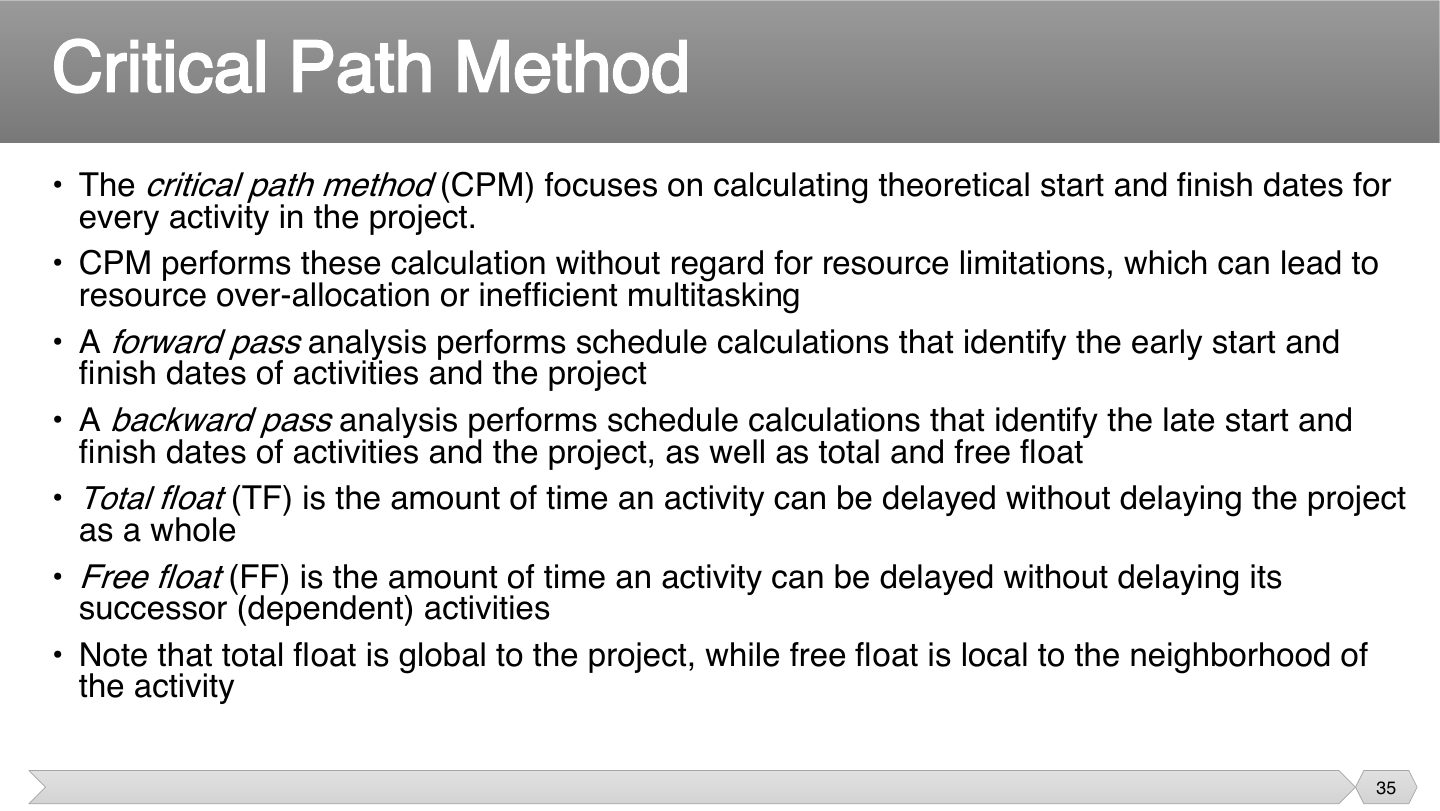
A task can’t start until everything before it is done, which is why you take the largest incoming finish time. Going forward tells you the earliest date the project can end.
Going back from the end, a task must finish before its earliest successor needs to start, so you take the smallest. This tells you how late each task may be, without delaying the end.
Both are spare time, but they differ in who’s affected. Using free float bothers nobody, while using up total float can squeeze later tasks, though the end date holds.
Memory trick Forward = MAX of incoming EFs. Backward = MIN of outgoing LSs.
Exam angle
Q4 · network diagram, ES/EF/LS/LF, slack, paths, minimum time
Q4 · network diagram and minimum completion time
Final 242 network: A5; B(A)5; C(A)7; D(A)9; E(B,D)3; F(E)5; G(F)2; H(C,G)2. Give ES/EF/LS/LF, slack, all paths and the minimum completion time.
Compare with the model answer
Forward pass: A 0–5, B 5–10, C 5–12, D 5–14, E 14–17, F 17–22, G 22–24, H 24–26. Backward pass (LS–LF): H 24–26, G 22–24, F 17–22, E 14–17, D 5–14, B 9–14, C 17–24, A 0–5. Slack (LF−EF): A 0, B 4, C 12, D 0, E 0, F 0, G 0, H 0. Paths: A-B-E-F-G-H = 22, A-D-E-F-G-H = 26, A-C-H = 14. Critical path A-D-E-F-G-H; minimum completion time 26.
CPM schedules activities without regard to:
- That is what the Critical Chain Method fixes.
Critical Path Method
Notes
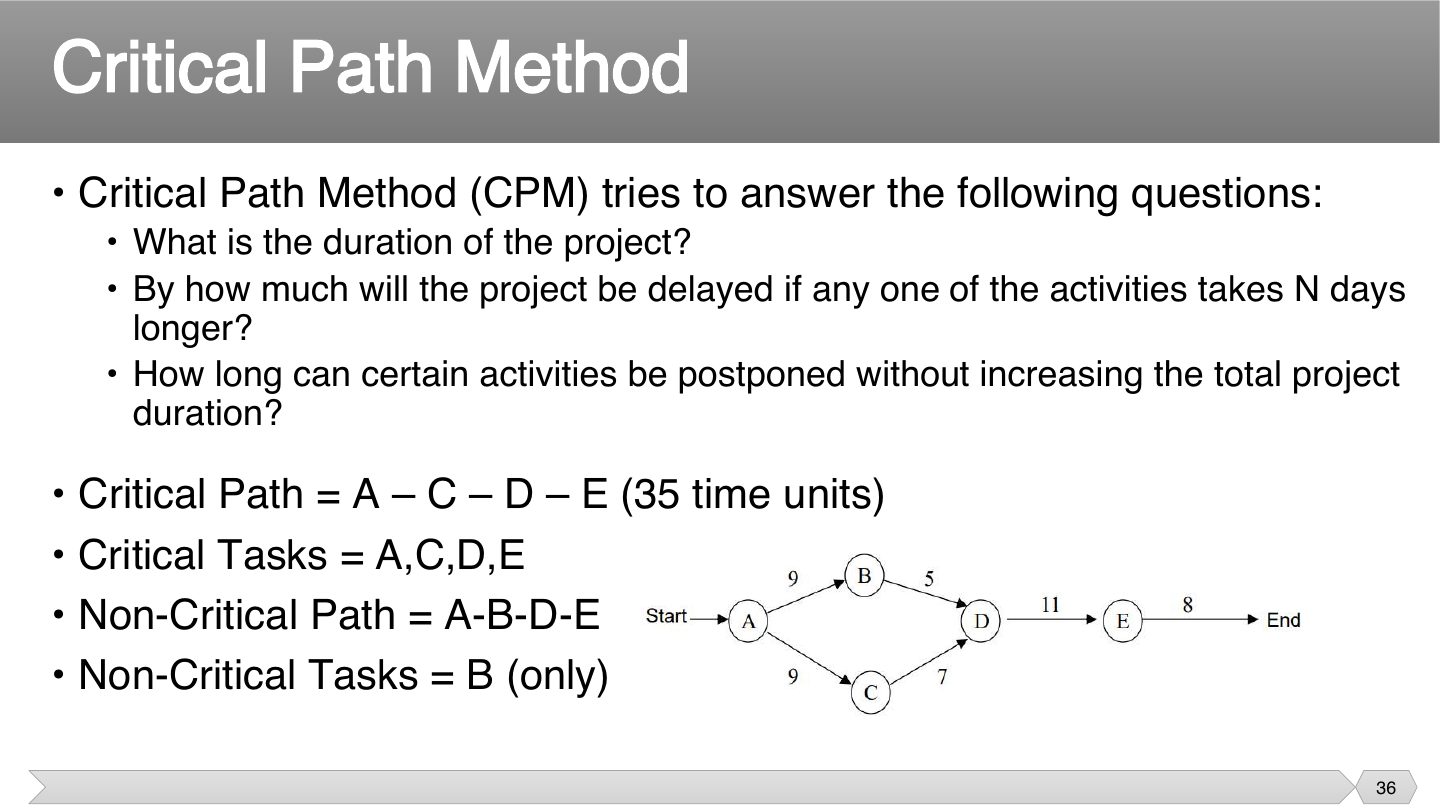
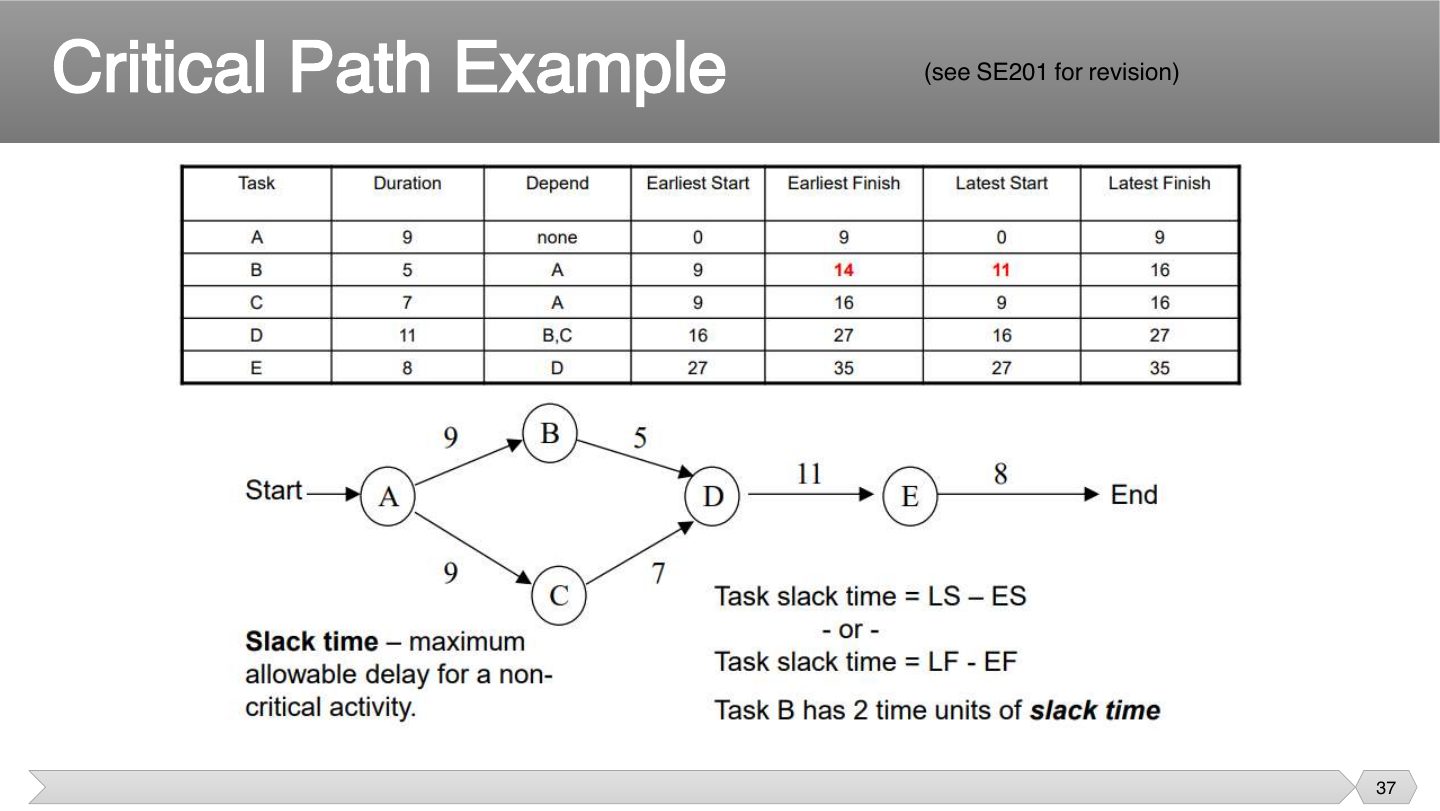
A-C-D-E = 9 + 7 + 11 + 8 = 35 (C is 7 in the table on slide 37). A-B-D-E = 33, so only B has slack (2).
Exam angle
Which question does CPM try to answer?
- That’s a stakeholder metric.
- That’s procurement.
- That isn’t a CPM question.
- It’s on the slide.
Critical Path Example
Notes
Read the table: B ES 9 / EF 14 / LS 11 / LF 16 → slack 2. All others 0 → critical path A-C-D-E.
Exam angle
Q4 · network diagram, ES/EF/LS/LF, slack, paths, minimum time
Q4 · network diagram and minimum completion time
Final 251 network: A6(start); B9(A); C3(B); D4(A); E5(C); F7(C); G6(D,E); H12(F); I6(G); J7(H,I). What is the minimum completion time?
Compare with the model answer
Forward pass: A 0–6, B 6–15, C 15–18, D 6–10, E 18–23, F 18–25, G 23–29 (waits for E), H 25–37, I 29–35, J 37–44 (waits for H). Minimum completion time = 44, critical path A-B-C-F-H-J (6+9+3+7+12+7). The other end-to-end paths are shorter (A-B-C-E-G-I-J = 42, A-D-G-I-J = 29).
What is a Gantt chart?
Notes
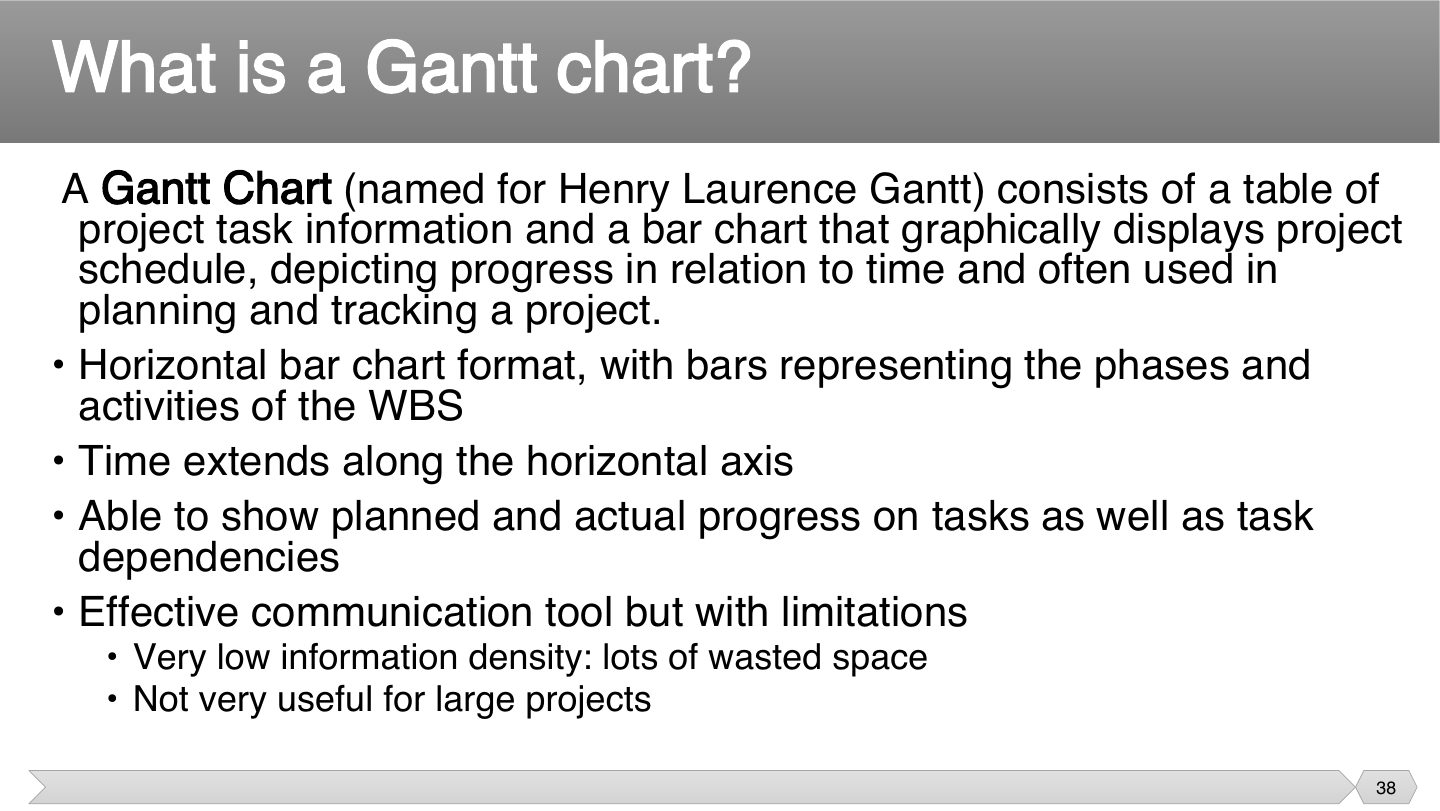
It works because you can read progress at a glance. But all those bars say little about what’s really critical, and with thousands of tasks the chart becomes unreadable. Hence its low information density.
A big chart of mostly empty space shows few facts per page. That’s fine for a small project, but a large one needs network analysis as well.
Exam angle
Q1.2 · Gantt chart, milestone and dependency
Q6.2–6.4 · Gantt chart: what, advantages, limitations
Gantt Chart
Gantt Chart
Notes
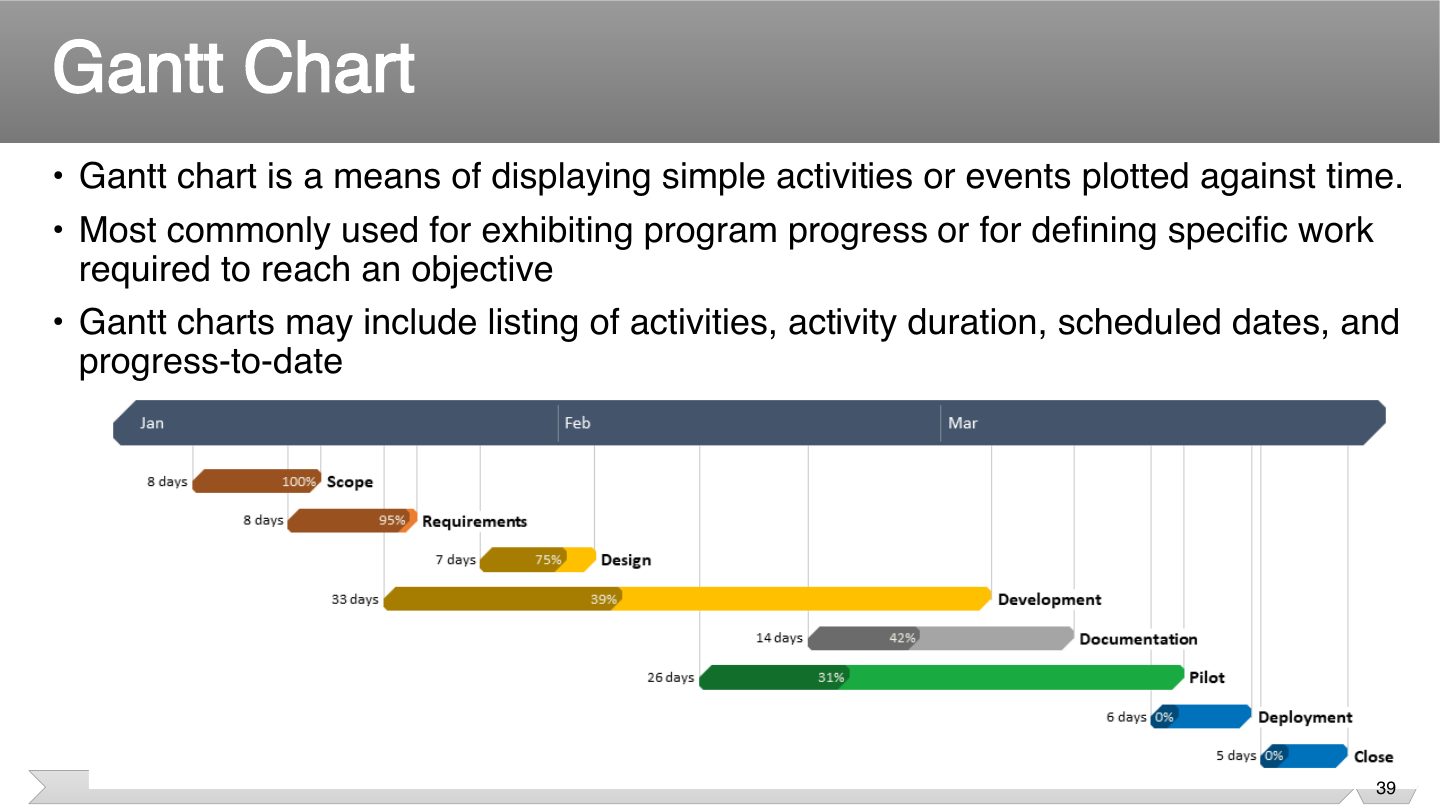
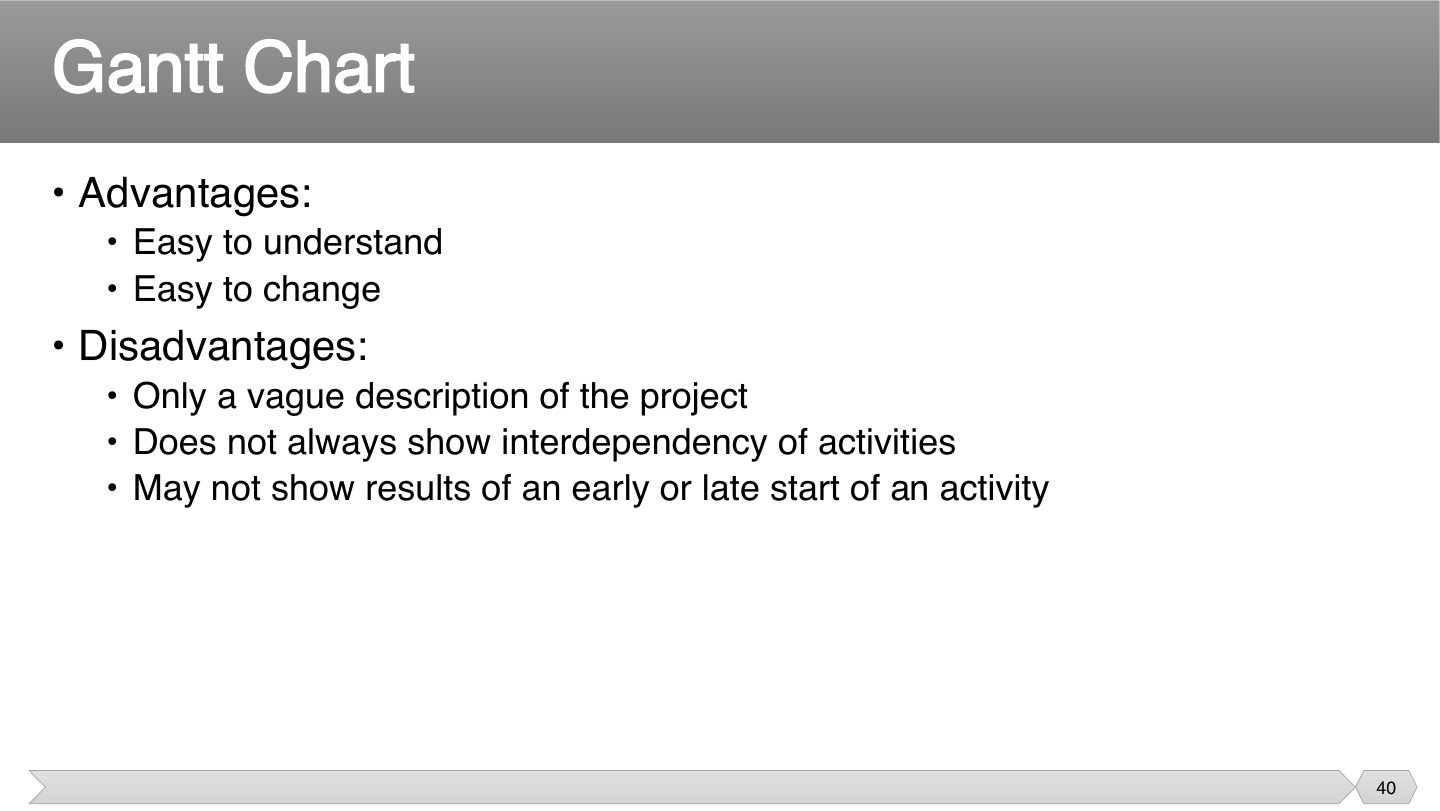
Anyone can read a bar chart, and bars are easy to move. That’s why it’s so widely used for reporting, including to non-technical people.
A bar shows when, not why. So moving one task may affect others without the chart showing it. That’s the risk of relying on a Gantt chart alone.
Exam angle
Q1.2 · Gantt chart, milestone and dependency
Q6.2–6.4 · Gantt chart: what, advantages, limitations
What is a Gantt chart, what does it show, and give two advantages and two limitations.
Compare with the model answer
A Gantt chart (Henry Gantt) is a task table plus a horizontal bar chart against a time axis. Each bar is an activity or WBS phase; it shows start/end dates, durations, planned vs actual progress, and can show milestones (zero-length diamonds, e.g. “requirements signed off”) and dependencies (arrows, e.g. testing starts after coding finishes). Advantages: easy to understand and communicate; easy to update. Limitations: low information density and unwieldy for large projects; dependencies and the critical path are not always visible, so you can’t see the effect of an early or late start.
Gantt Example
Notes
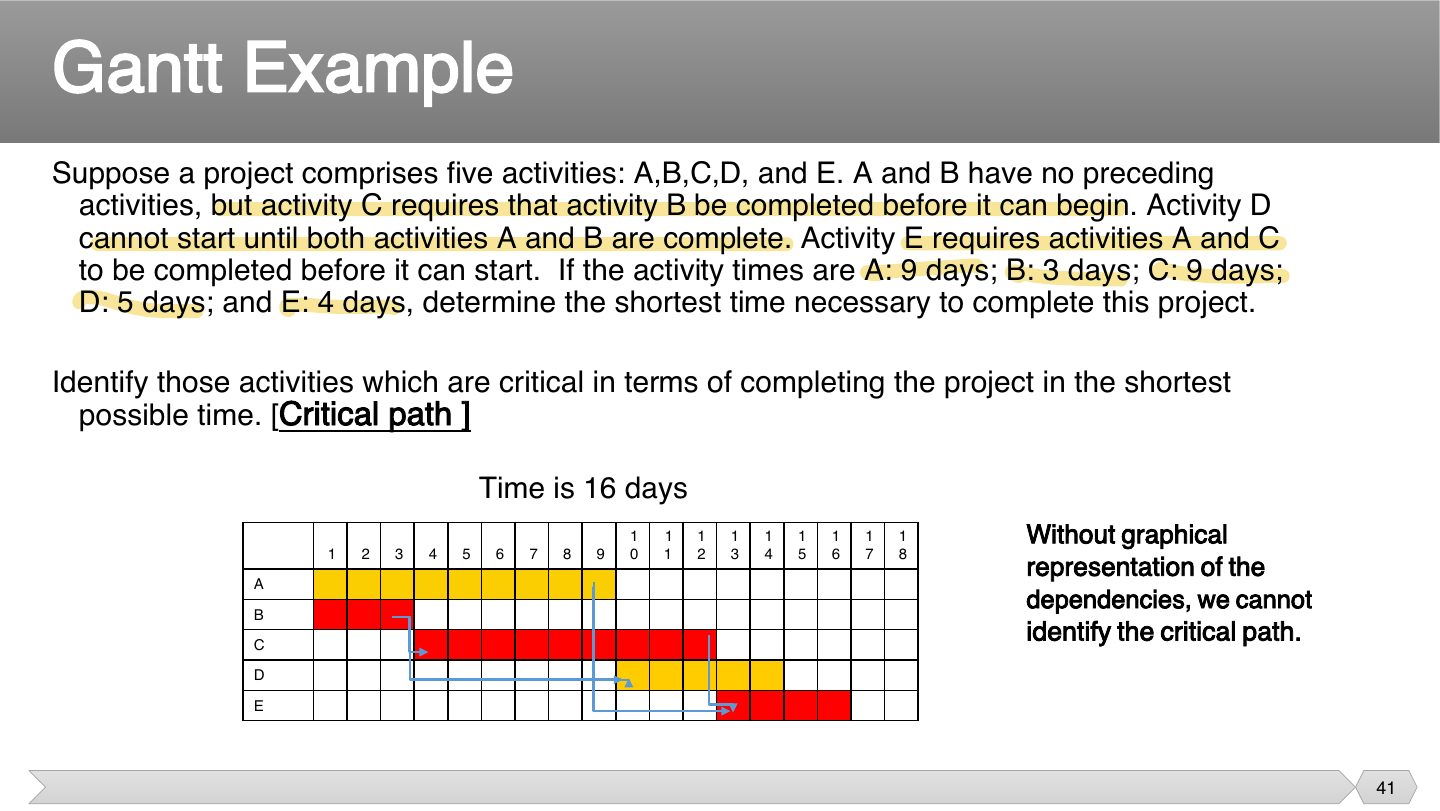
Answer: B → C → E = 3 + 9 + 4 = 16 days is critical. A (9) and D have slack.
Trap A Gantt alone hides the critical path. Draw the network.
Exam angle
In this example, which path is critical?
Critical Chain Method
Notes
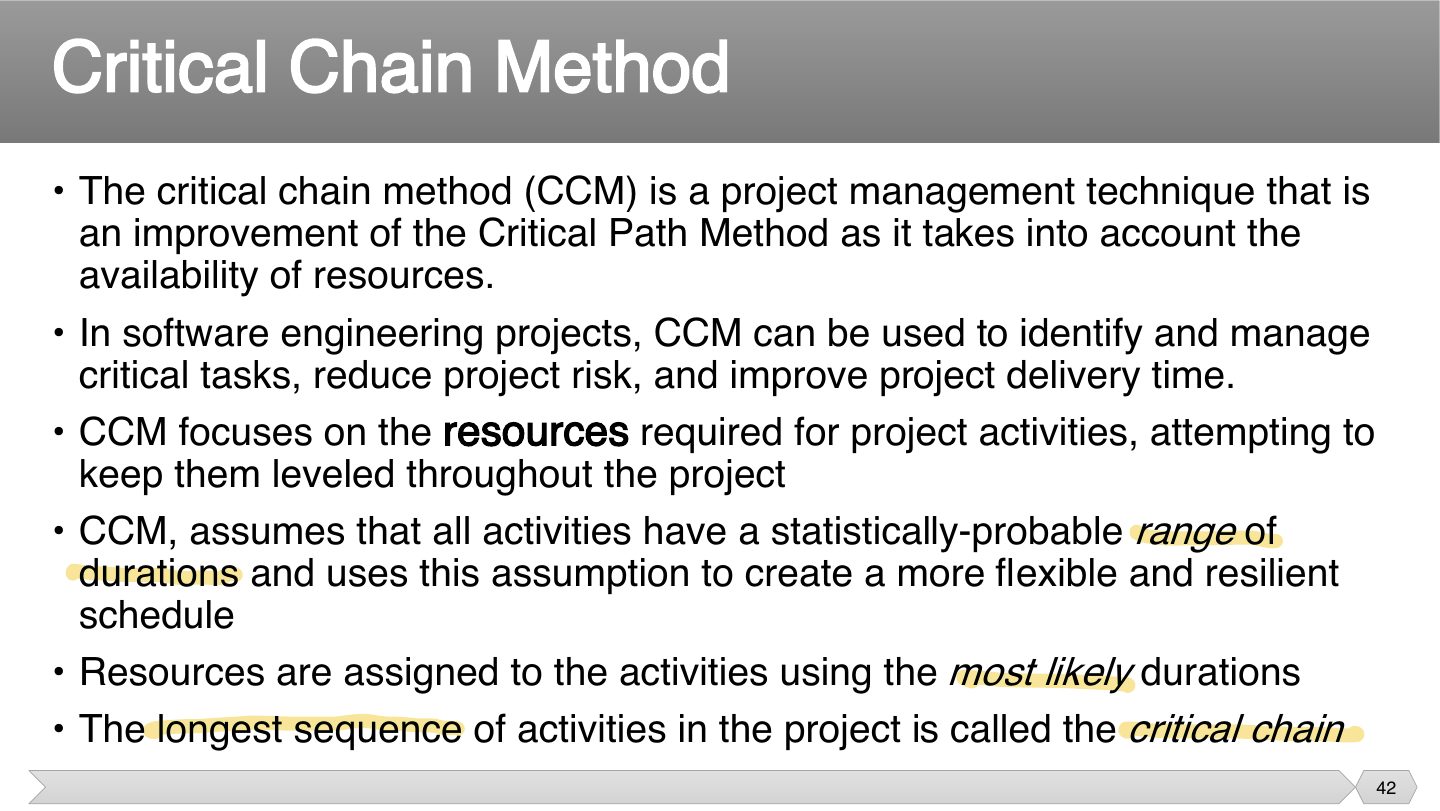
CPM assumes people are always available, which isn’t realistic. CCM asks “is the person actually free?”, so the longest chain may change once you consider resources.
Trap CPM ignores resources. CCM includes them.
Exam angle
How does the Critical Chain Method improve on CPM?
Critical Chain Method
Notes
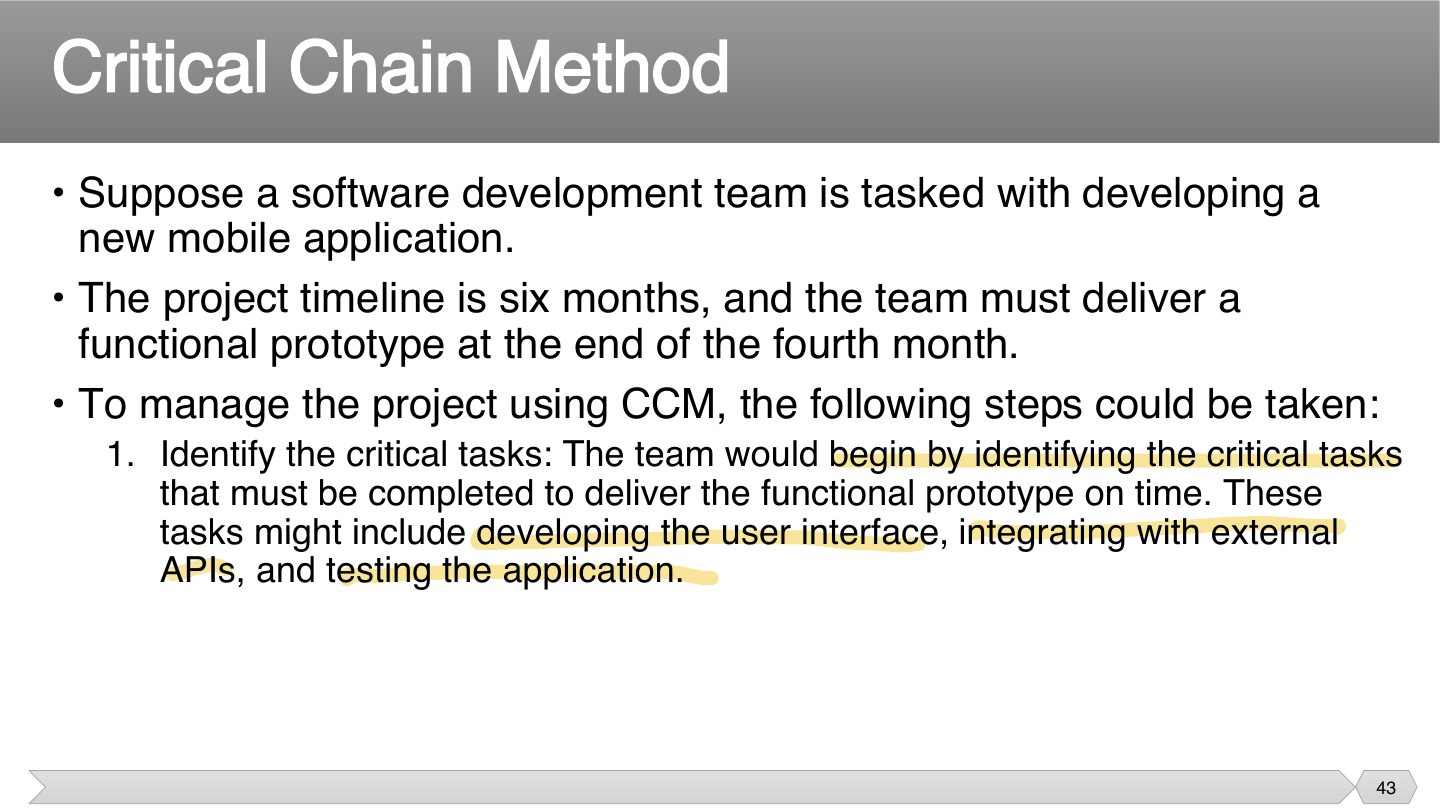
CCM example: mobile app, prototype due in month 4.
Exam angle
Which project does the CCM example describe?
- It isn’t that.
- It isn’t that.
- It isn’t that.
- That’s the scenario.
Critical Chain Method
Notes
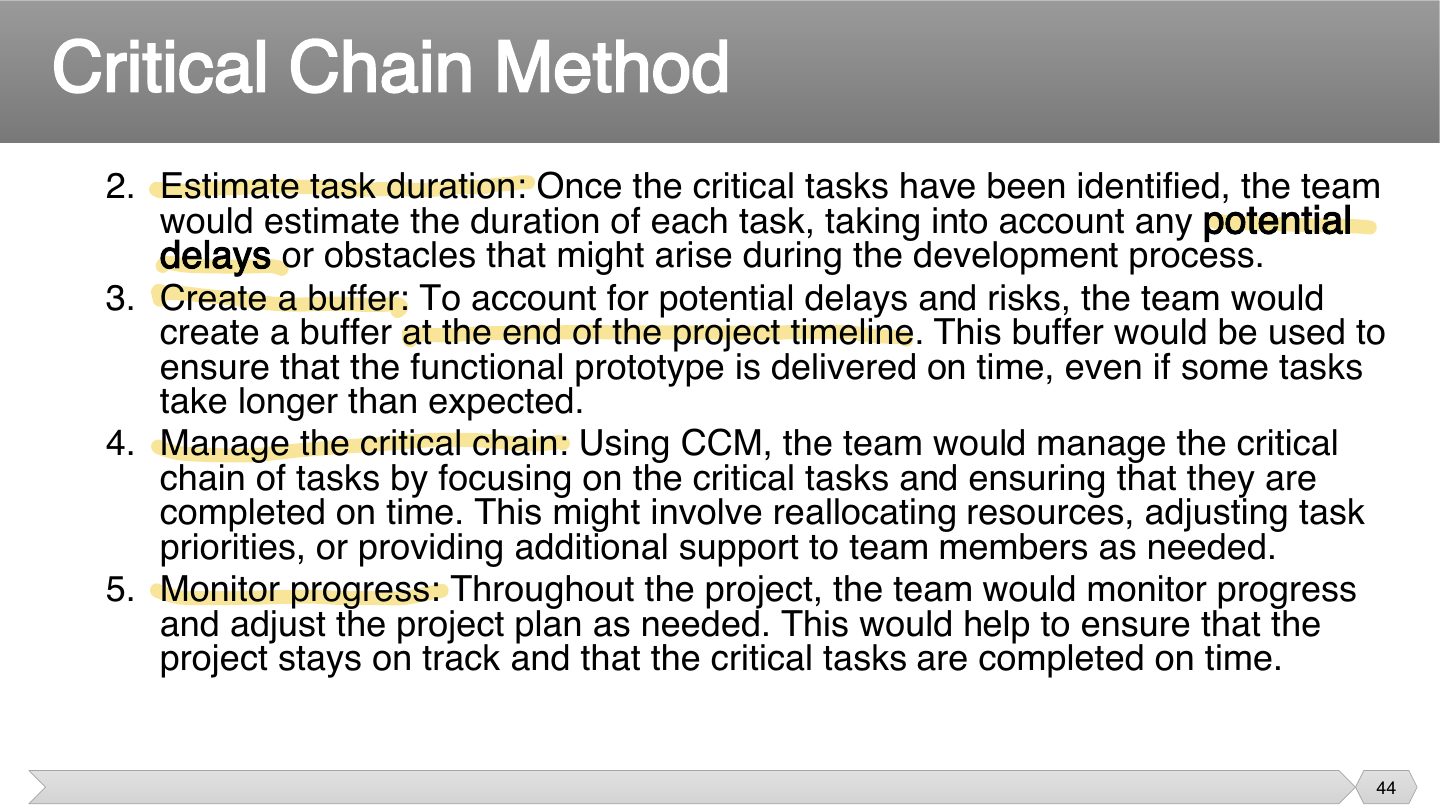
Rather than padding each task, it collects spare time in one buffer at the end. People can’t quietly use it up on each task, so everyone can see how much protection is left.
Exam angle
Where does CCM put its project buffer?
- That’s what CCM avoids.
- It protects the finish date.
- That isn’t where.
- CCM uses buffers.
Critical Chain Method
Notes
Think of a project buffer as the protection at the end. A delay on the critical chain eats into it, and watching how fast it shrinks tells you how much trouble you’re in.
A resource buffer isn’t time but a warning: “your expert is needed in two weeks.” This helps stop a late person from delaying critical work.
Tips & tricks
- PReF: Project buffer, Resource buffer, Feeder buffer.
Exam angle
A buffer placed where a non-critical chain joins the critical chain is a:
Critical Chain Method
Exam angle
How does CCM avoid resource conflicts?
- It uses buffers.
- That’s CPM.
- It avoids that.
- That’s on the slide.
What-if analysis
Notes
You don’t know what will go wrong, but you can test what happens if it does. What-if shows which delays matter and which don’t, so you know where to prepare.
Exam angle
What does what-if analysis test?
- That’s not it.
- For example, a late component.
- That’s not it.
- That’s not it.
Resource leveling
Notes
A schedule may need one person to do three tasks at once, which can’t happen. Leveling fixes that by shifting work, and shifting a task can even change which path is critical.
Exam angle
What can happen when resource leveling is applied?
- That’s on the slide.
- That’s not stated.
- They still do.
- That’s not it.
Resource leveling
Notes
Each is a different way of removing a clash. If two tasks want one person, you can delay one, split it, or move the person from a non-critical task, as those have time to spare.
Exam angle
Which is a resource-leveling approach?
- It’s on the slide.
- That makes it worse.
- That’s not it.
- That’s the problem.
Applying leads and lags
Notes
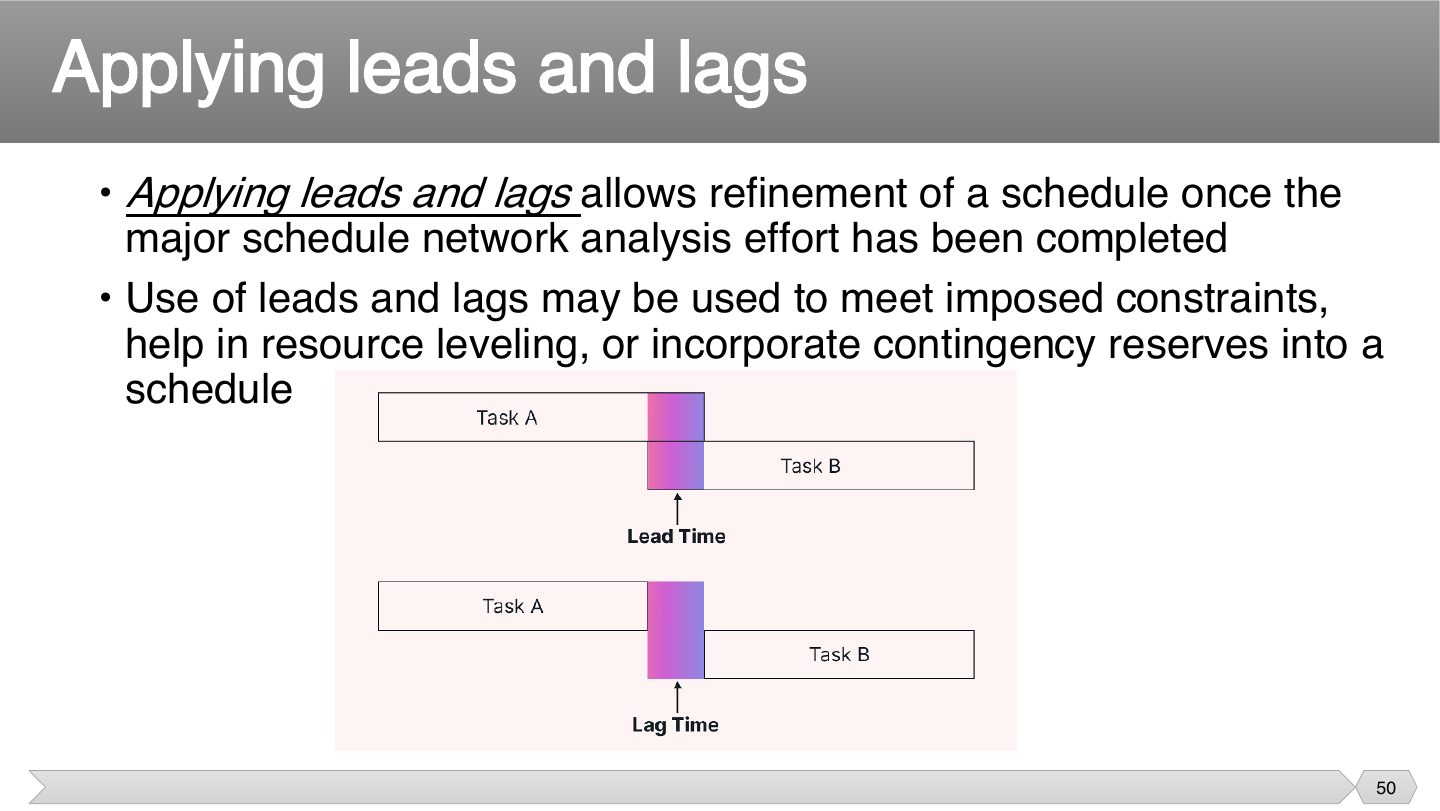
Lead = successor starts EARLY (overlap). Lag = forced WAIT between tasks.
Exam angle
Waiting 3 days for concrete to dry before the next task is a:
Calendars
Notes
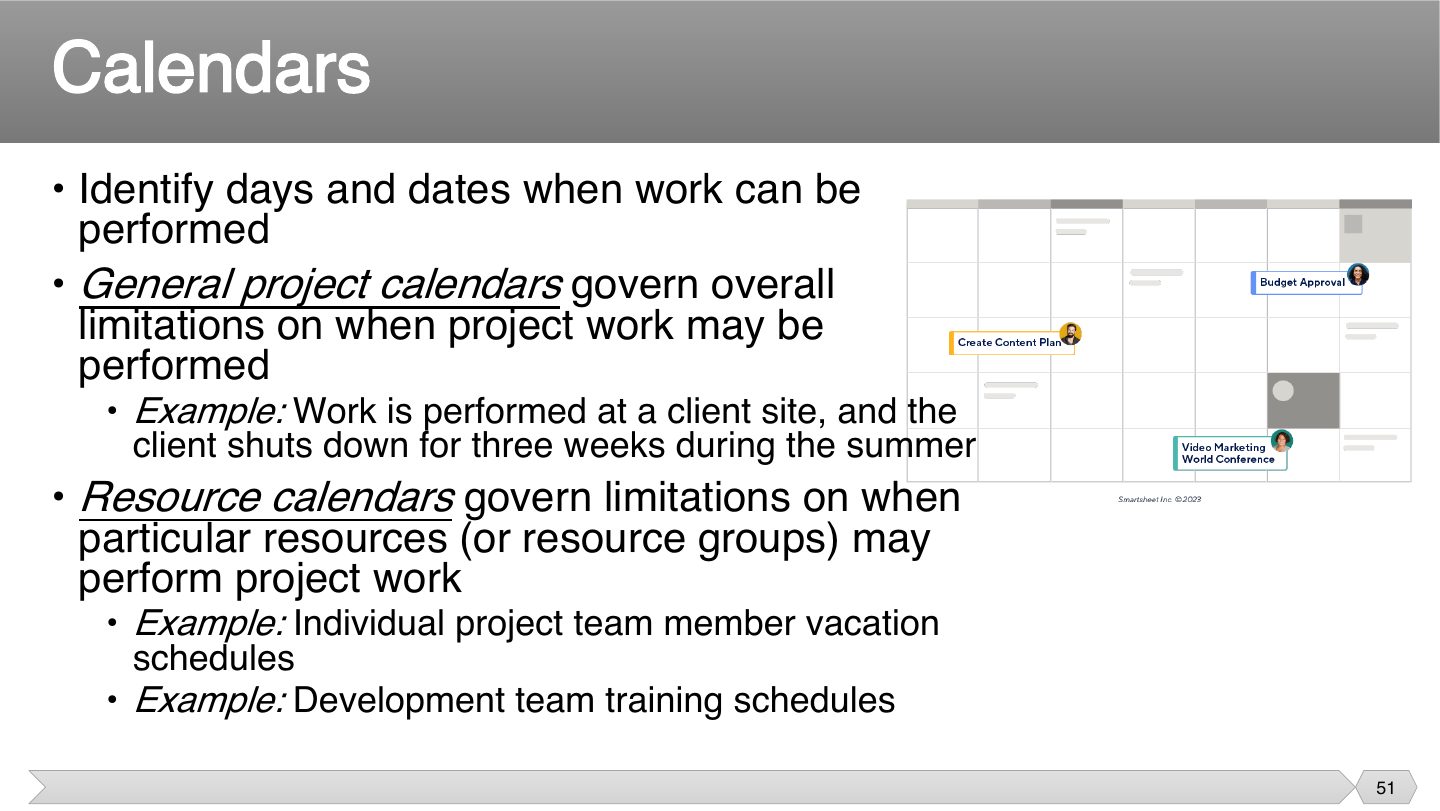
A plan assuming work every day will fail if the client’s site closes in summer. Calendars add these real limits, and they’re easy to forget until they stop the work.
Exam angle
A client’s site closes for three weeks in summer. Which calendar shows this?
- That tracks remaining work.
- It limits when project work can be done.
- That’s for particular people or groups.
- That isn’t a term here.
A developer’s training week belongs on which calendar?
- That’s not a calendar.
- That’s not it.
- That’s for overall limits.
- It’s specific to a person.
Schedule development output
Notes
Different people need different views. A network diagram shows the logic, a Gantt chart shows dates, and a milestone chart gives executives only the key points.
Instructor Circled: network diagrams, Gantt charts, milestone charts.
Exam angle
Which is a schedule development output?
- It’s on the slide.
- That’s not it.
- That’s not it.
- That’s not it.
Reducing Project Duration
Notes
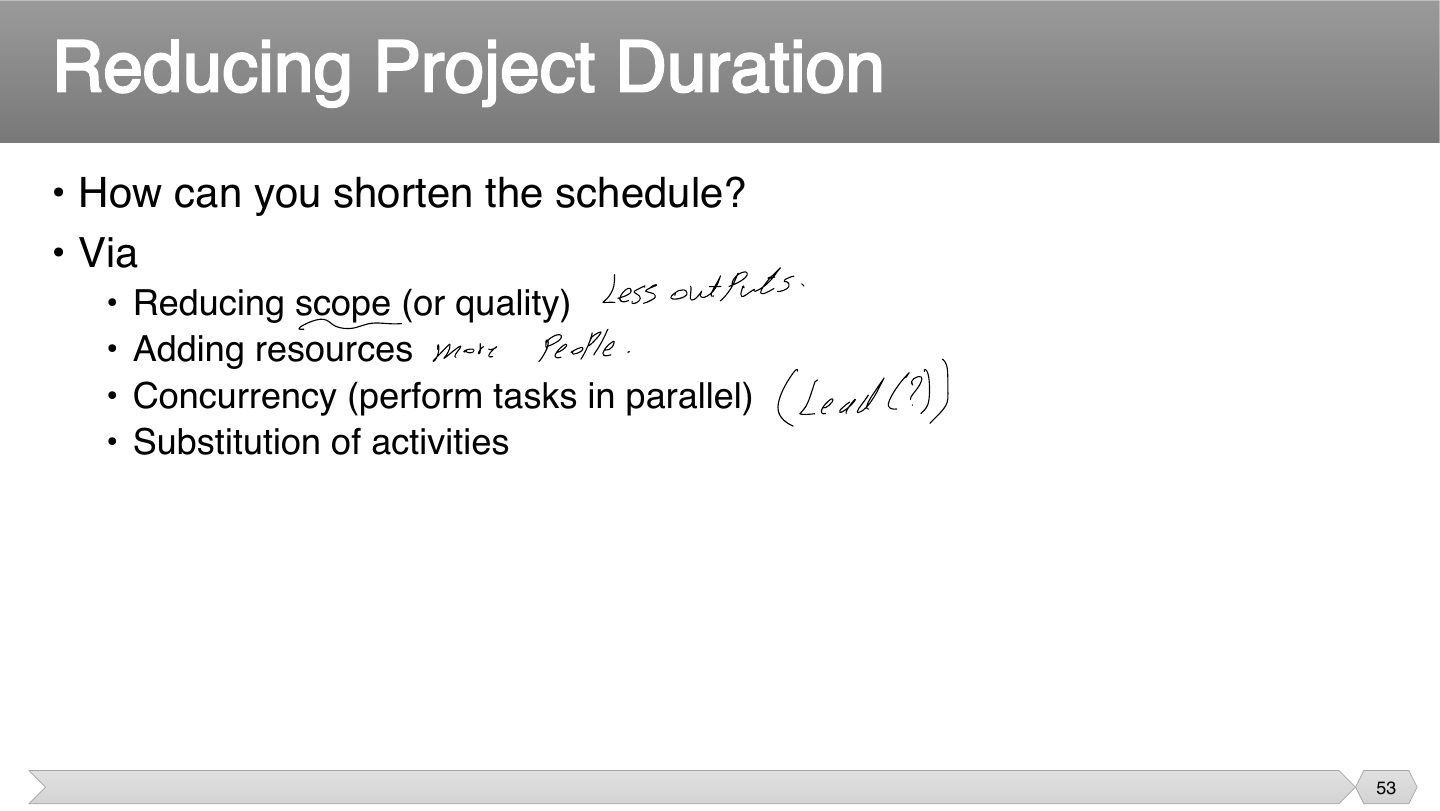
Think of the four levers: do less, add people, do things at once, or do something else instead. Each has a cost, so the question is which one fits. Reducing scope is often the cheapest.
Instructor Next to the items: “less outputs”, “more people”, “lead”.
Tips & tricks
- CARS: Concurrency, Adding resources, Reducing scope, Substitution of activities.
Exam angle
Which is NOT a way to reduce duration on the slide?
- This is listed.
- This is listed.
- This is listed.
- That would lengthen it.
Schedule compression
Notes
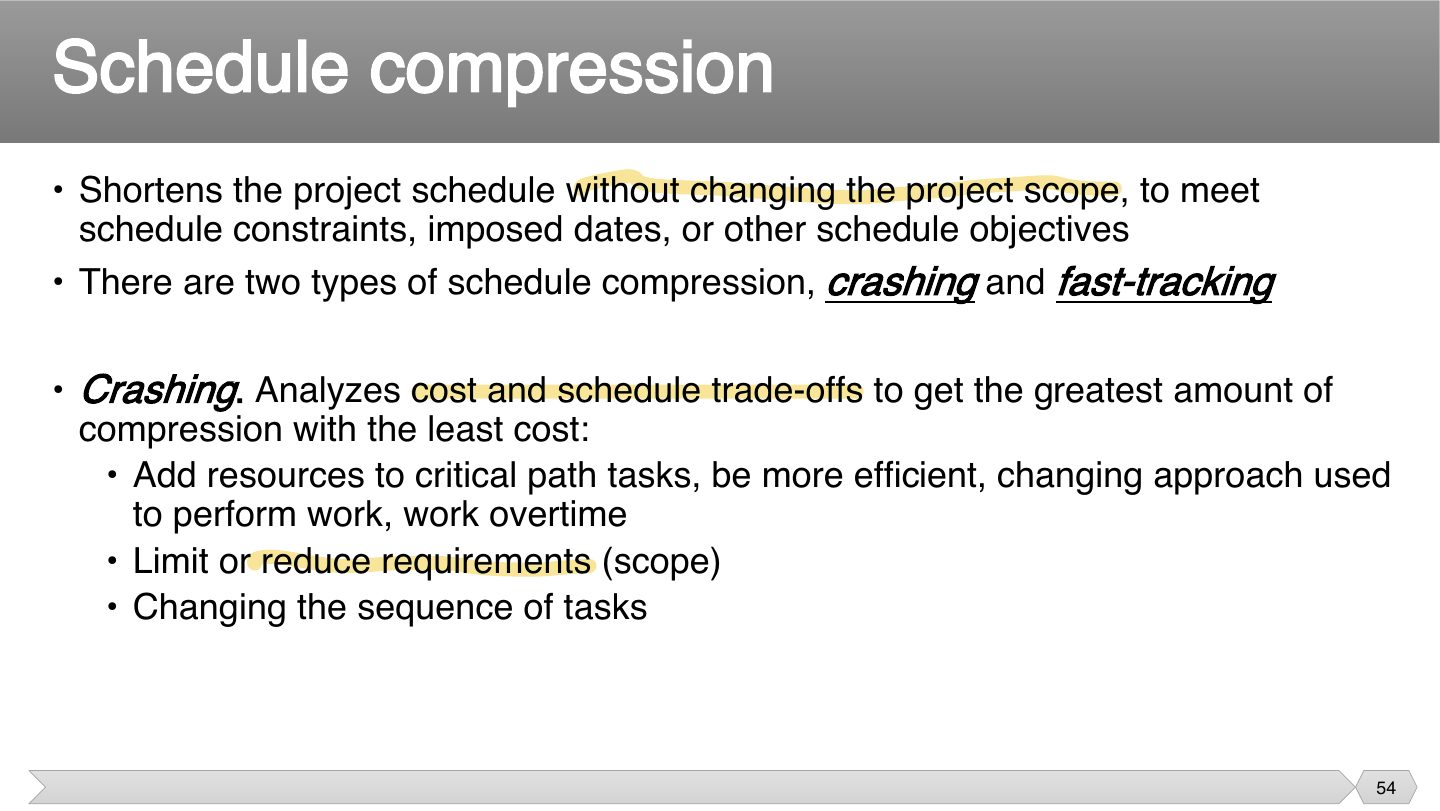
More people on critical tasks shortens the time, but it costs more. Only critical tasks are worth crashing, since speeding up others doesn’t move the end date. That’s why you analyze the trade-offs.
Exam angle
Q6.1 · how crashing and fast-tracking affect cost and risk
How can crashing and fast-tracking affect overall project cost and risk?
Compare with the model answer
Both shorten the schedule without changing scope. Crashing adds resources (overtime, extra staff) to critical-path activities, which raises cost directly, gives diminishing returns, and new people can add communication overhead and quality risk (Brooks’s Law). Fast-tracking runs sequential activities in parallel; cost rises less, but risk rises because work starts on assumptions, causing rework when earlier results change. Neither can compress much more than ~25% (Boehm).
Schedule compression
Notes
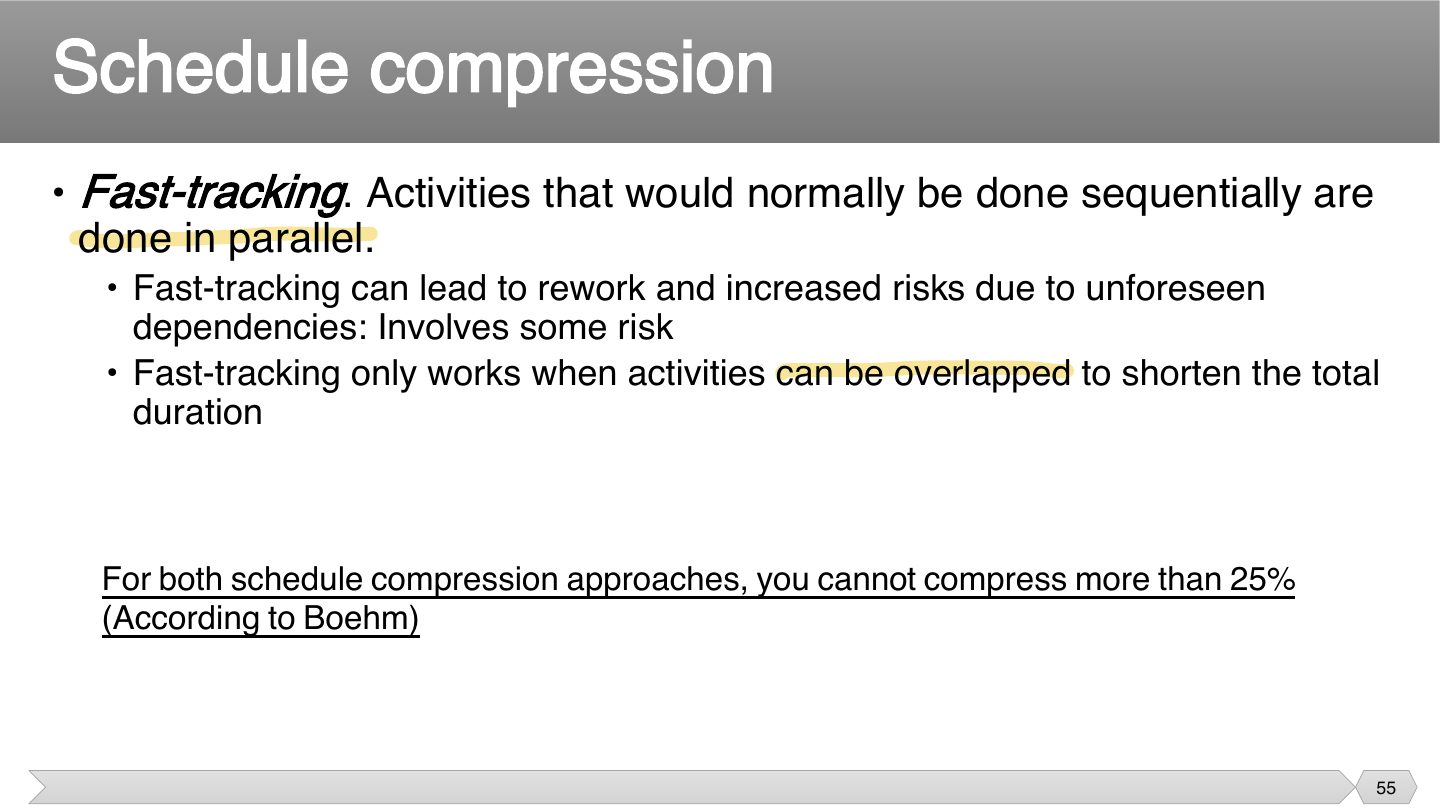
Overlapping tasks saves time without adding people. But the second task may start on unfinished work, so you might have to redo it, and that’s the risk you’re accepting.
Compression has limits. Even with money or overlap, past about 25% you’ll mostly get chaos, as the work needs a minimum amount of time.
Memory trick Crashing costs MONEY. Fast-tracking costs RISK.
Exam angle
Q6.1 · crashing and fast-tracking effects
Starting coding before design is fully finished is:
Mythical Man-Month
Notes
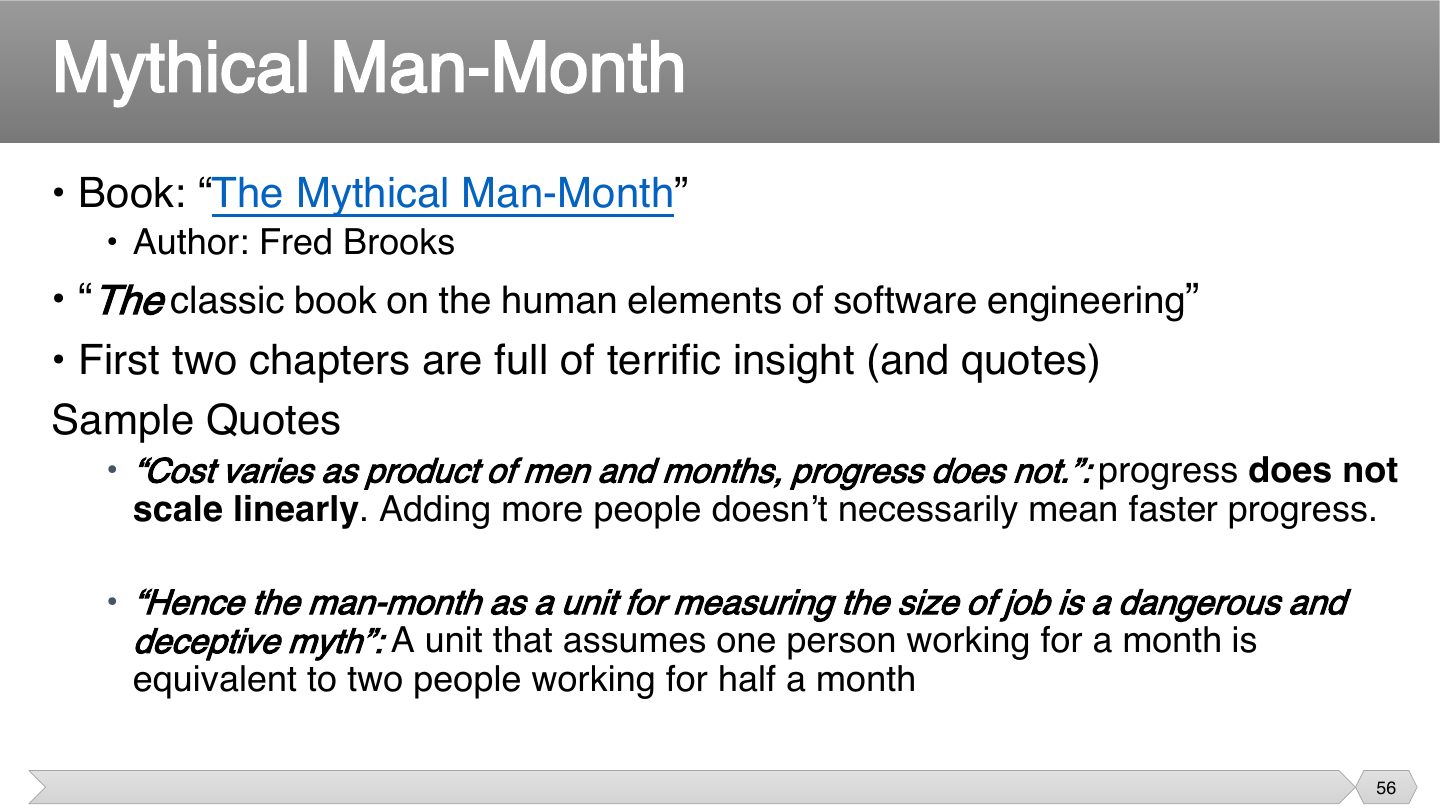
Six people for a month isn’t the same as one person for six months, because they spend time talking to each other. That’s why the man-month is called a myth: it counts effort, not progress.
Exam angle
What does Brooks mean by “Cost varies as product of men and months, progress does not”?
- That’s what he disputes.
- That isn’t the point.
- That isn’t the point.
- Effort isn’t the same as progress.
Mythical Man-Month
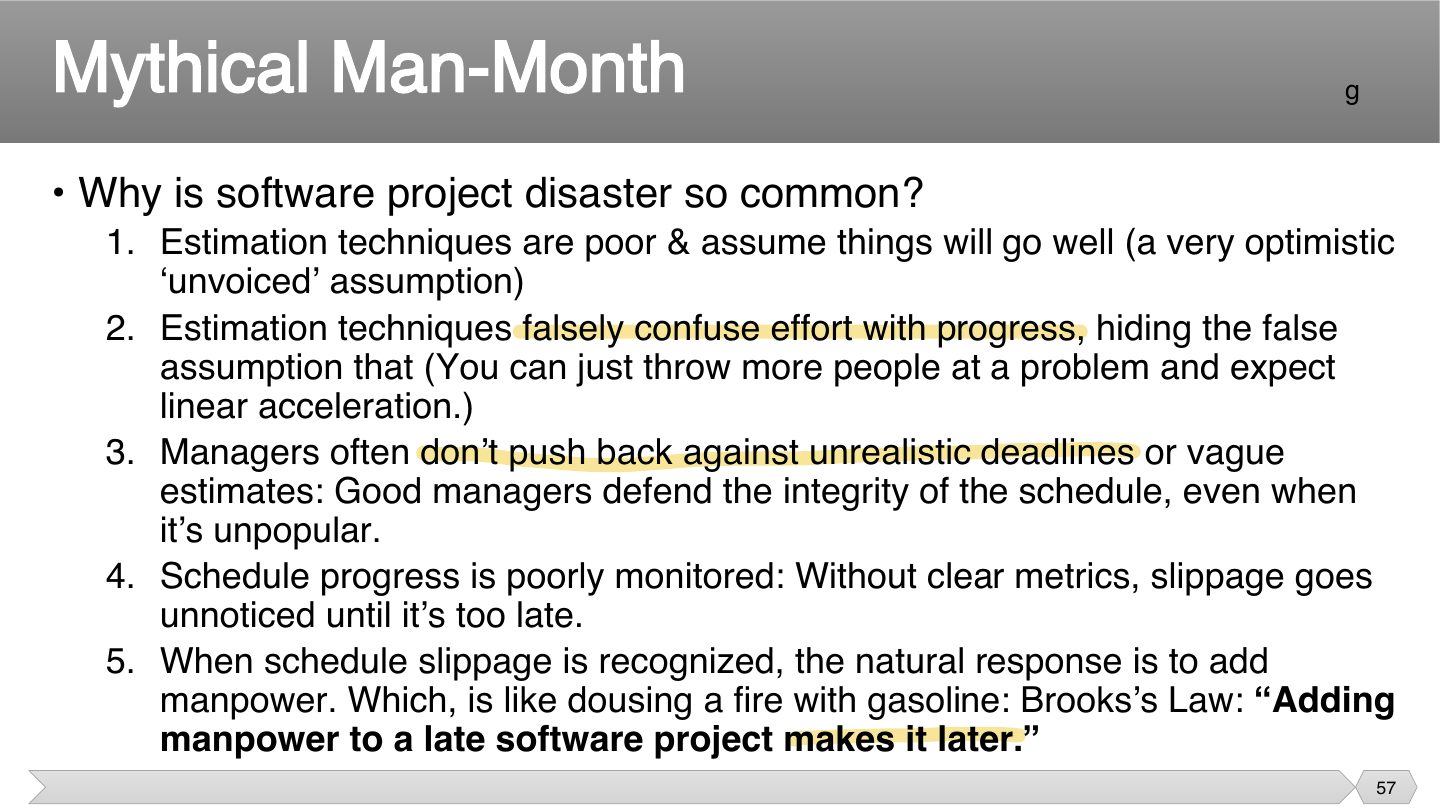
Notes
New people need training from those already busy, and every addition means more communication. So in the short term, adding people to a late project slows it further. That’s Brooks’s Law.
Exam angle
Adding more developers to a late software project will usually make it finish sooner.
- Brooks’s Law: it makes it later.
Mythical Man-Month
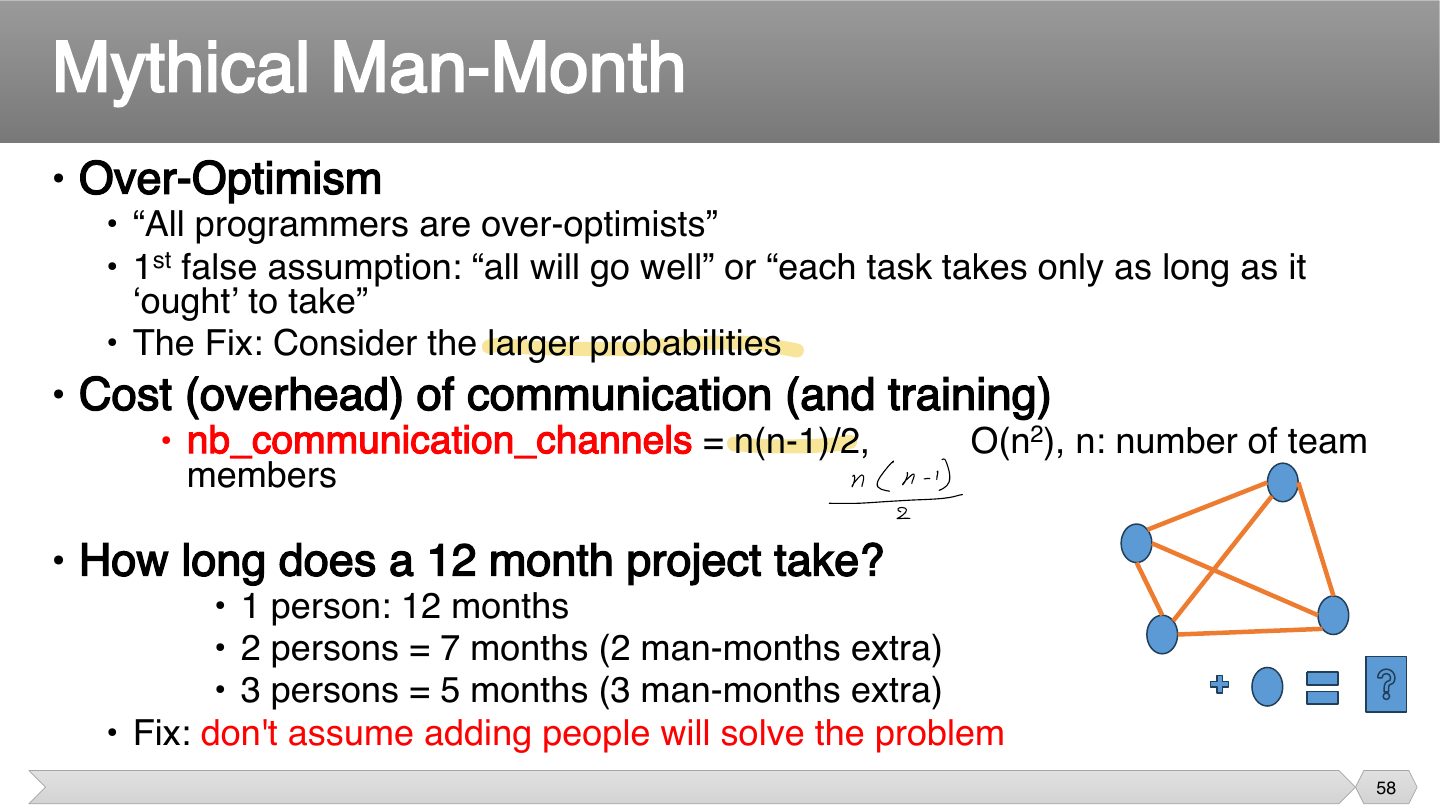
Notes
Each new person adds a link to everyone else, so communication grows much faster than the team. Going from 7 to 14 people takes you from 21 to 91 channels.
Twice the people doesn’t give half the time, since coordination has to fit in somewhere. That’s why the job takes 7 months rather than 6.
Seen again Ch 3, slide 34: Large teams and communication paths
Exam angle
Q3.2 · communication channels for 7 members
Communication channels for 10 team members?
- 10×9/2 = 45.
Mythical Man-Month
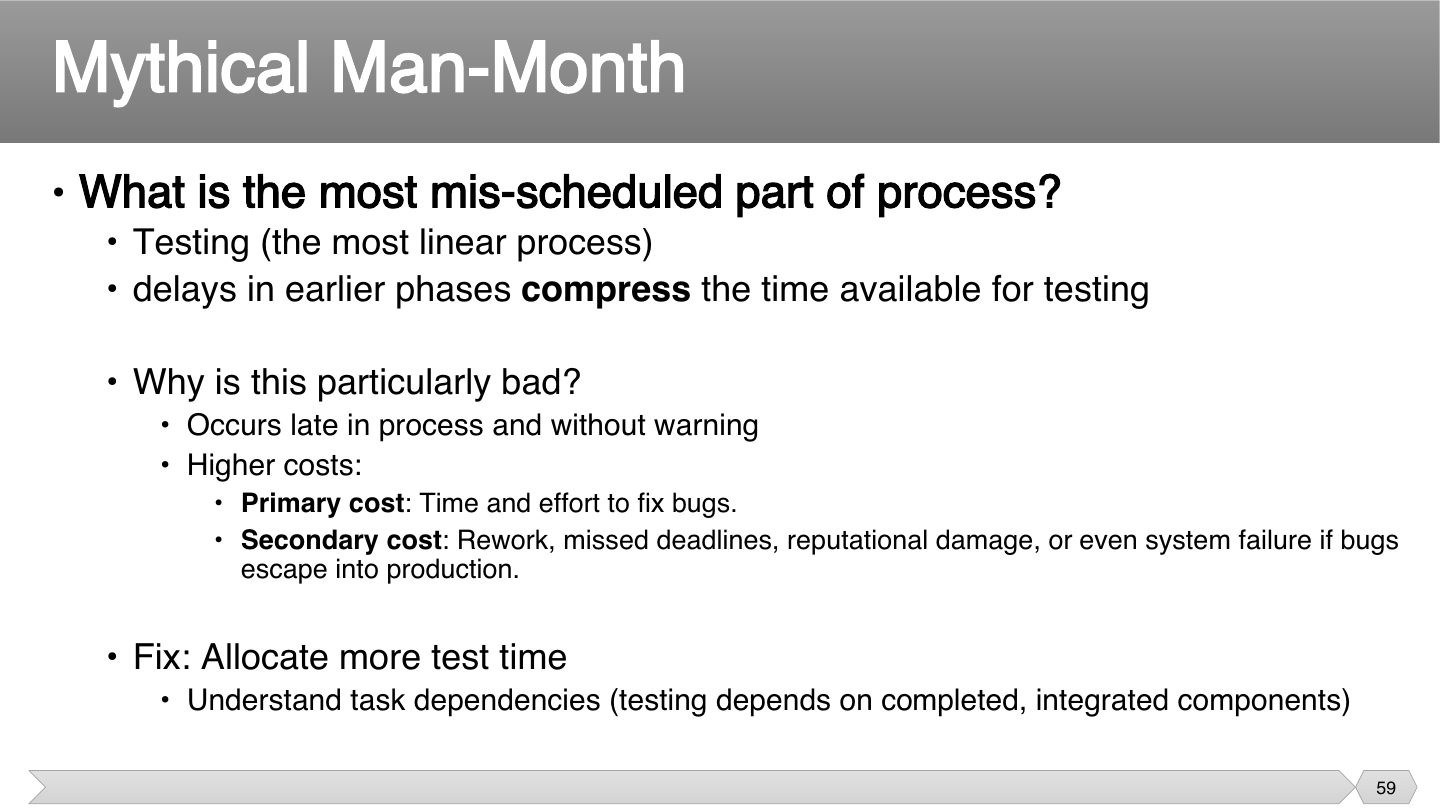
Notes
Testing comes last, so every earlier delay takes time from it. It’s also where the surprises come out, at the worst possible moment. So planning more test time is the fix.
Exam angle
Why is testing so often mis-scheduled?
- It’s done late.
- It takes plenty.
- It comes last.
- Everyone does.
Mythical Man-Month
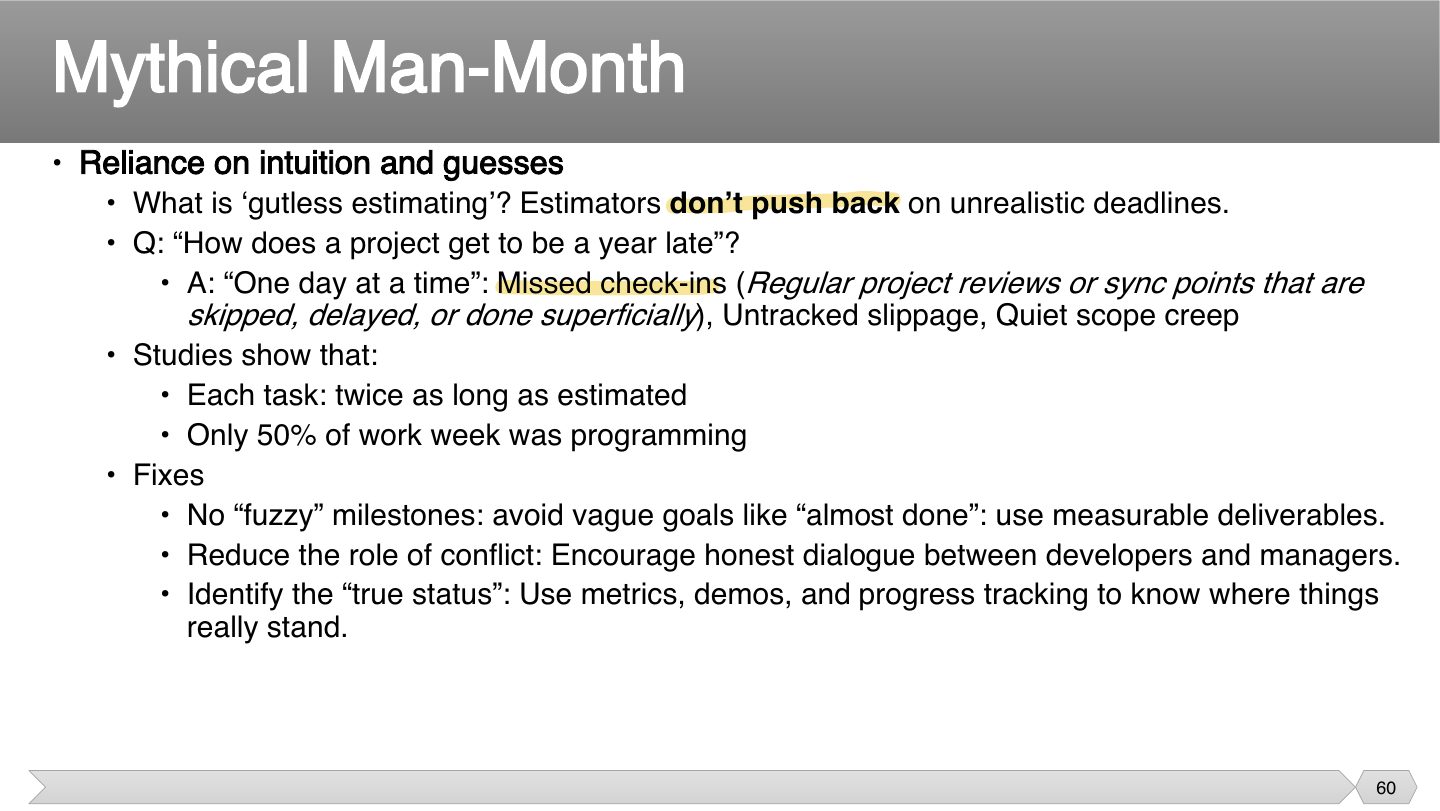
Notes
Nobody notices one lost day, so nobody acts, and those days add up. So clear, checkable milestones matter, as does telling the truth about status, rather than saying what people want to hear.
Exam angle
“How does a project get to be a year late?”
- That’s not the answer.
- Small slips go unnoticed.
- That’s not the answer.
- That’s not the answer.
What is “gutless estimating”?
- That’s different.
- That’s the slide’s definition.
- It’s about not pushing back.
- That’s different.
Quick Summary of the Scheduling Workflow
Scheduling Workflow
Notes
Why does sequencing come before resources? First work out what’s logically possible, then see who can do it. Otherwise, you may mistake a staffing limit for a real dependency.
Exam angle
Why sequence before allocating resources?
- It’s a key step.
- You still estimate.
- They do, later.
- Resources come later.
Scheduling Workflow
Notes
Now you can test the schedule. Calculate the critical path first, then try scenarios, then fix overloads. Compression comes last, because you only compress what you need to.
Exam angle
Q2.1 · three scheduling techniques
Q2.3 · scheduling techniques and staying on track
Identify three scheduling techniques you would use for a 12-month project and how each helps with delays or overlapping activities (Final 242).
Compare with the model answer
(1) WBS plus network diagram with the Critical Path Method: forward/backward pass shows ES/EF/LS/LF and slack, so you know which activities would delay the end date and which have room. (2) Gantt chart: shows overlapping activities, milestones and planned vs actual progress, making slippage visible to everyone. (3) PERT three-point estimates for uncertain tasks (and/or critical chain buffers): gives expected durations and variance, and buffers protect the end date. Resource leveling and fast-tracking/crashing manage overlaps and recover delays.
WBS template
Notes
A “+” group is rolled up to hide detail.
Exam angle
What does a “+” in front of a WBS group mean?
- That’s not what it means.
- It’s only hidden.
- That’s not what it means.
- That reduces clutter.
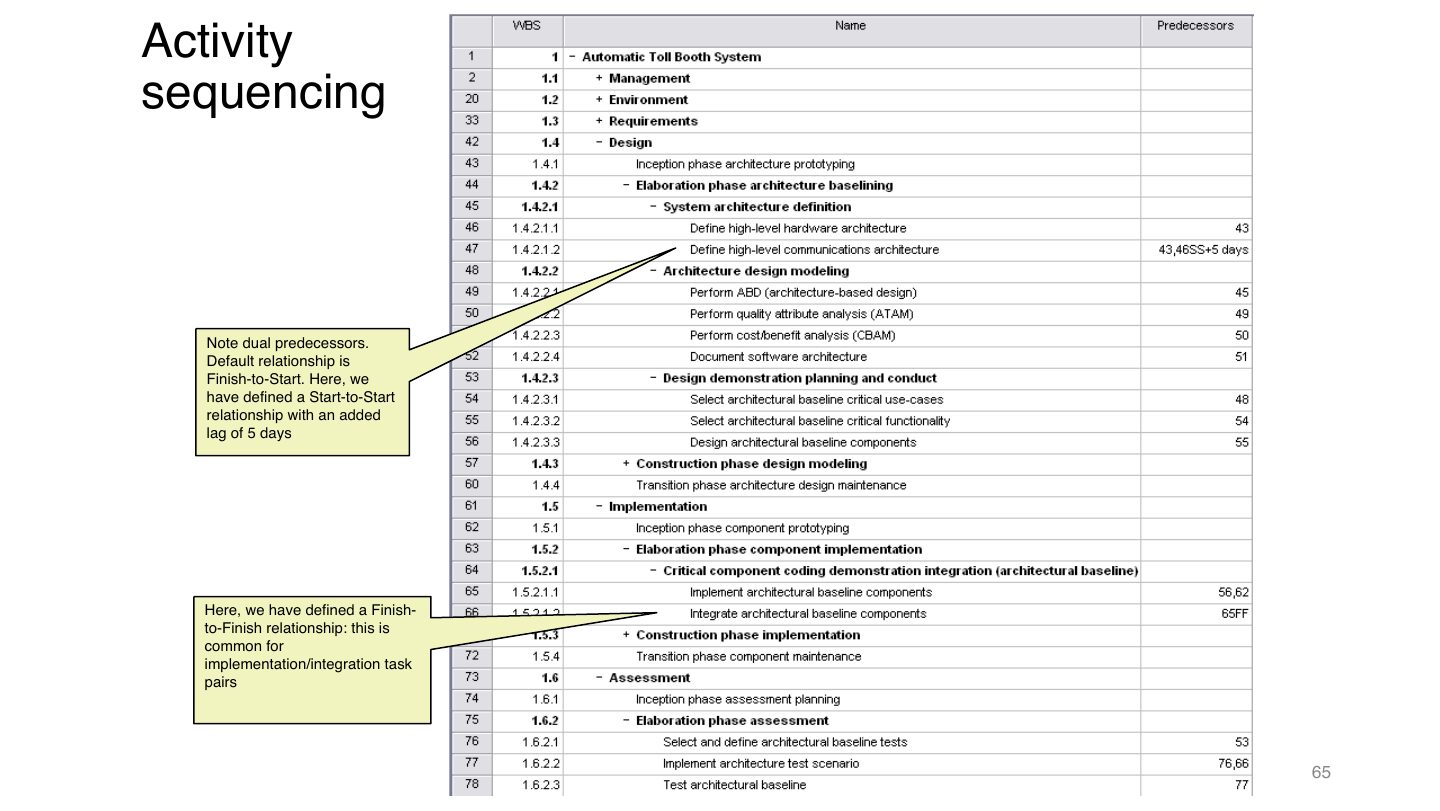
Activity Sequencing
Notes
Most tasks simply wait for the previous one to finish. Other links let tasks overlap in a controlled way, such as coding and integration finishing together. That’s what Finish-to-Finish means.
Exam angle
What’s the default dependency?
- That’s defined specially.
- That isn’t the default.
- That’s defined specially.
- The slide says so.
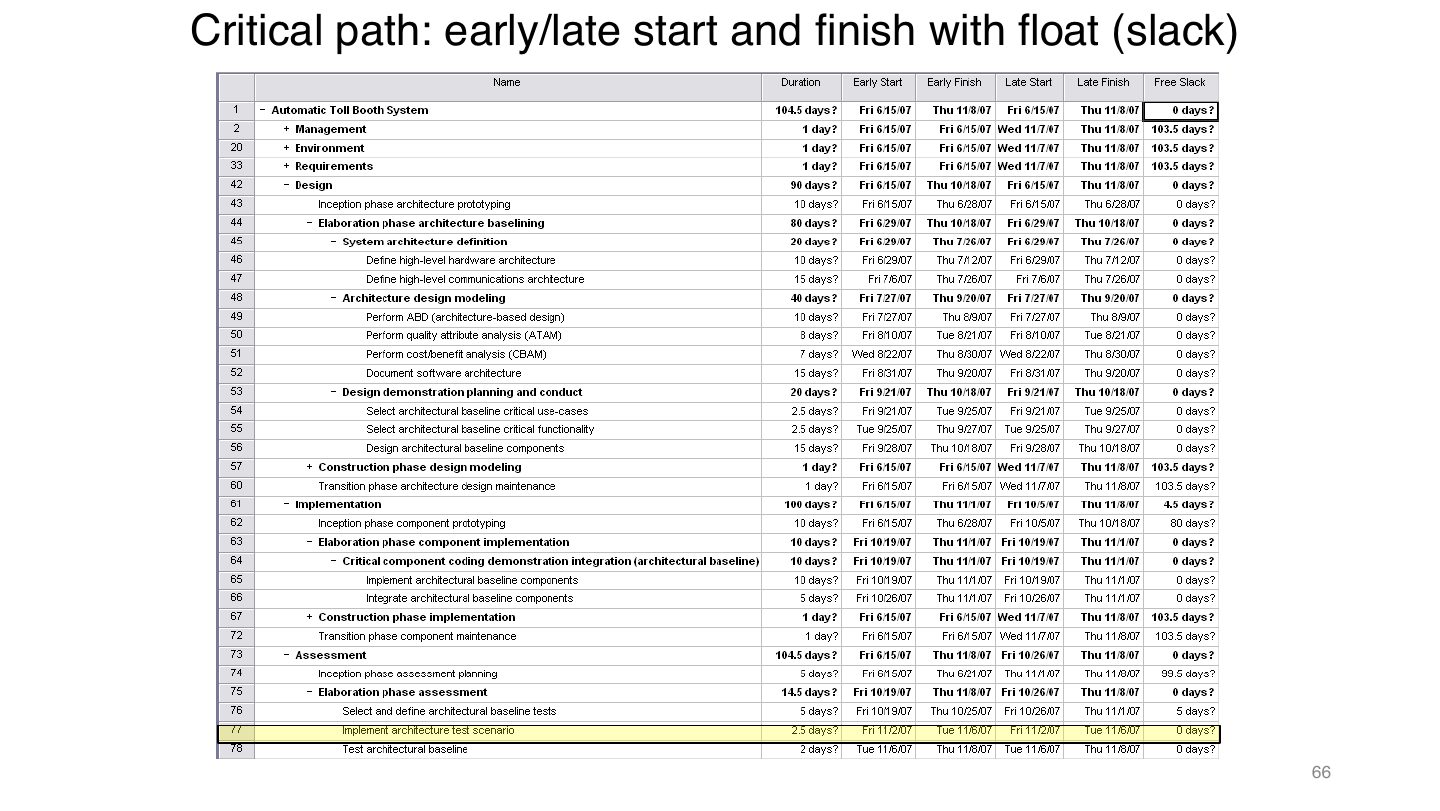
Critical Path: Early/Late Start and Finish with Float
Exam angle
In this view, which tasks have zero float?
- That’s the opposite.
- Not only that.
- Critical tasks do.
- Zero slack means critical.
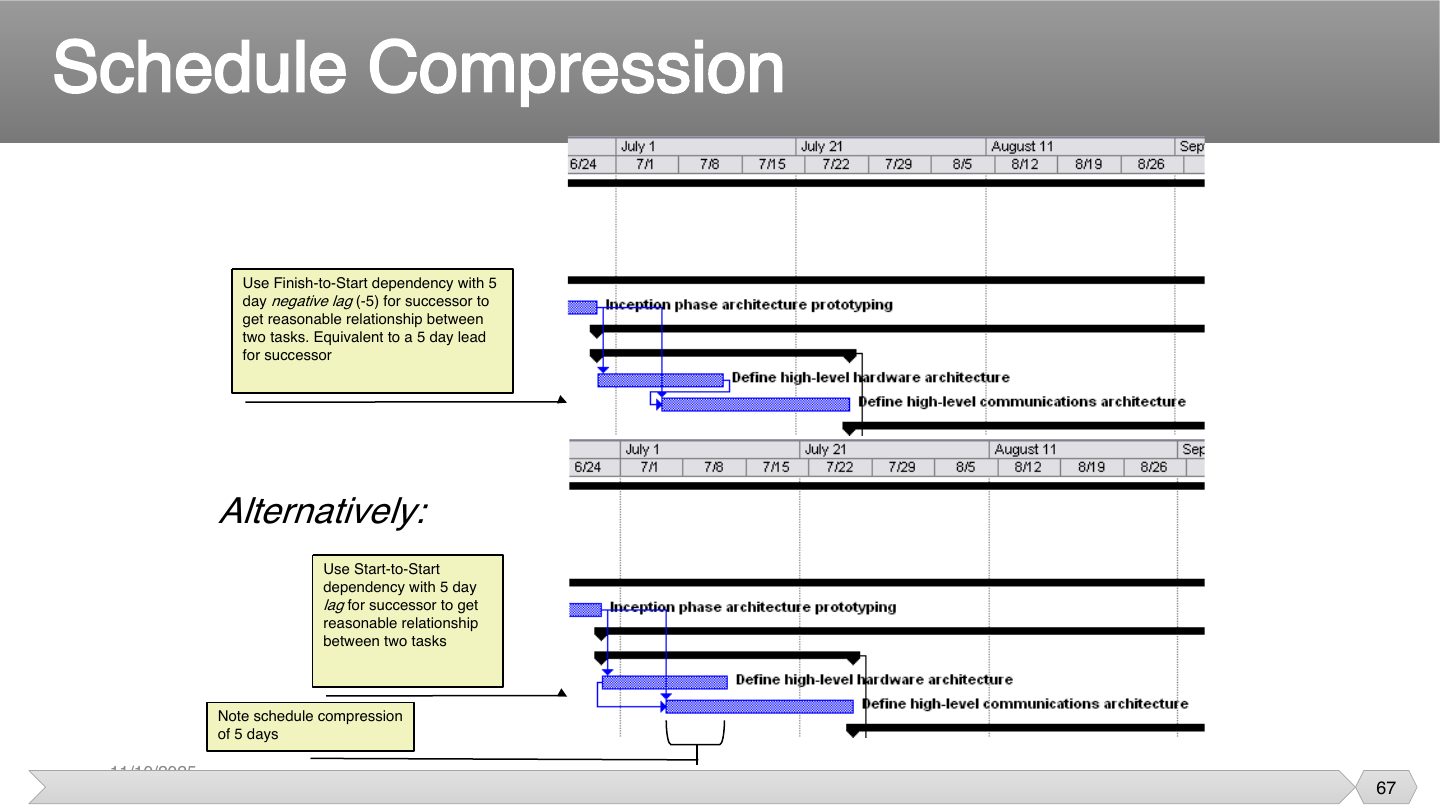
Schedule Compression
Notes
Starting a task 5 days before its predecessor ends is a lead. Tasks now overlap, which saves 5 days in total, and it’s the same as fast-tracking those two tasks.
Exam angle
What does a Finish-to-Start with a −5 day lag equal?
- It saves 5 days.
- That’s not it.
- They overlap by 5 days.
- That’s a positive lag.
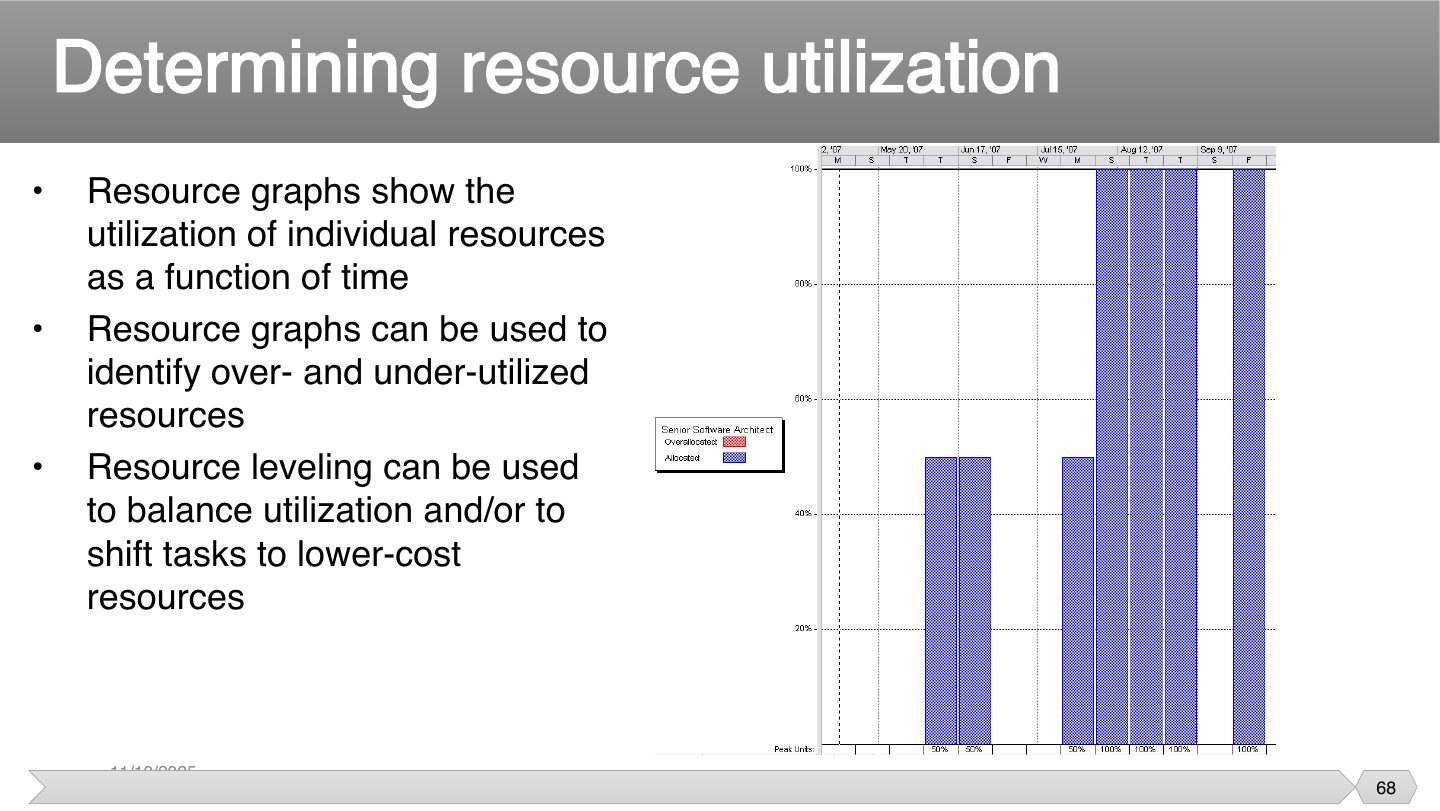
Determining resource utilization
Notes
Two tasks might each look fine, while the same person is booked for 16 hours that day. A resource graph shows this at once, as well as who has spare time.
Exam angle
What can a resource graph reveal?
- That’s not it.
- That’s not it.
- That’s not it.
- That’s on the slide.
Project Tracking
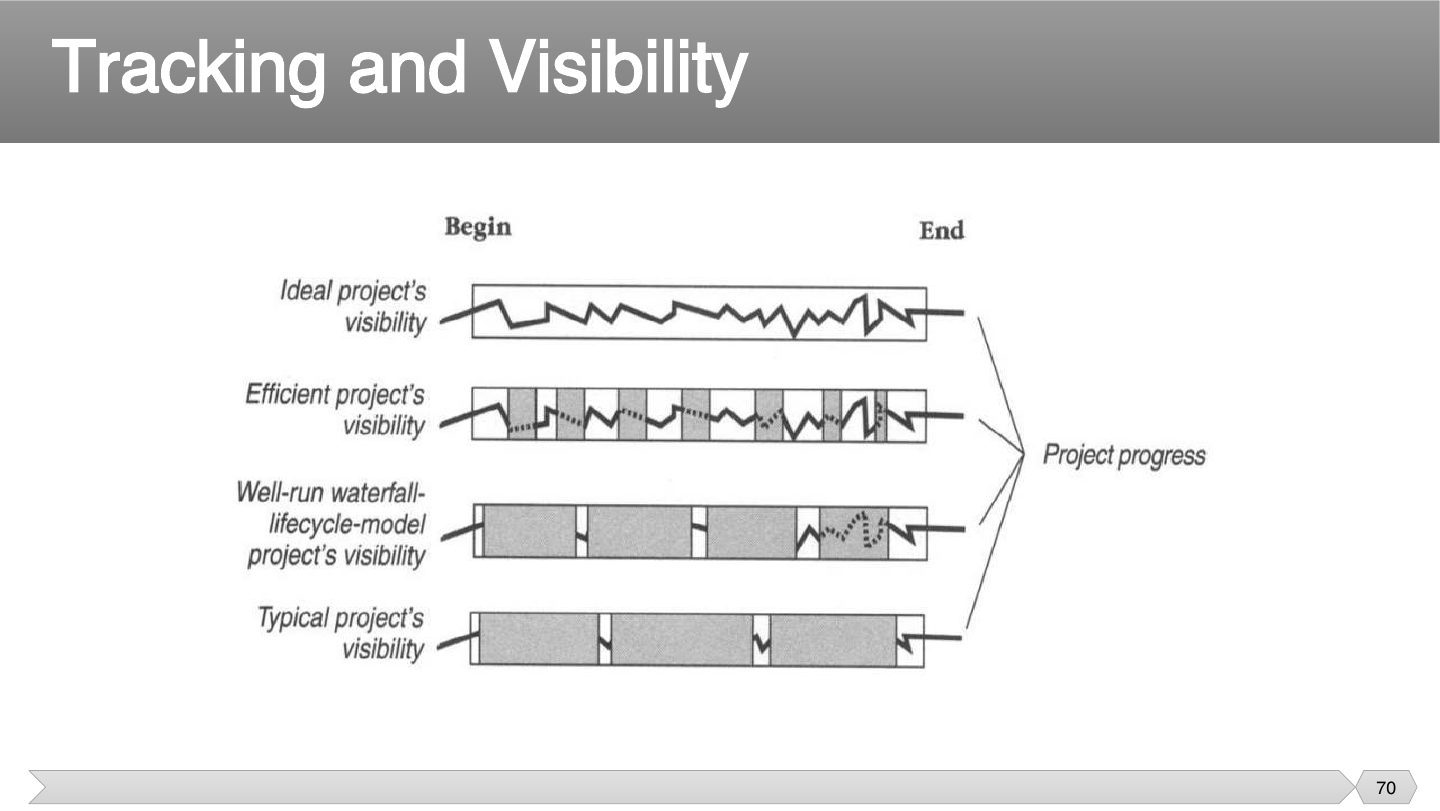
Tracking and Visibility
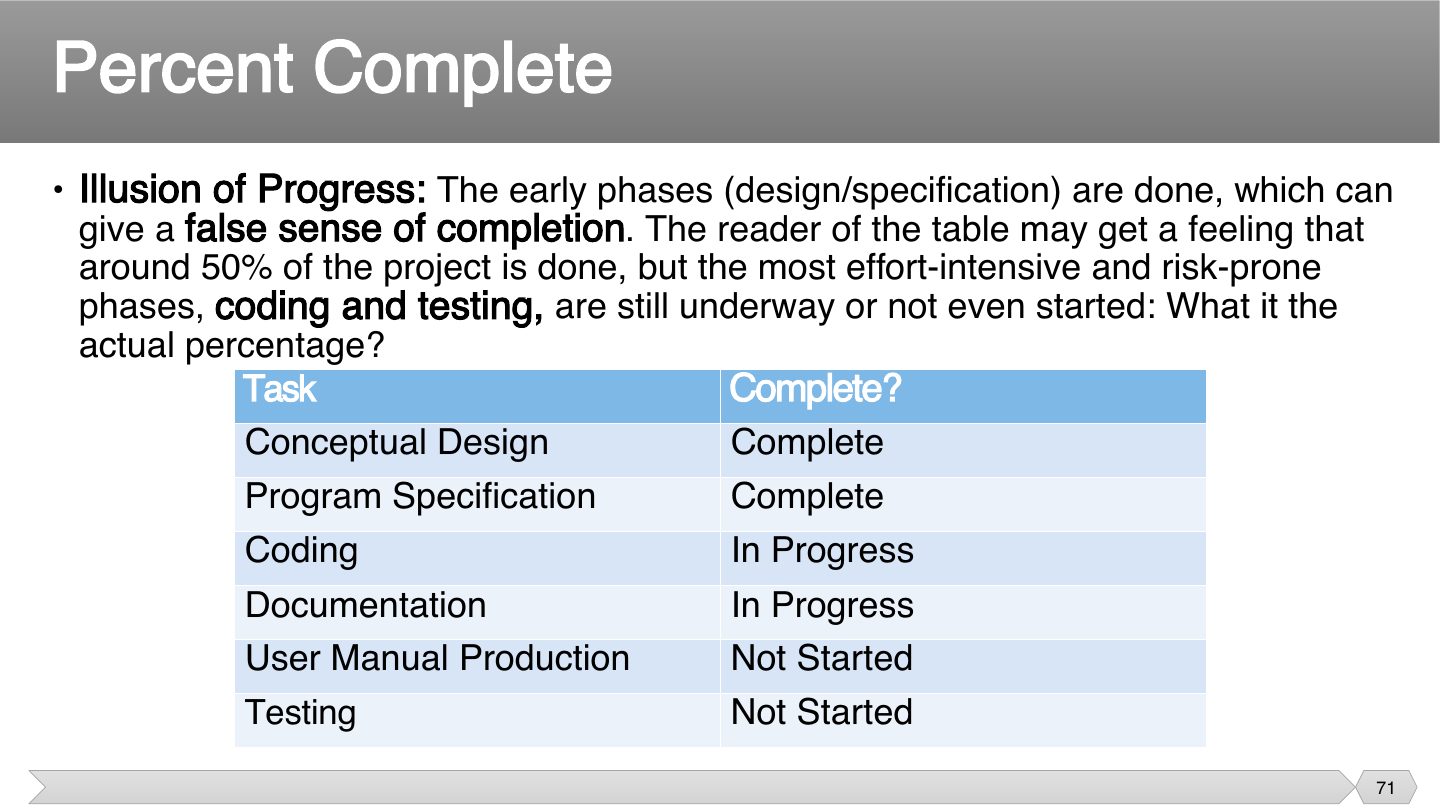
Percent Complete
Notes
Finishing the easy, early tasks makes a project look further along than it is, because the hard work is still ahead. Don’t count tasks, or you’ll get a false sense of progress.
Exam angle
Two of six tasks are complete, but they’re the small early ones. What’s the danger?
- It isn’t.
- It’s not.
- The slide warns of one.
- The heaviest work is still ahead.
Percent Complete
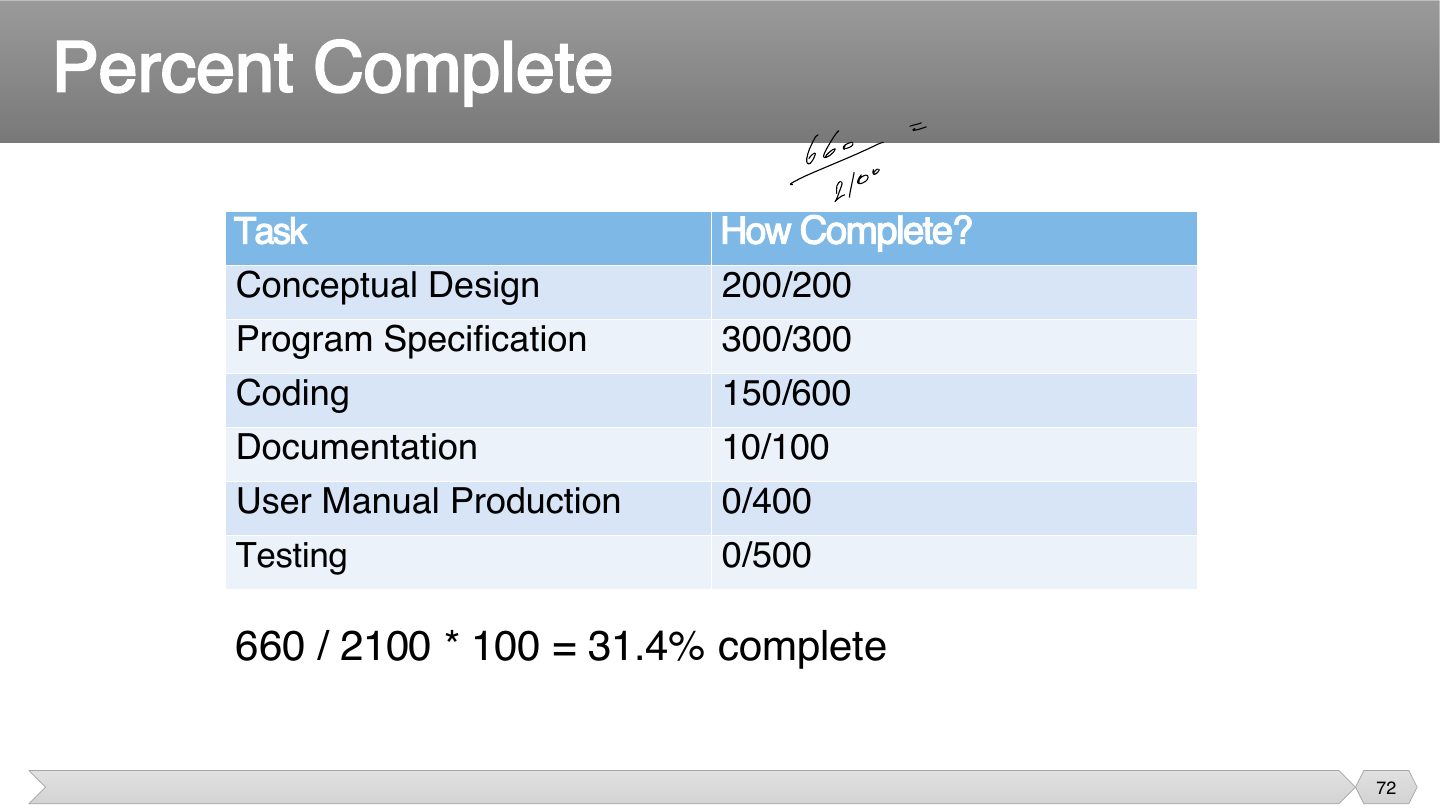
Notes
Effort-weighted: 660 of 2,100 hours = 31.4%, not ~50%.
Exam angle
Tasks: A 100/100, B 50/200, C 0/200. Percent complete?
- 150/500 = 30%.
Earned Value
Notes
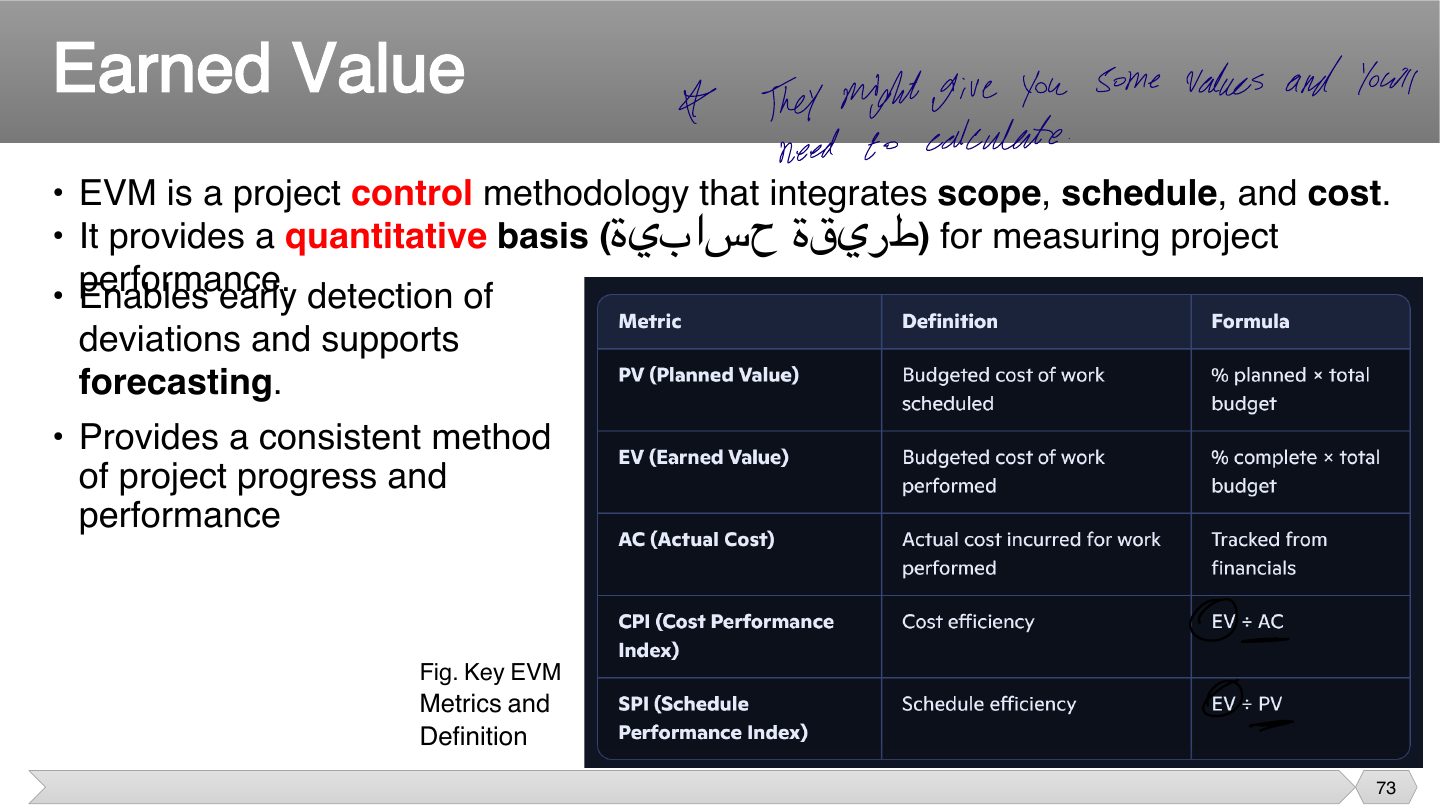
PV = planned budget of scheduled work. EV = budget of work actually done. AC = actual cost.
CPI = EV/AC, SPI = EV/PV. Below 1 = bad (over budget / behind).
Instructor “They might give you some values and you need to calculate.”
Memory trick EV is always on top: CPI = EV/AC, SPI = EV/PV, CV = EV−AC, SV = EV−PV.
Exam angle
EV = 80, AC = 100, PV = 90. CPI and SPI?
- CPI = 80/100, SPI = 80/90.
An SPI of 1.2 means the project is behind schedule.
- SPI > 1 means ahead of schedule.
Using Earned Value Tracking
Notes
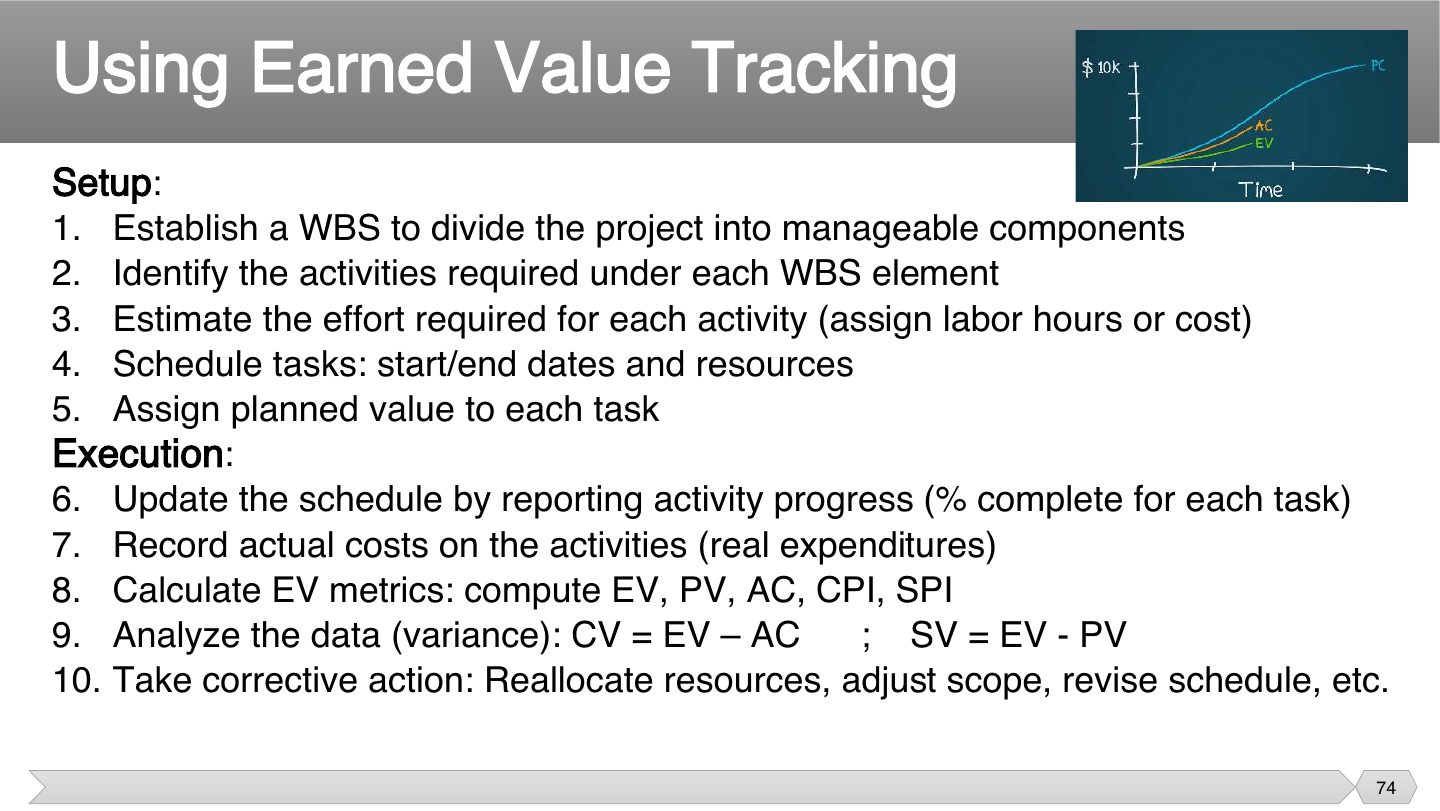
Setting up early gives you something to compare against. You can’t say you’re behind unless you defined the plan first, and that’s what the setup steps are for.
Exam angle
Which step happens during execution in earned value tracking?
- That’s setup.
- That’s setup.
- It’s step 7.
- That’s setup.
Earned Value Example
Notes
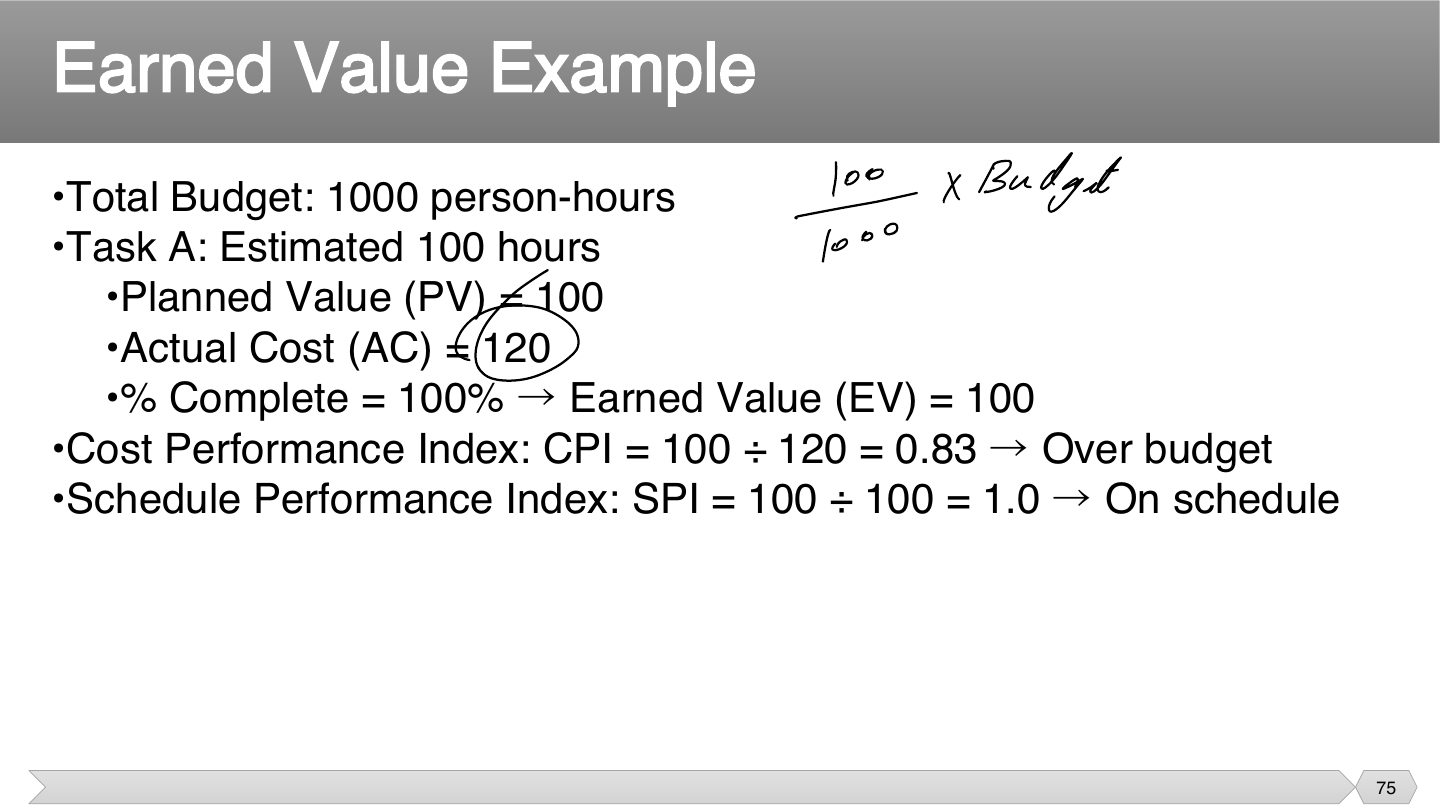
Work through the logic. The task is done, so you’ve earned all its value and you’re on schedule. But it cost 120 for 100 of value, so CPI is below 1: on time, but over budget.
Instructor Next to the budget: “100/1000 × budget”; AC 120 circled.
Exam angle
EV = 100, PV = 100, AC = 120. What’s the status?
- CPI is below 1.
- SPI = 1.0 and CPI = 0.83.
- SPI is 1.0.
- SPI is 1.0.
Earned Value Tracking
Notes
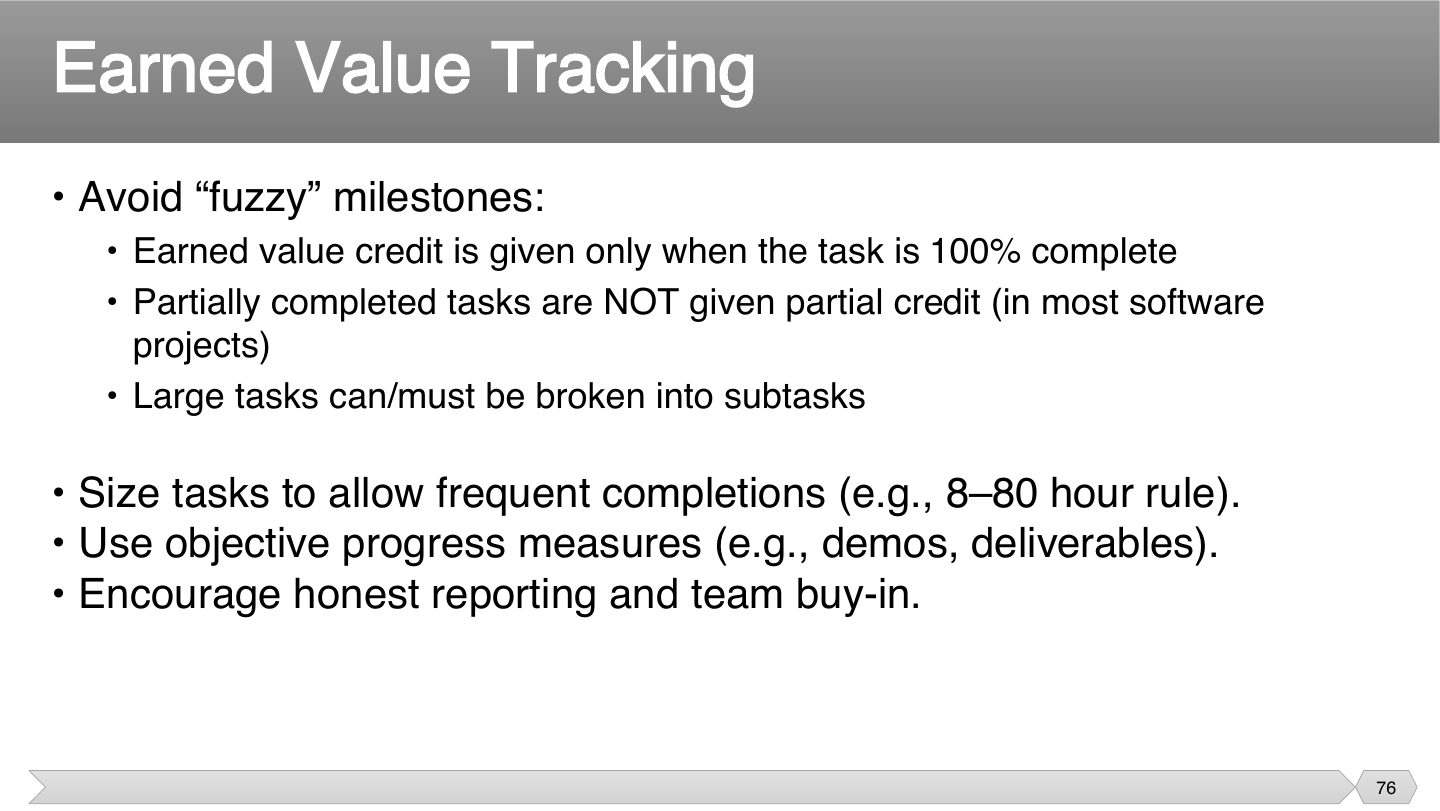
Giving credit only for finished work stops the “90% done for weeks” problem. It only works when tasks are small, and that’s why you break big ones down. Fuzzy milestones can’t be checked.
Exam angle
In strict earned value, when do you get credit for a task?
- That avoids fuzzy milestones.
- That’s what it prevents.
- That’s not the rule.
- That’s too early.
Project Velocity (PV)
Notes
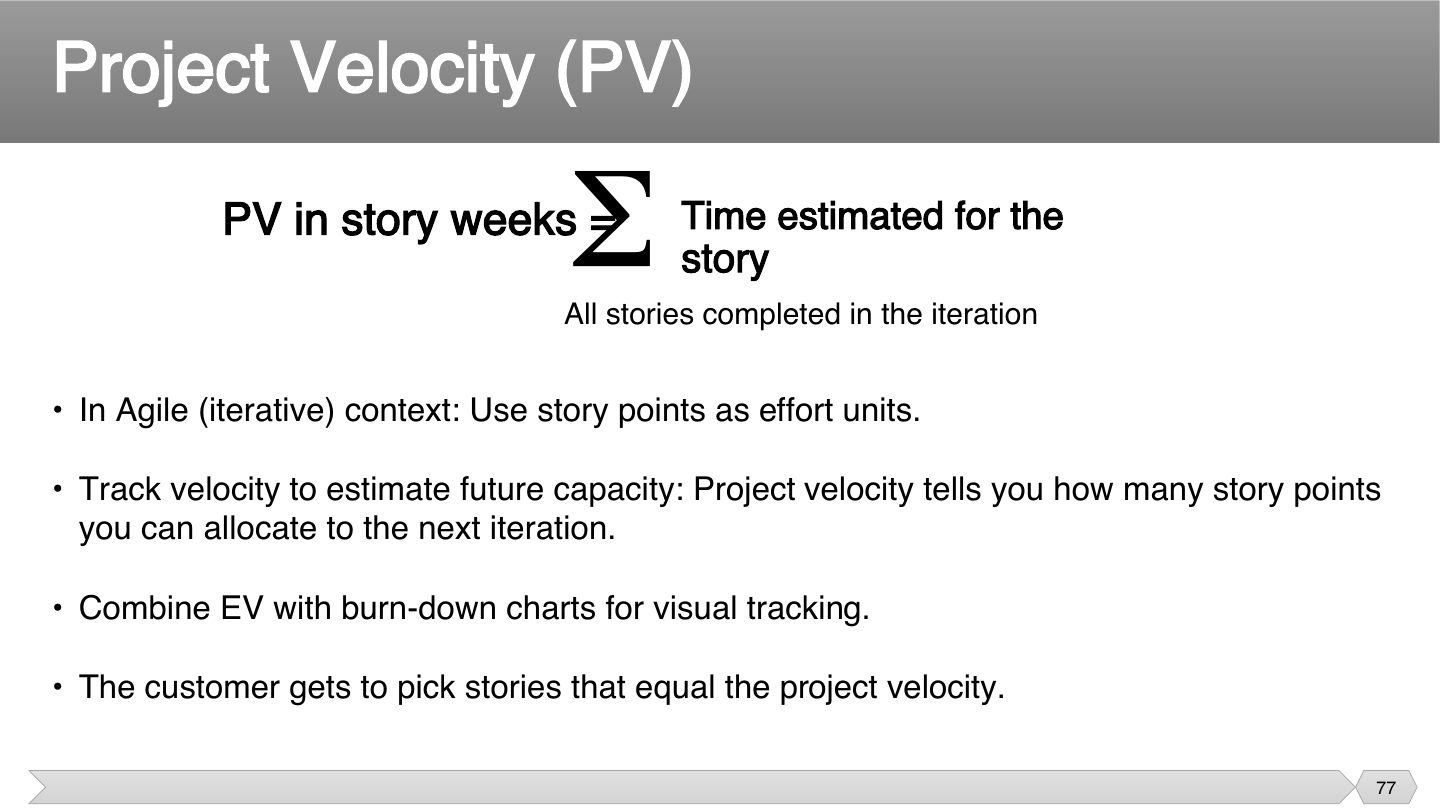
Rather than guessing, look at what the team actually finished. Velocity is real evidence of what they can take on, so planning the next sprint is less of a guess.
Seen again Ch 4, slide 59: Velocity in Scrum
Exam angle
What does velocity help with?
- That’s not it.
- That’s not it.
- It supports planning.
- It’s based on past completions.
Project Velocity (PV)
Exam angle
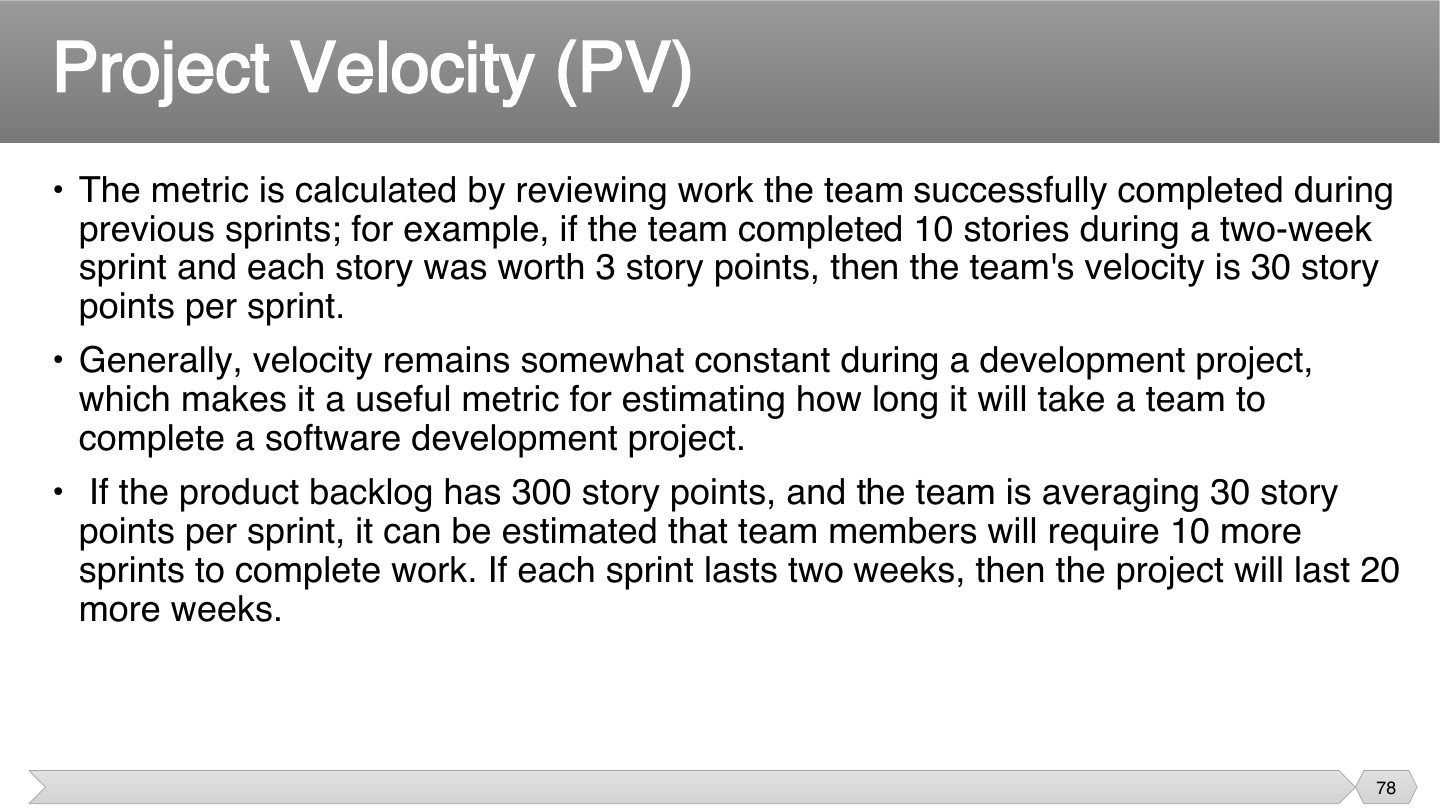
Backlog = 240 points, velocity = 30/sprint, 2-week sprints. Weeks left?
- 240/30 = 8 sprints × 2 = 16 weeks.
Burn down chart
Notes
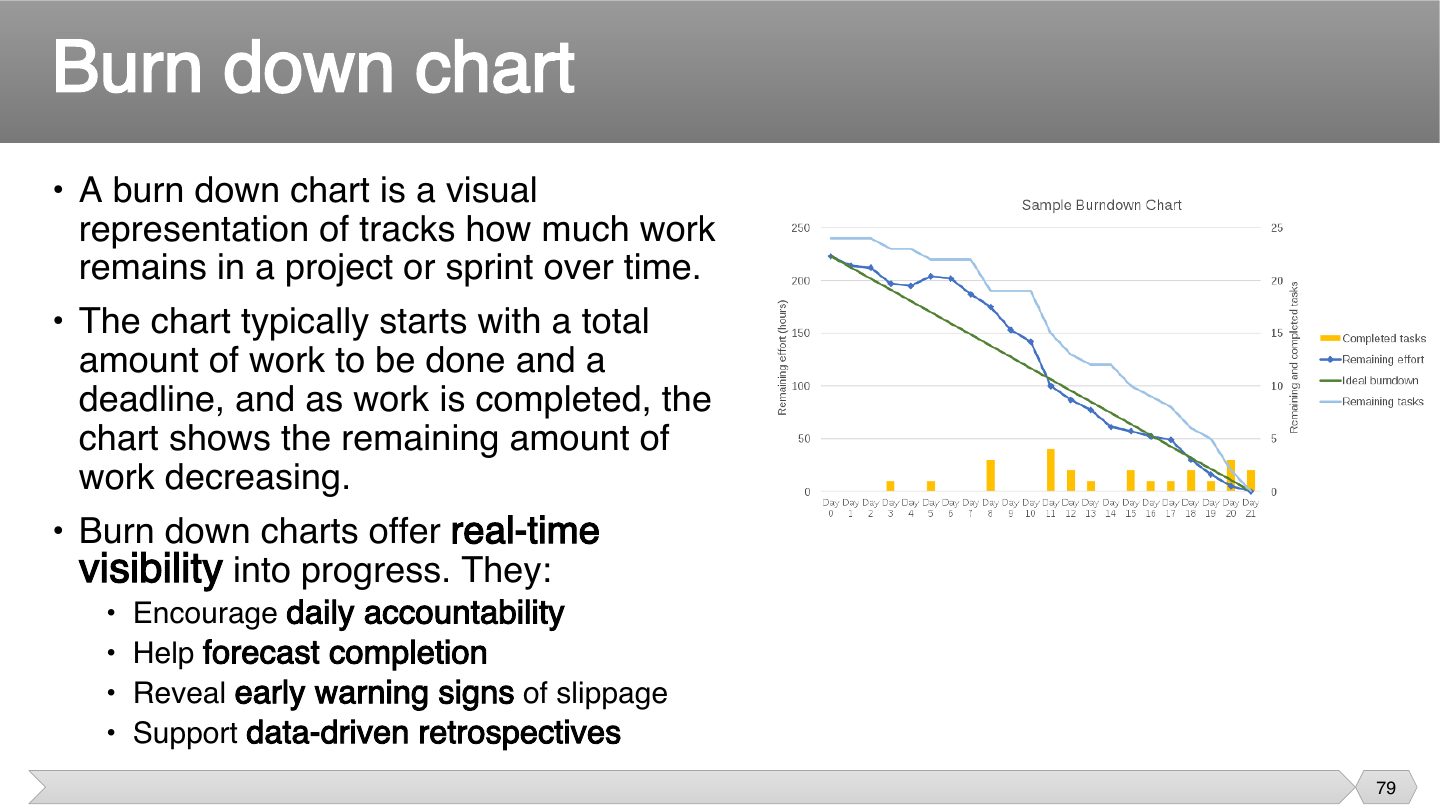
Axes: Y = work remaining (points/hours), X = time (days/sprints).
Actual line above the ideal line = behind schedule; below = ahead.
Exam angle
Q6.2 · how a burn chart shows ahead/behind schedule
Q6.1 · what a burndown measures and its axes
What does a burndown chart measure and how are its axes labeled? How does it show ahead/behind?
Compare with the model answer
It measures work remaining over time. Y-axis: remaining work (story points, tasks or hours). X-axis: time (days of the sprint or sprints). An ideal straight line goes from total work to zero at the deadline. If the actual line is above the ideal, the team is behind schedule; below means ahead; a flat line means no progress. It gives daily visibility, forecasts completion and gives early warning of slippage.
Summary
Notes
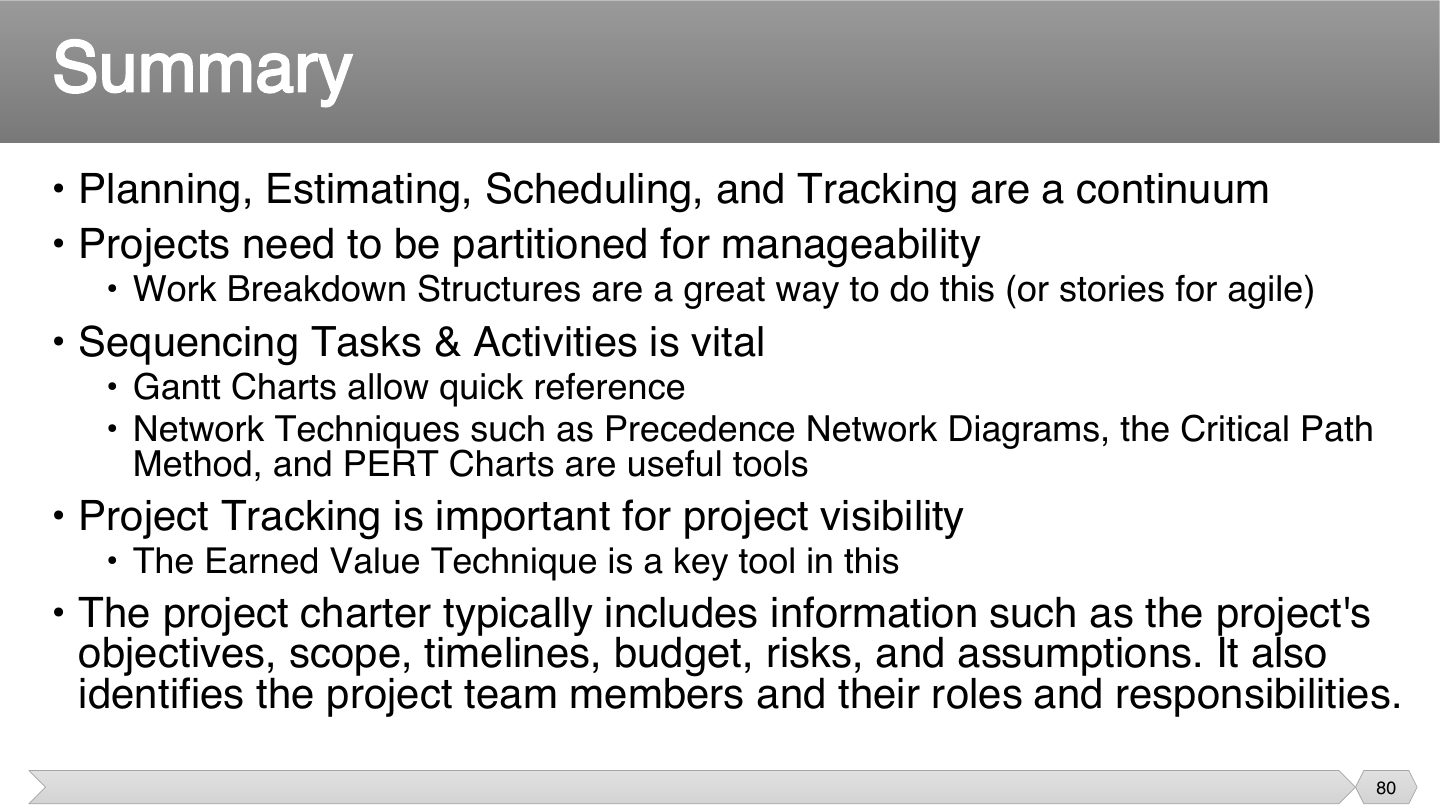
It’s one activity seen at different stages, so each step feeds the next. Tracking results improve your next estimate, which is why they’re a continuum and not a one-way list.
Exam angle
What do the slide’s summary points call planning, estimating, scheduling and tracking?
- Each one feeds the next.
- Agile uses them too.
- They’re connected.
- Not stated.