What is the correct order of the basic estimation process?
Estimation
Estimation methods, three-point estimating and COCOMO. Both finals had a COCOMO calculation (32 KLOC and 20 KLOC organic) and a “choose two estimation techniques” question, so the formulas on slides 39–47 and the method trade-offs on slides 9–16 are where marks are.
How to read this page
Every original slide is shown unchanged. Yellow marks on a slide point to a numbered note: hover or tap a mark to jump to its note, and hover a note to see its marks. Questions tagged Past exam appeared on a real paper; Prediction questions are likely angles, not confirmed. Pick an answer to each question: a wrong pick tells you why it is wrong, so you can try again.
All 60 slides
- 1 Estimation
- 2 Outline
- 3 Estimation
- 4 Estimation
- 5 Estimation
- 6 Estimation: definitions
- 7 Cone of Uncertainty
- 8 Estimation Methodologies
- 9 Estimation Methodologies
- 10 Expert Judgment
- 11 Top-down Estimation
- 12 Bottom-up Estimation
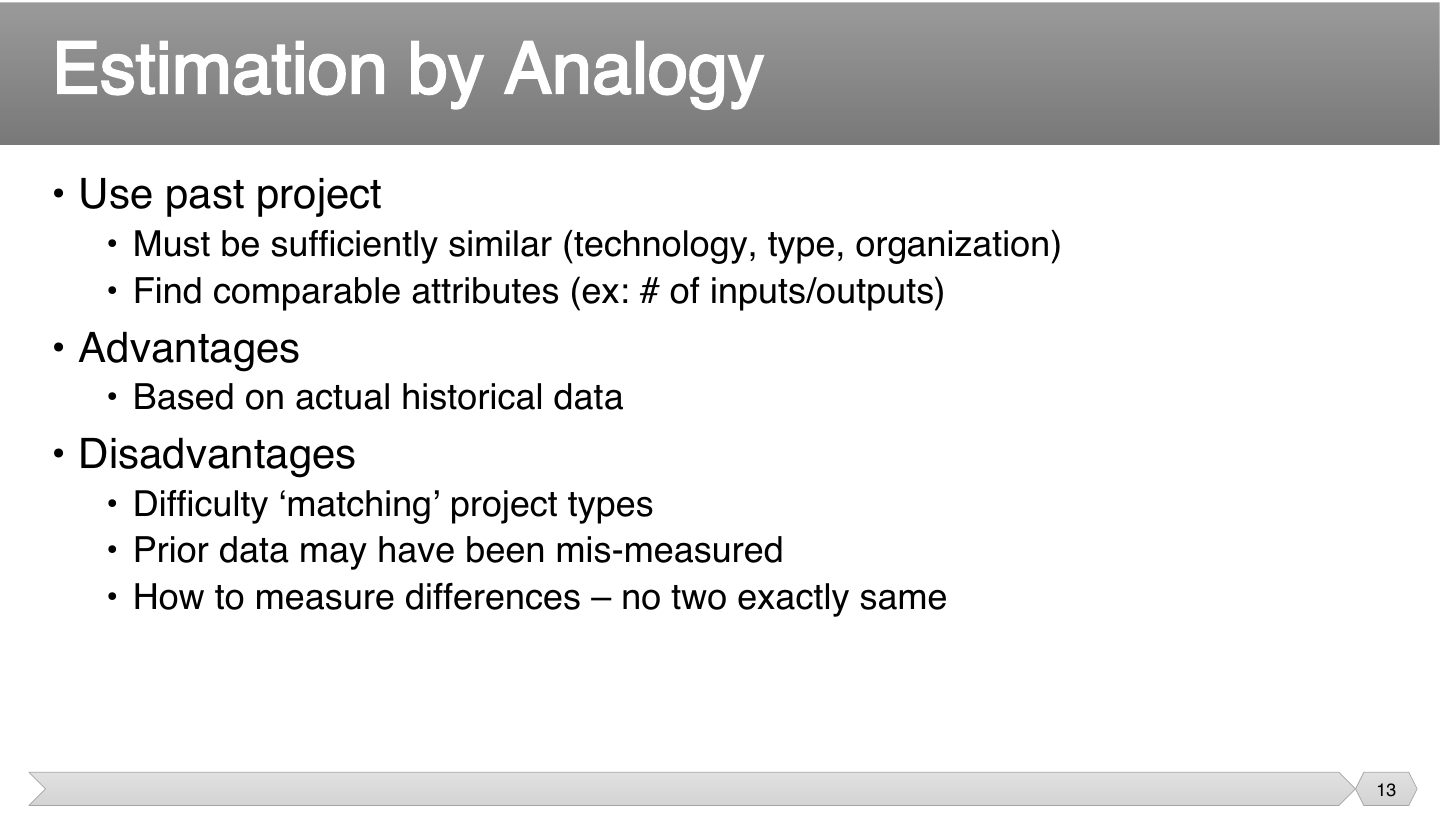
- 13 Estimation by Analogy
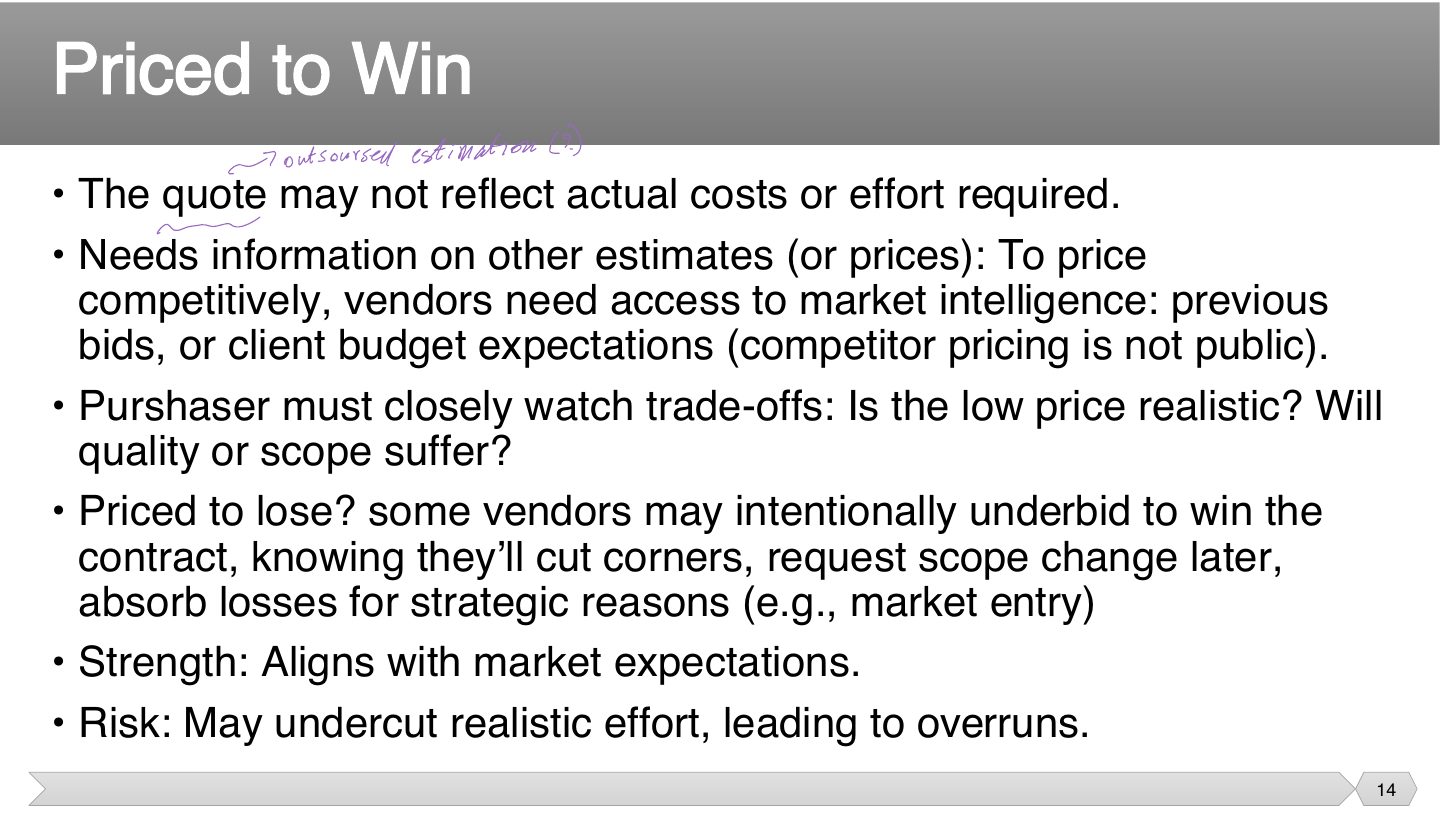
- 14 Priced to Win
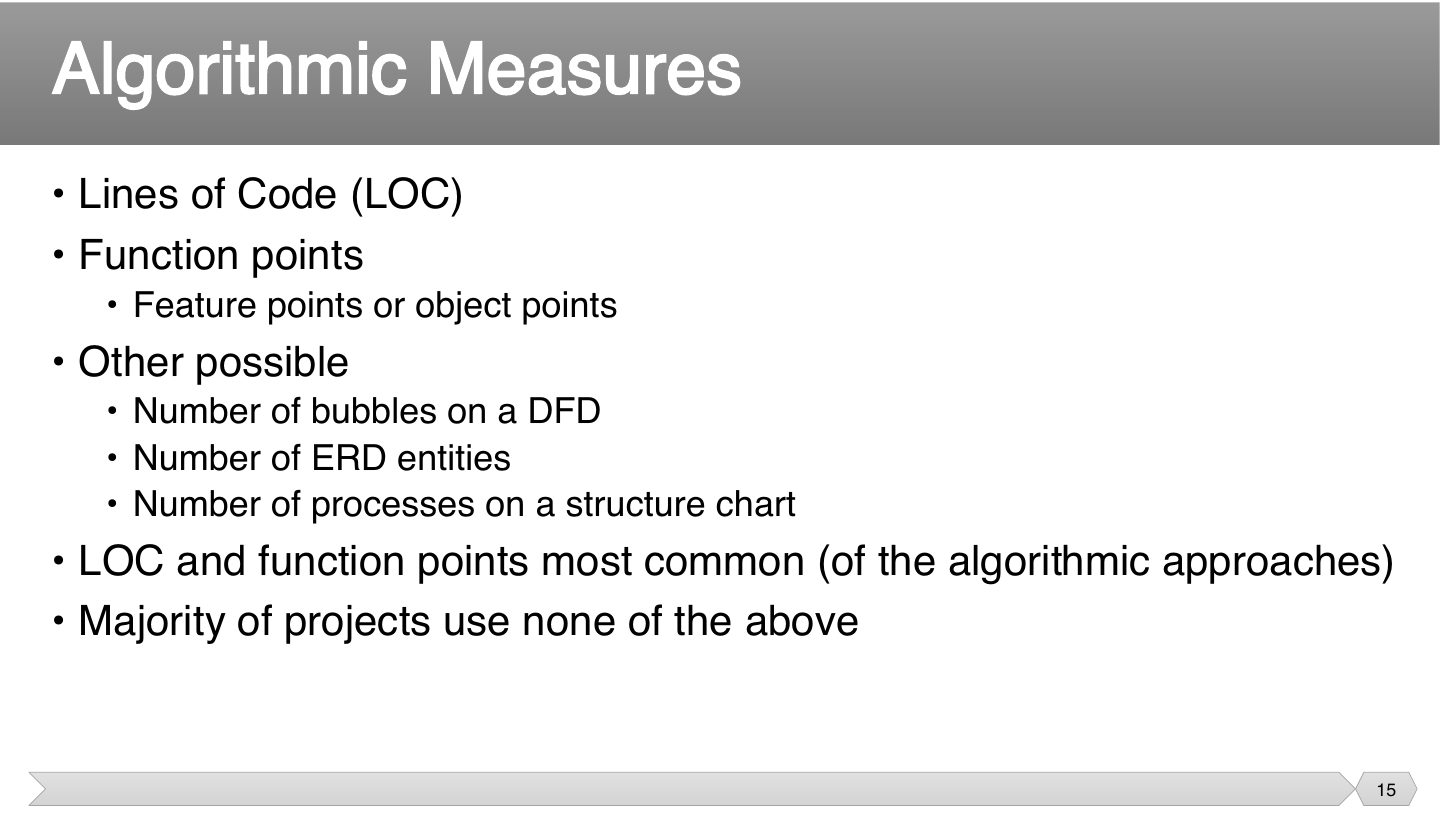
- 15 Algorithmic Measures
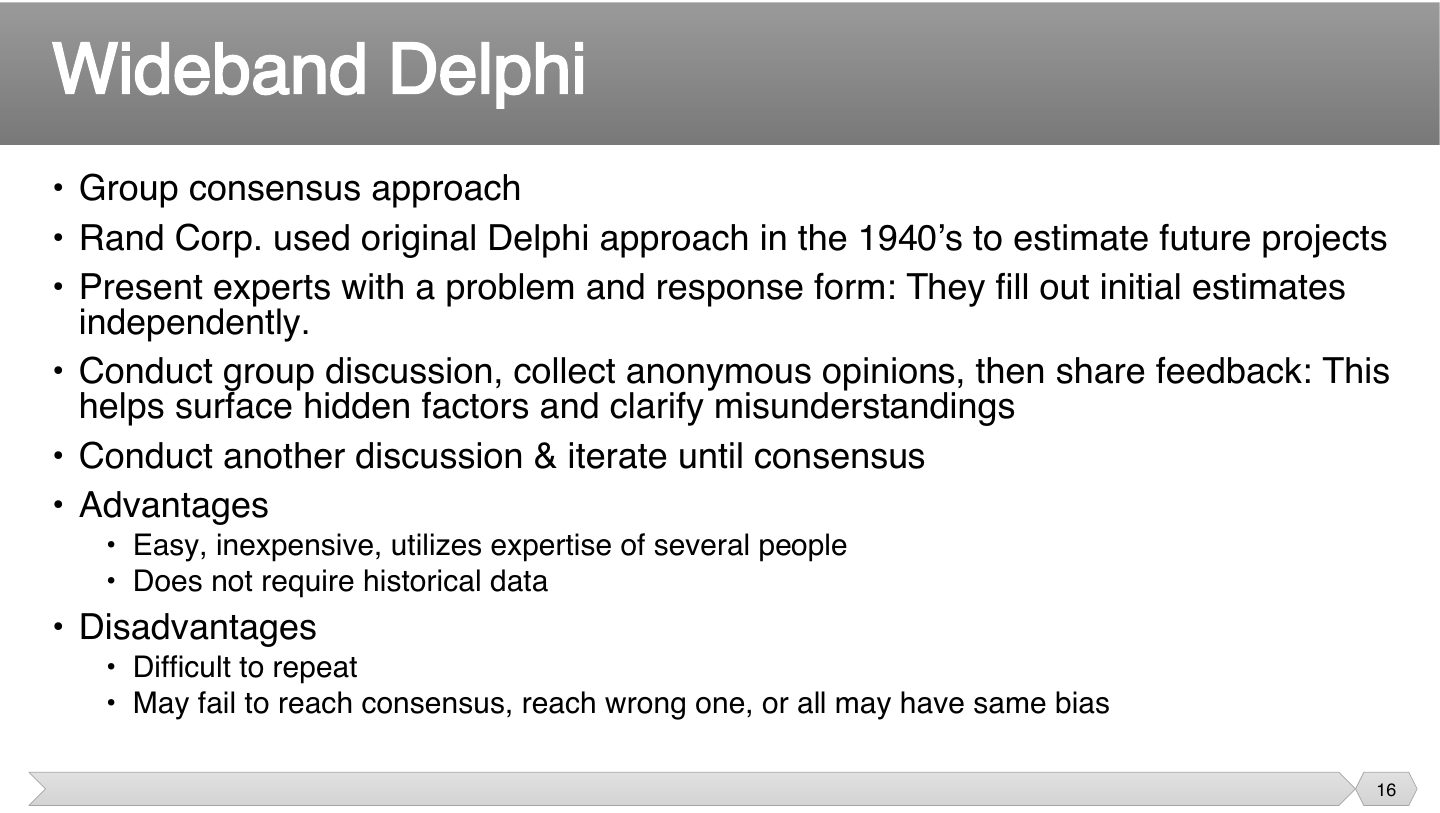
- 16 Wideband Delphi
- 17 Code-based Estimates
- 18 Function Points
- 19 Function Point Process
- 20 Effort Estimation
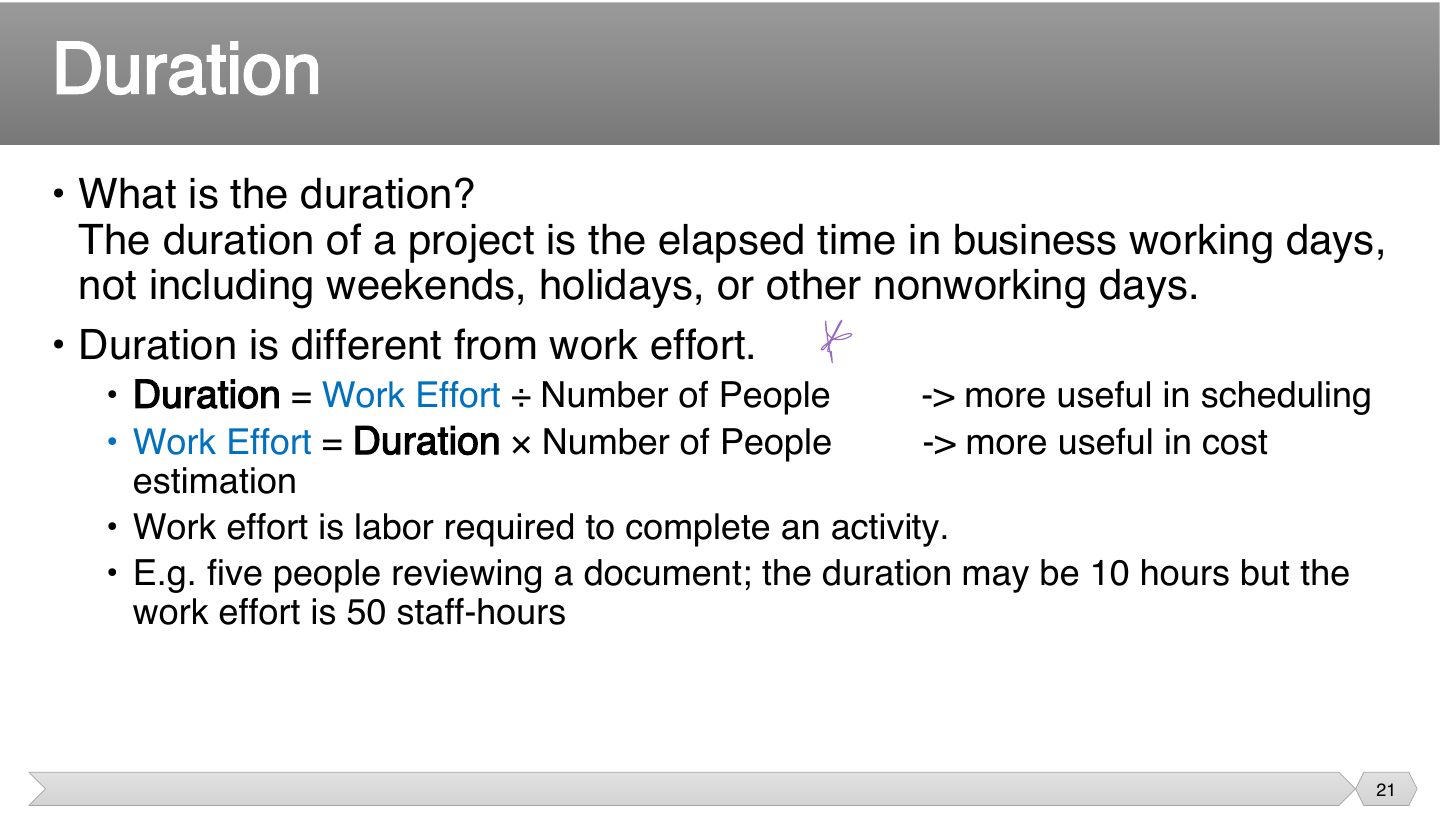
- 21 Duration
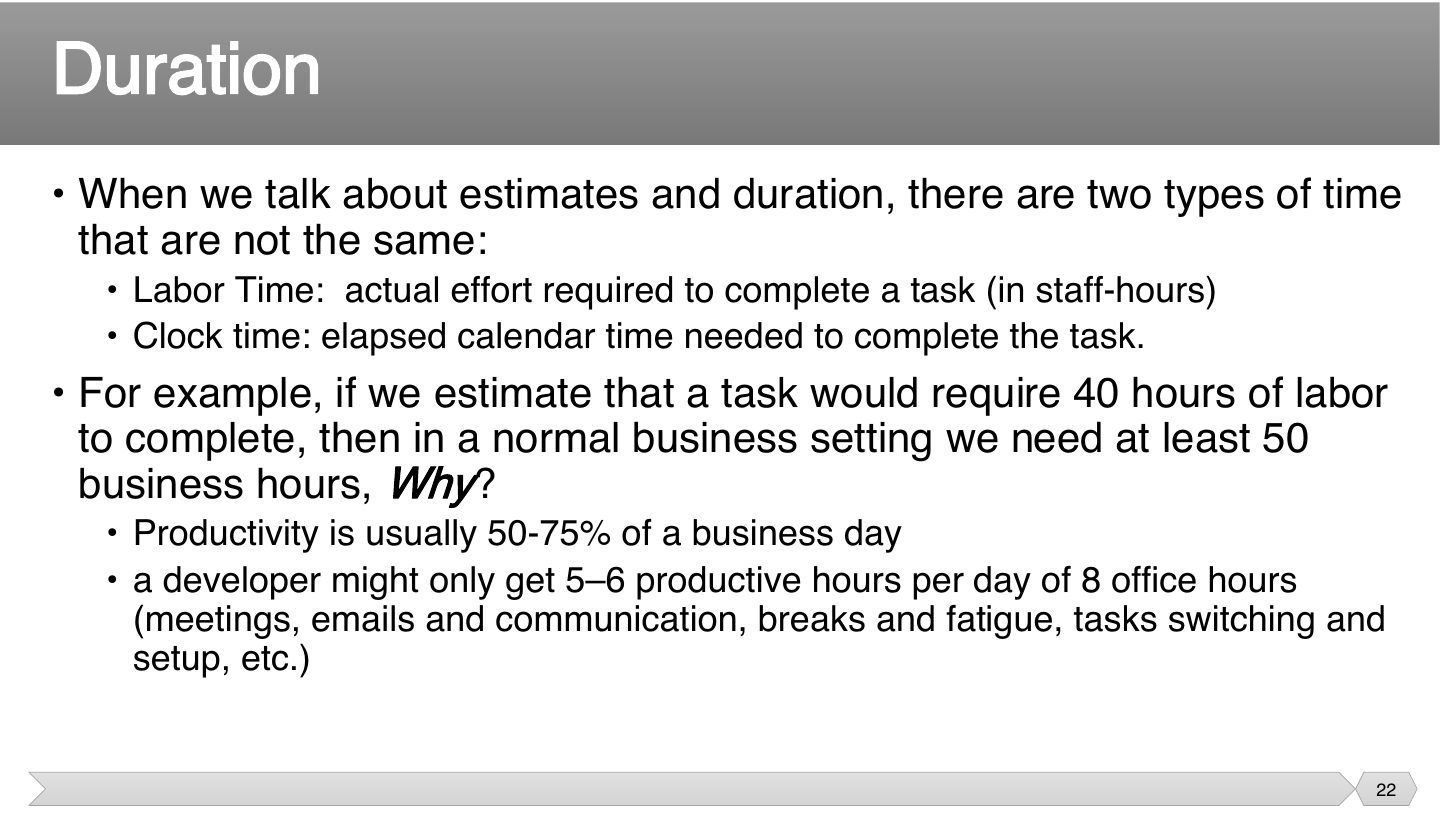
- 22 Duration
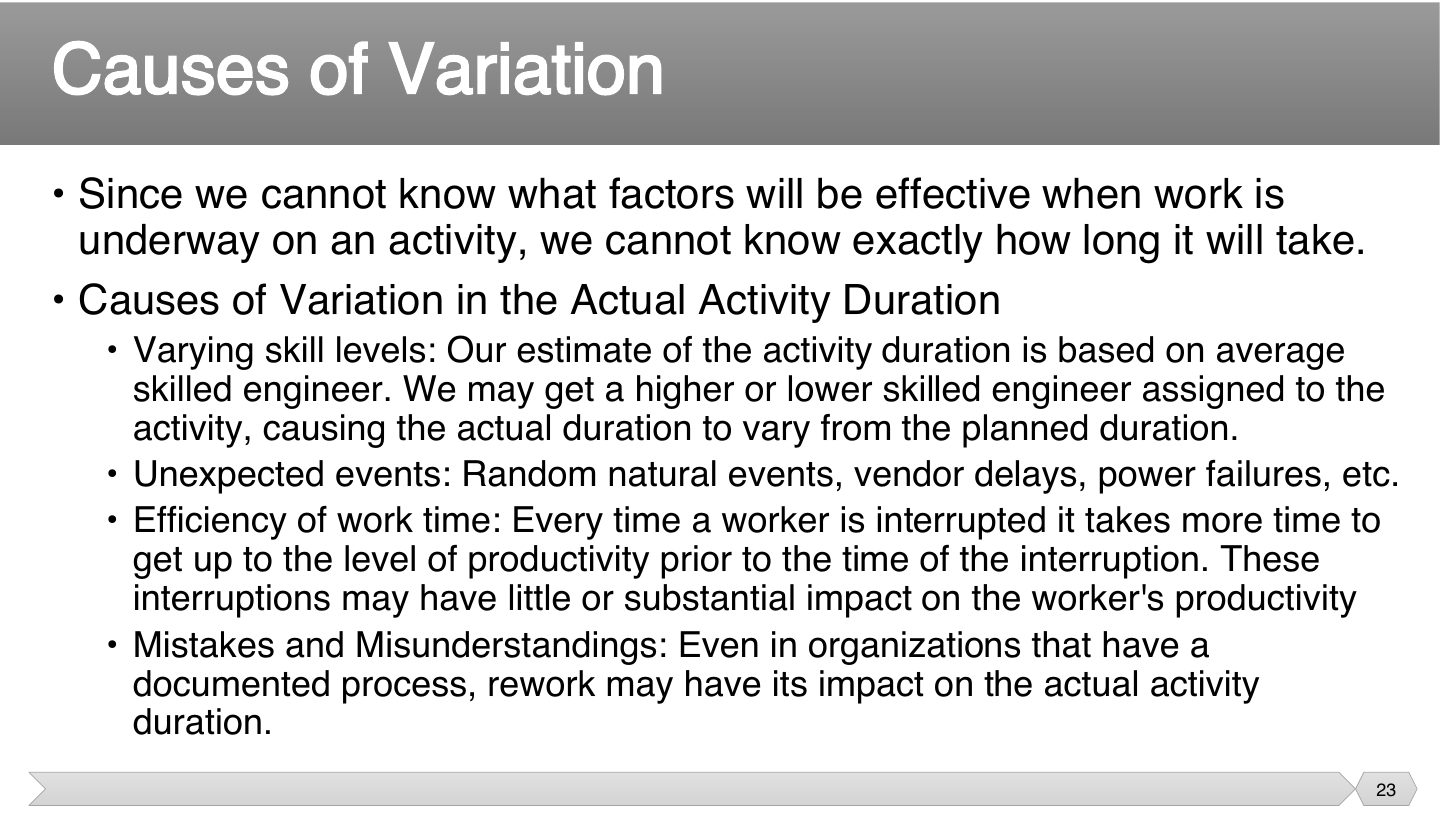
- 23 Causes of Variation
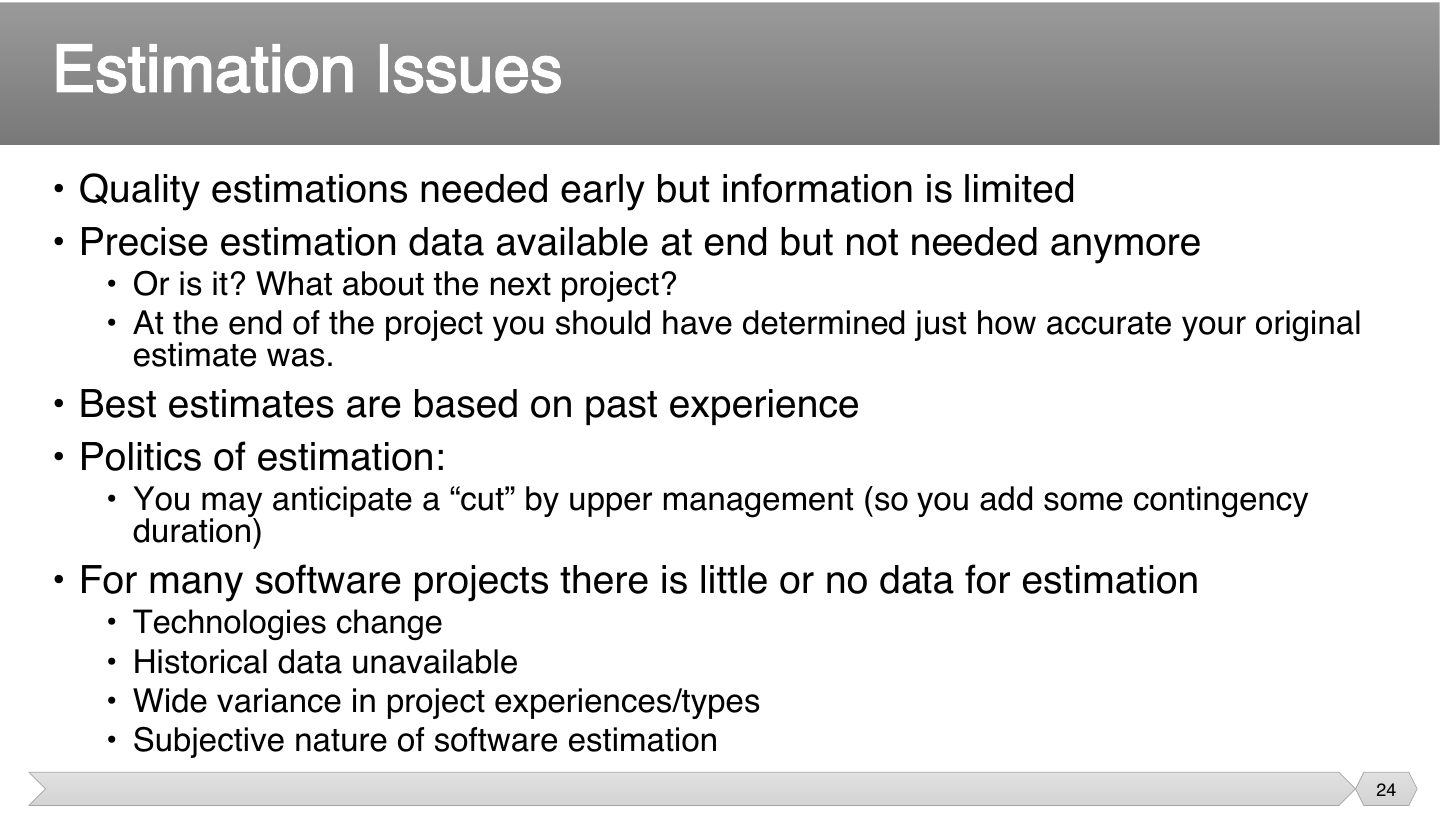
- 24 Estimation Issues
- 25 Over and Under Estimation
- 26 Introduction: Activity Resource Estimation
- 27 Controlling factors in resource estimation
- 28 Estimating tools
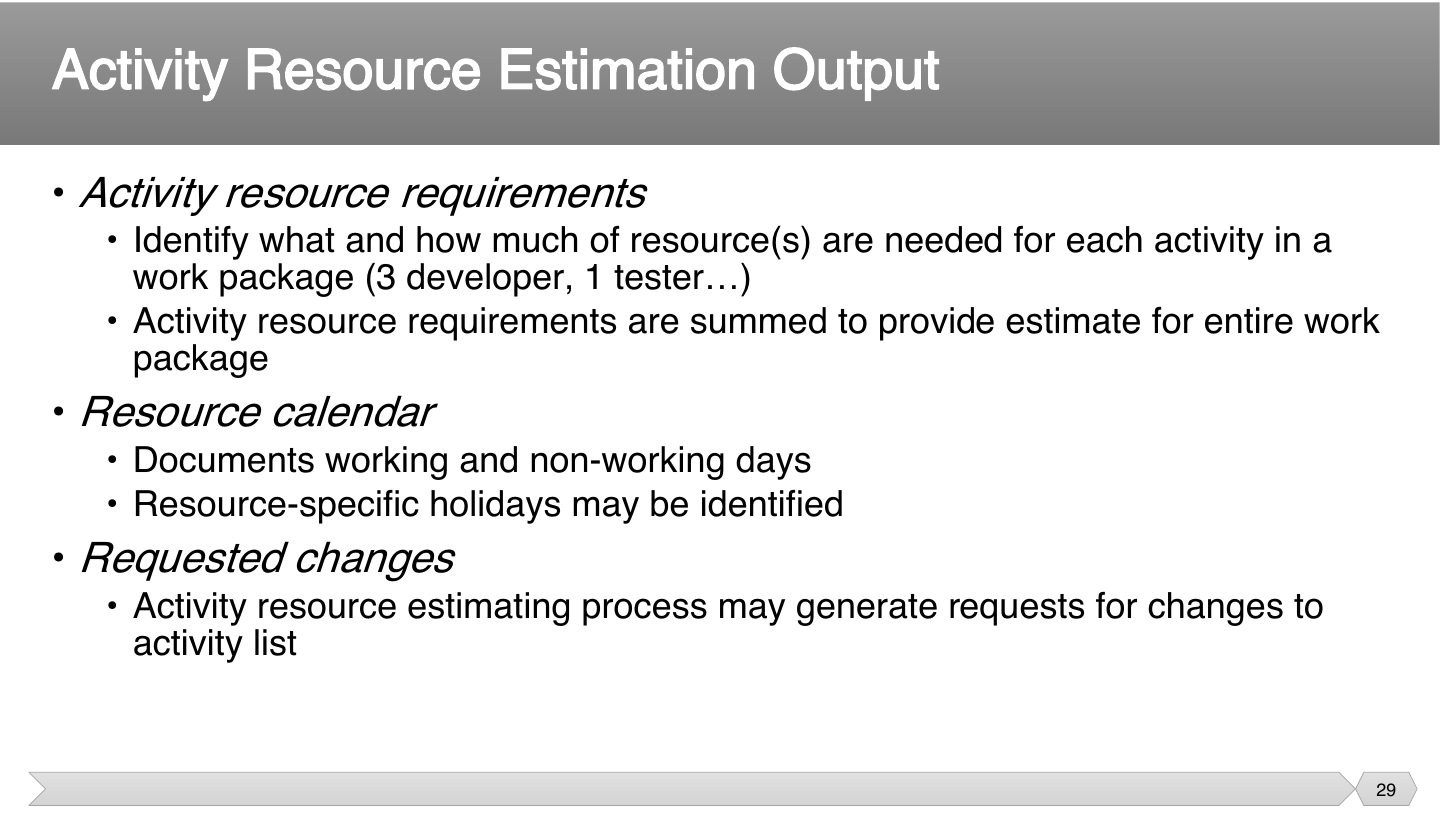
- 29 Activity Resource Estimation Output
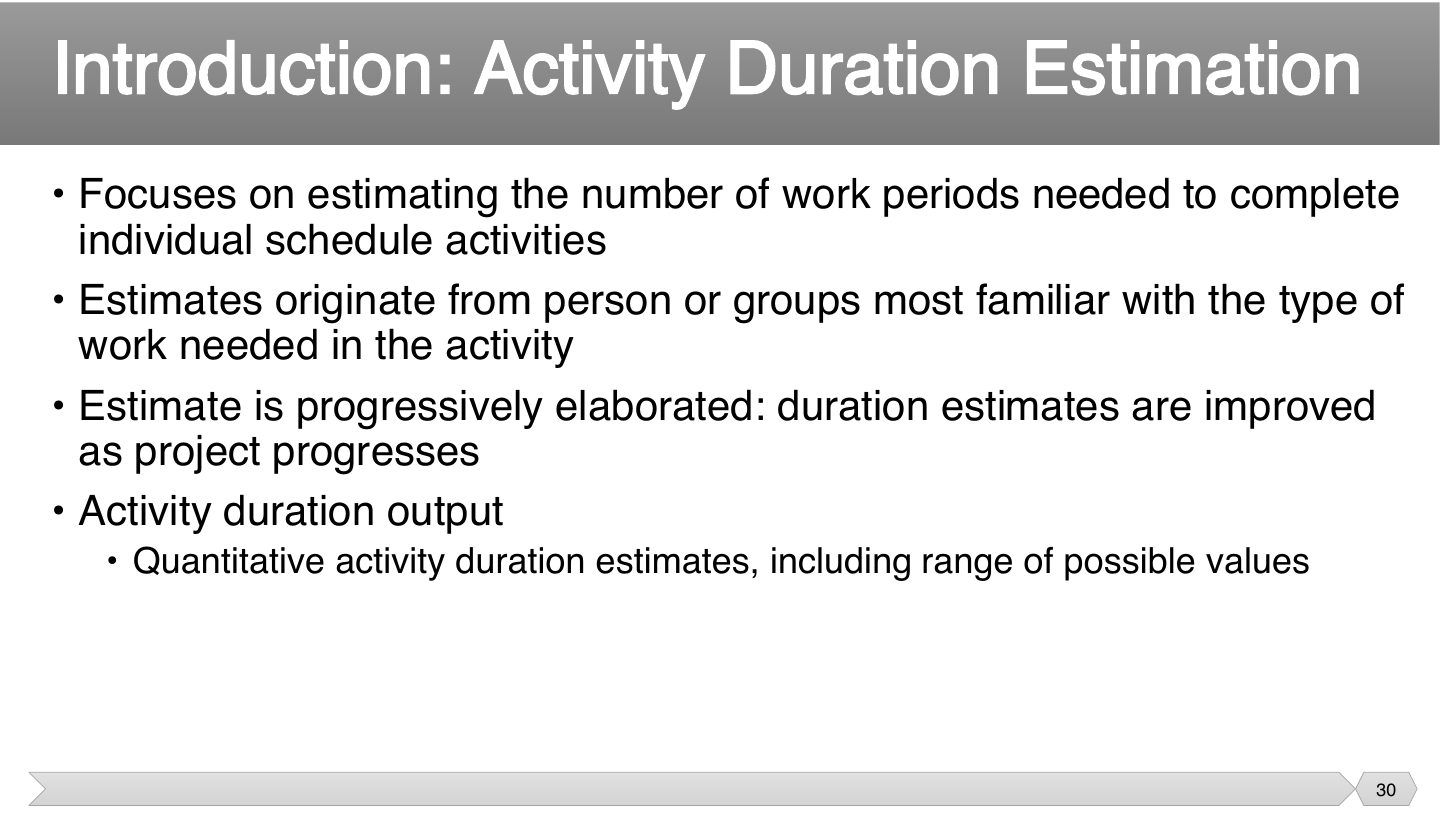
- 30 Introduction: Activity Duration Estimation
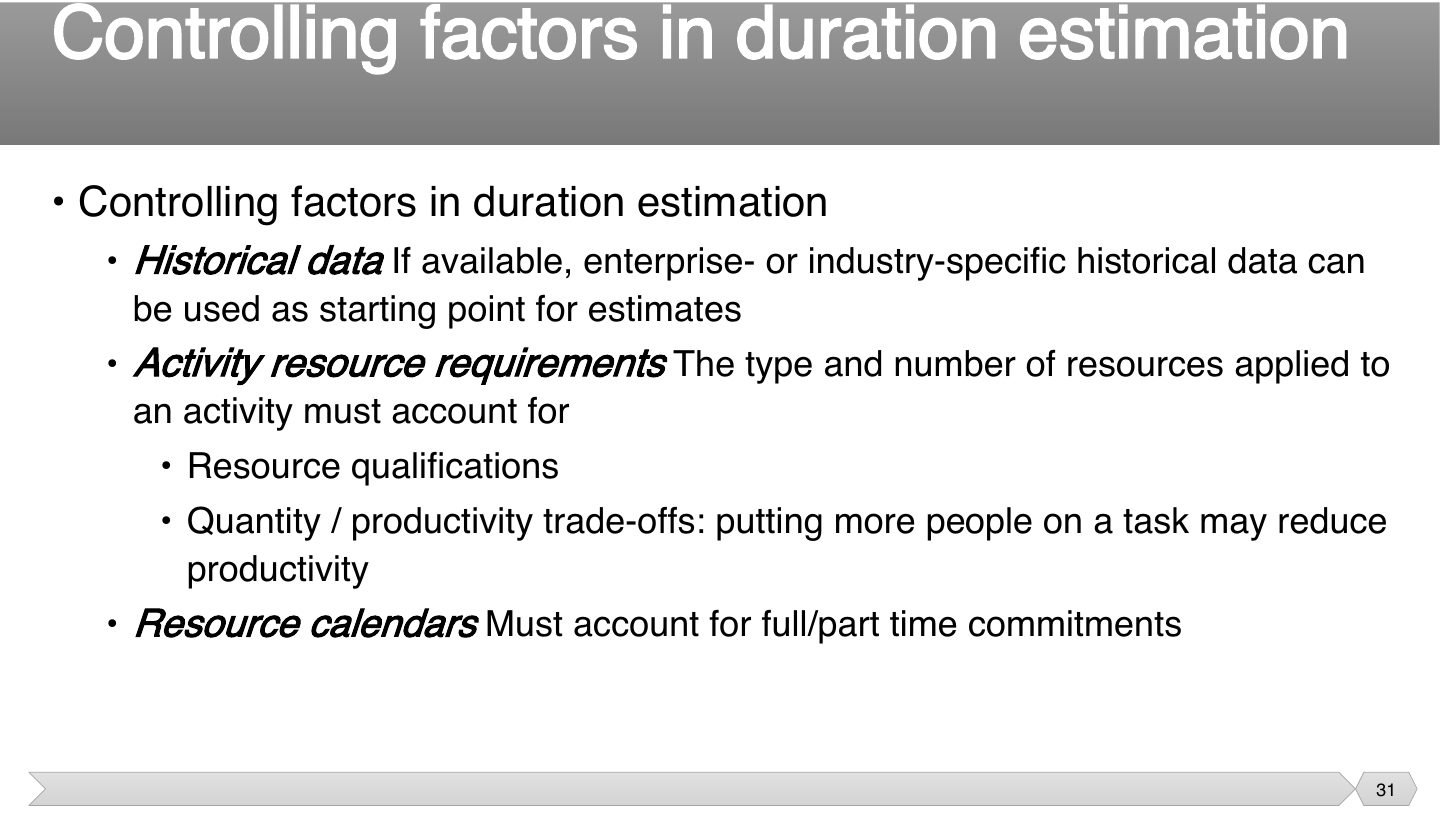
- 31 Controlling factors in duration estimation
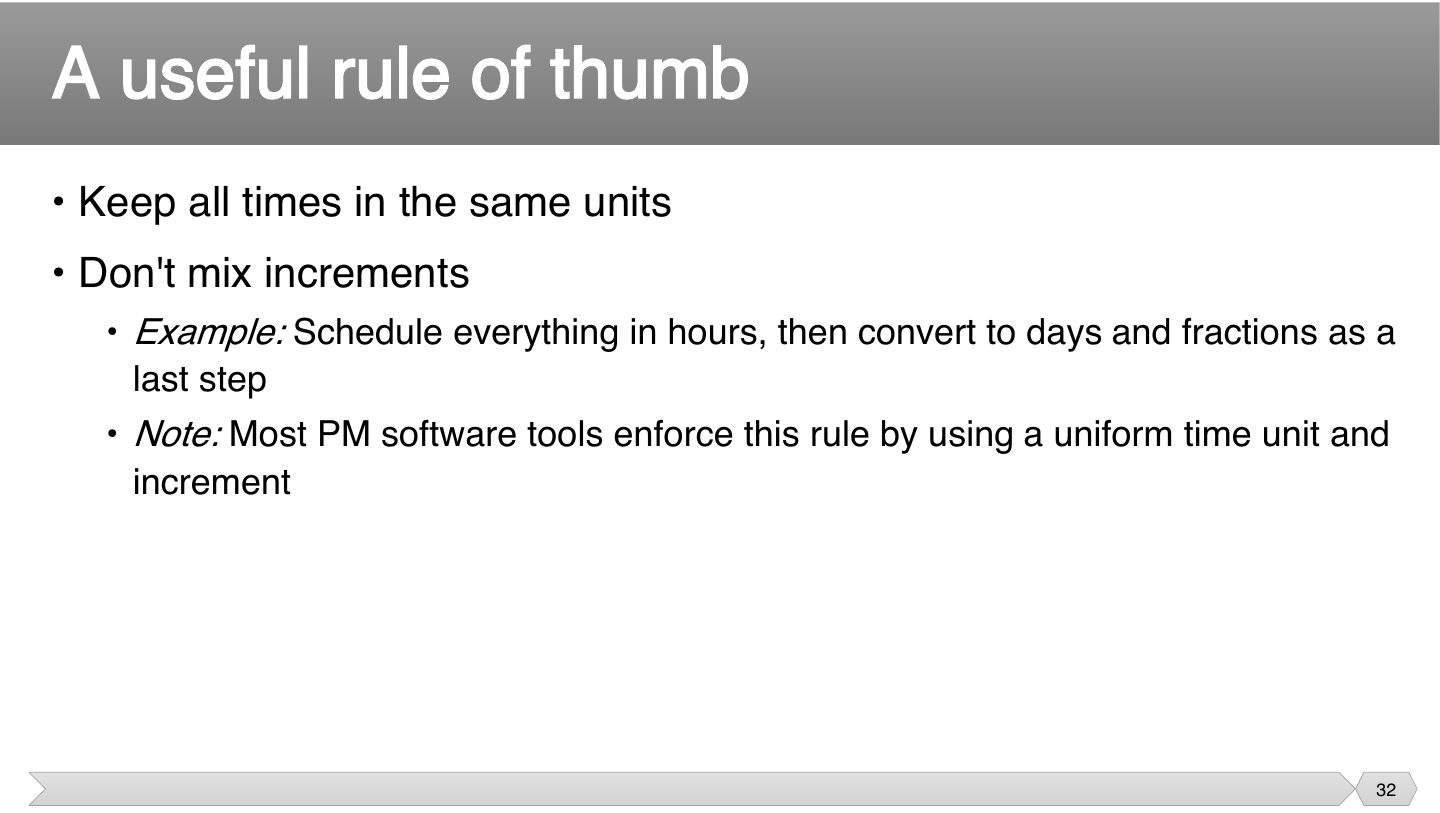
- 32 A useful rule of thumb
- 33 Estimating tools
- 34 Three Point Estimating
- 35 Example: Three Point Estimation of LOC
- 36 Example: Three Point Estimation using Function Points
- 37 COCOMO
- 38 COnstructive COst Model (COCOMO)
- 39 Basic COCOMO – More Constants
- 40 Basic COCOMO – The Modes
- 41 Basic COCOMO – Example
- 42 Basic COCOMO – Development Time
- 43 Basic COCOMO – Example
- 44 Basic COCOMO – Average Staff Size
- 45 Basic COCOMO – Productivity
- 46 COCOMO Complete Example - Organic
- 47 COCOMO Complete Example - Embedded
- 48 Intermediate COCOMO – Cost Drivers
- 49 Intermediate COCOMO – Cost Drivers
- 50 COCOMO Advantages
- 51 COCOMO Limitations
- 52 Final Notes
- 53 Code Reuse and Estimation
- 54 Estimation for Agile
- 55 Know Your Deadlines
- 56 Estimation Presentation (Communication)
- 57 Final Estimates
- 58 Estimation Guidelines
- 59 Other Estimation Factors
- 60 Other Estimation Notes
Estimation
Notes
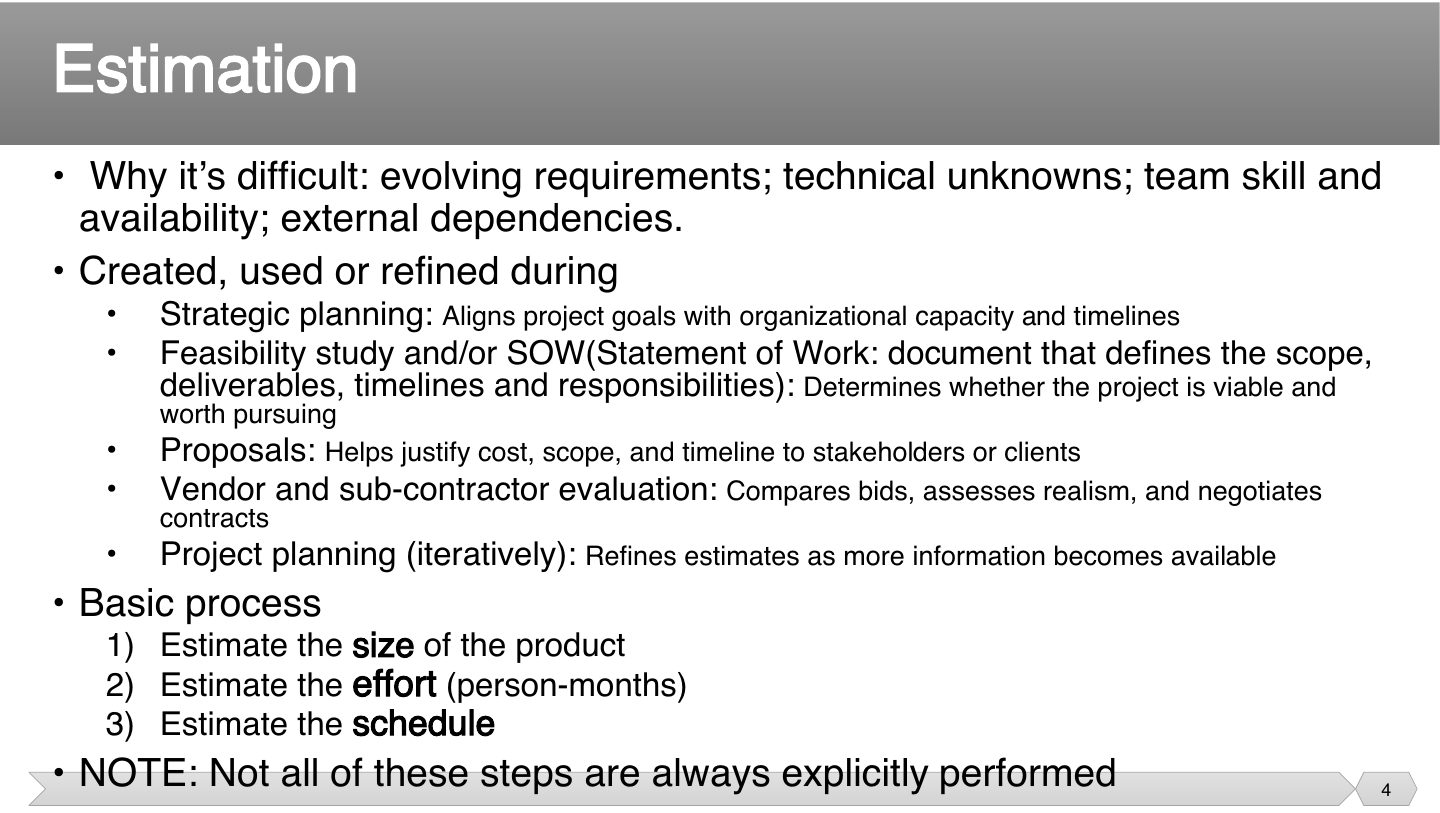
Order of estimation: Size → Effort → Schedule. COCOMO turns size into effort and then into time.
Outline
Notes
COCOMO (slides 37–51) is the calculation part; methods (9–17) are the written-answer part.
Estimation
Estimation
Notes
You’re predicting work nobody has done yet, with people who may change, on requirements that may move. That’s why estimating is hard, and it’s never just a matter of being careful.
Each step needs the one before. You can’t work out how much labor something takes without knowing how big it is, and you can’t set dates without knowing the labor. So the order is size → effort → schedule.
Memory trick S.E.S.: Size, Effort, Schedule, always in that order.
Exam angle
Estimation
Notes
You can guess your trip home well because you’ve done it many times. Most software hasn’t been done before, so there’s no such “average”. That’s why even good estimates are often off by 25–100%.
Exam angle
Why are software estimates often off by so much?
- The slide doesn’t blame people.
- That’s what the slide says.
- An exact estimate isn’t possible.
- That’s not true.
Estimation: definitions
Notes
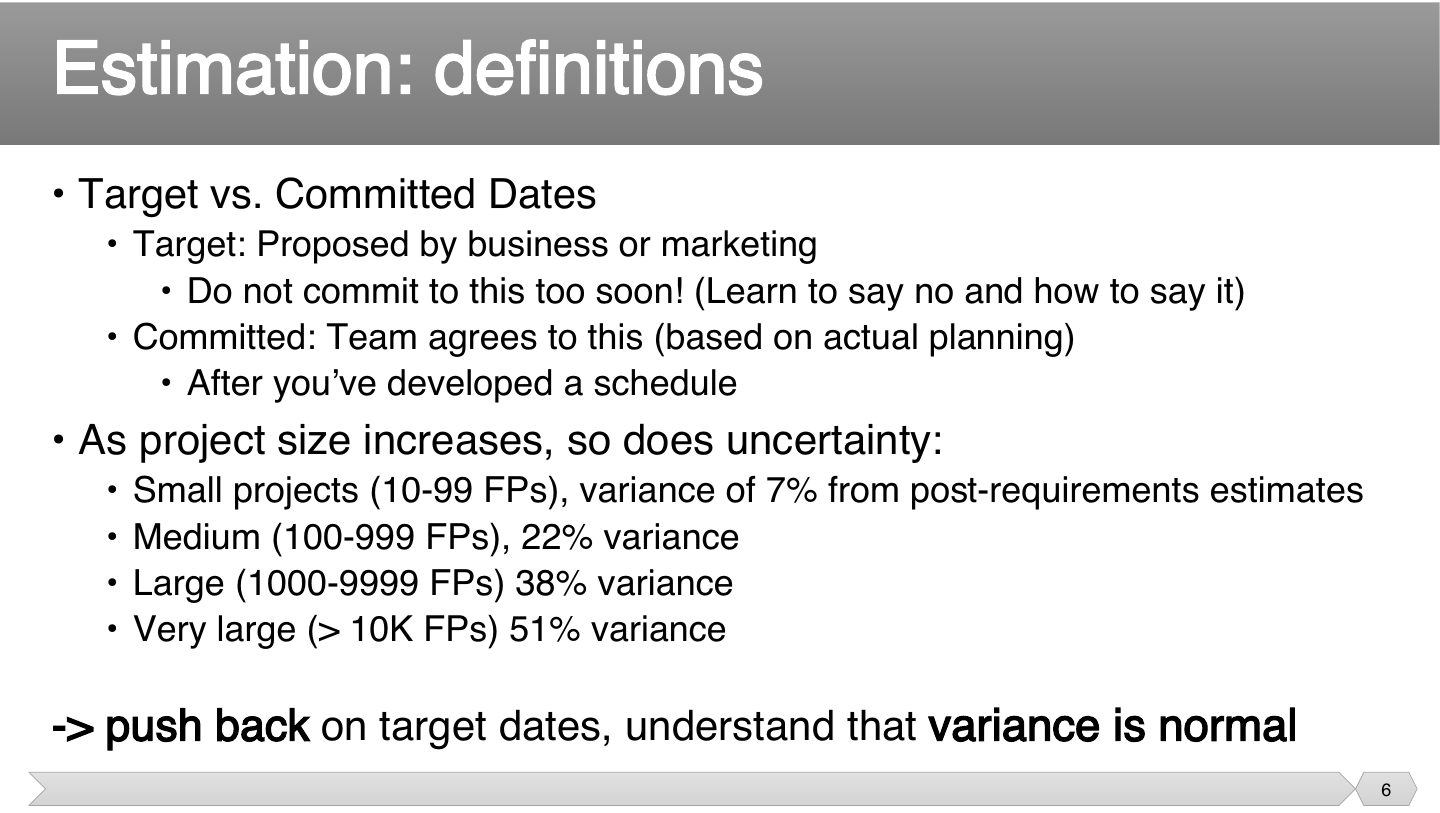
A target is what someone hopes for, and a commitment is what the team has actually checked it can do. Treating a wish as a promise is how impossible deadlines get born, so learn to say no.
More work means more unknowns and more connections between them. So a small estimate may be quite close, while a very large one can be off by half. Uncertainty grows with size.
Exam angle
A target date is one the team commits to after building a schedule.
- That is a committed date. Targets come from business or marketing.
Cone of Uncertainty
Notes
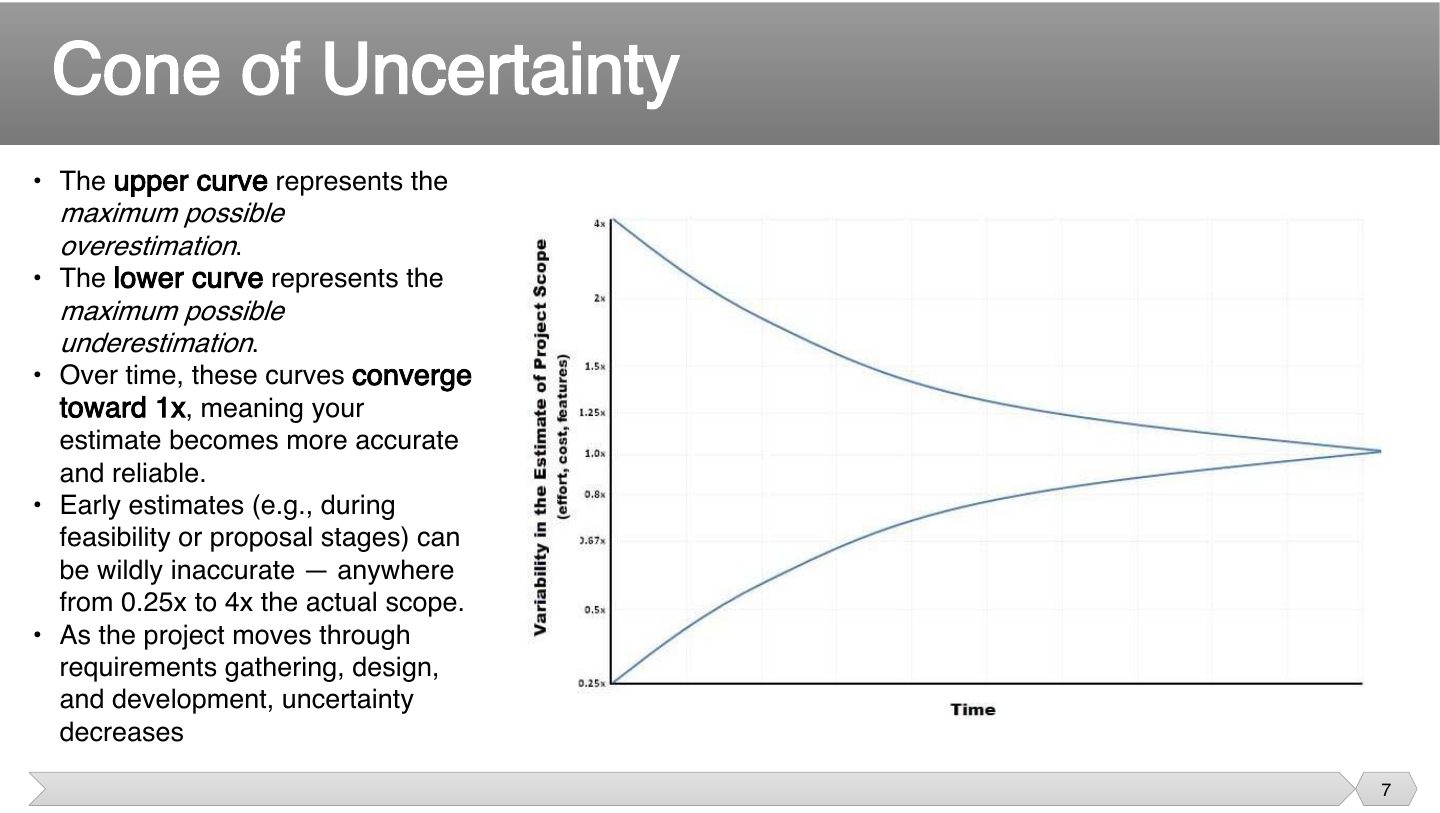
Early estimates can be 0.25× to 4× the real value; the cone narrows as you learn.
Seen again Ch 1.2, slide 40: Estimates change as the project evolves
Exam angle
At the feasibility stage, the cone of uncertainty says estimates may range from:
Estimation Methodologies
Estimation Methodologies
Notes
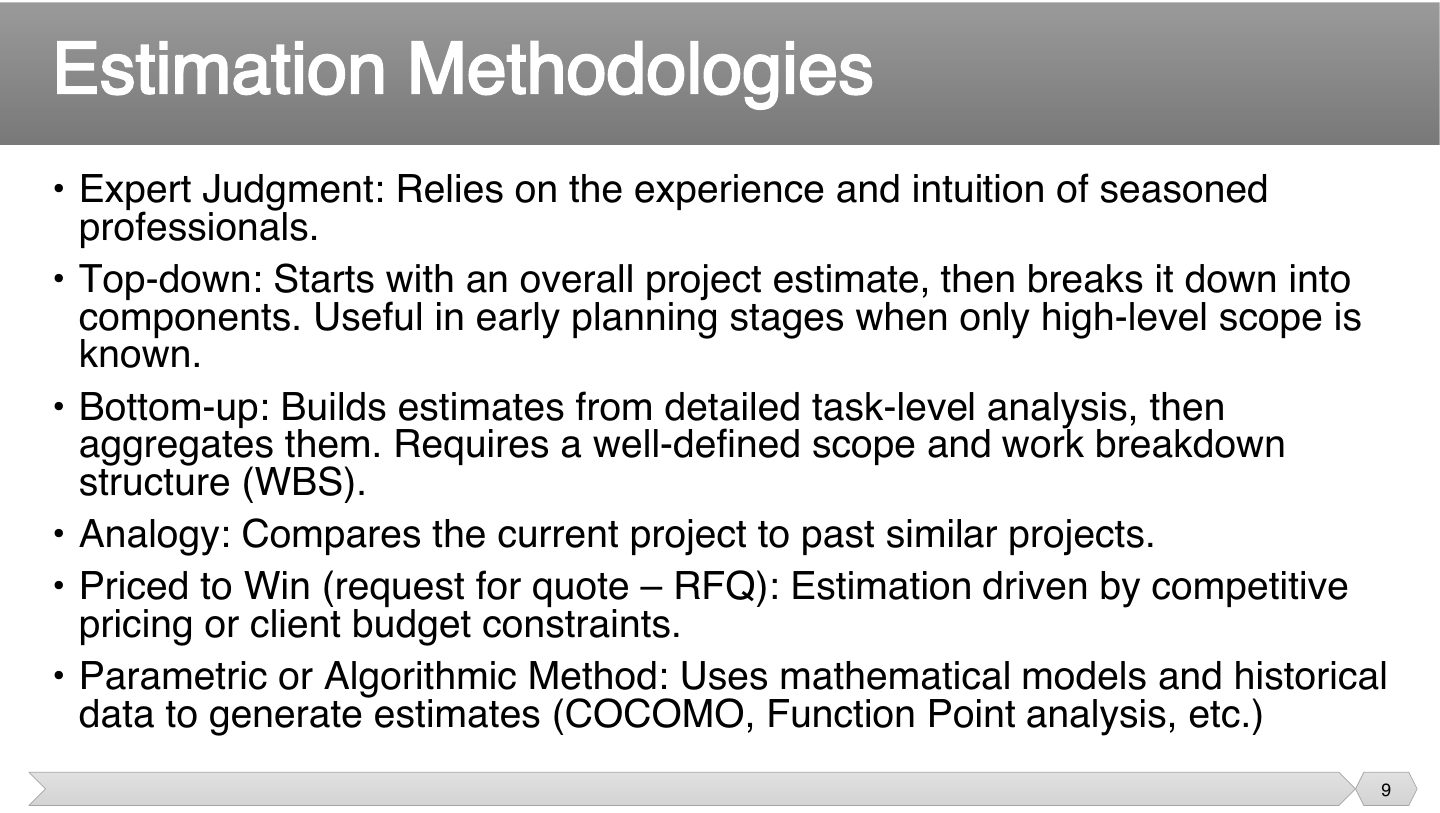
Six methods. In an exam scenario, pick two and say WHY they fit (e.g., analogy early using past projects; bottom-up once a WBS exists).
Memory trick “Every Team Brings A Pricing Algorithm”: Expert, Top-down, Bottom-up, Analogy, Priced-to-win, Algorithmic.
Tips & tricks
- BEAT PoP: Bottom-up, Expert judgment, Analogy, Top-down, Priced to win, Parametric.
Exam angle
Q2.2 · two effort estimation techniques for the solar project
Q2.1 · estimation techniques and how to validate estimates
Choose two effort-estimation techniques for a 12-month hardware/software project and explain how each supports planning and risk control (Final 242).
Compare with the model answer
Bottom-up estimation: decompose the work into a WBS and estimate each task with the people who will do it; this is the most accurate, exposes hidden work and gives a baseline to track against. Three-point (PERT) estimating: for uncertain tasks like prototyping, get optimistic, most likely and pessimistic values and compute (O+4M+P)/6; the spread shows risk and sizes contingency reserves. Alternatives: analogy to past solar projects early on, Wideband Delphi for expert consensus, COCOMO for the software part. Validate estimates by comparing two methods and against historical data, and refine iteratively.
Expert Judgment
Notes
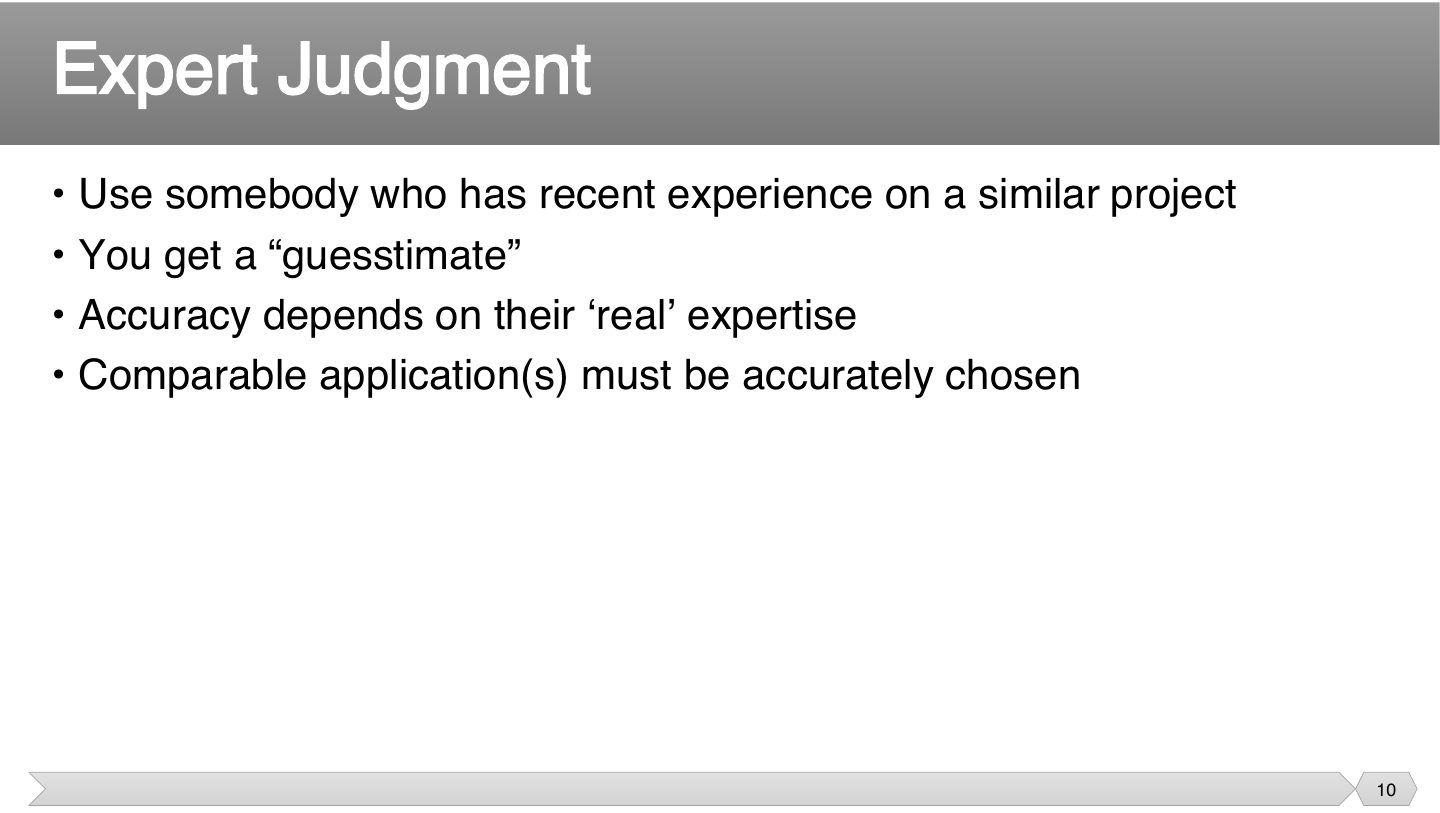
Asking someone who’s done it before is fast and cheap. It’s only as good as their experience, though, so a guesstimate from someone whose last similar project was ten years ago may mislead you.
Exam angle
What does expert judgment’s accuracy depend on?
- A title doesn’t guarantee relevant experience.
- It’s only as good as their experience.
- That’s not it.
- That’s not it.
Top-down Estimation
Notes
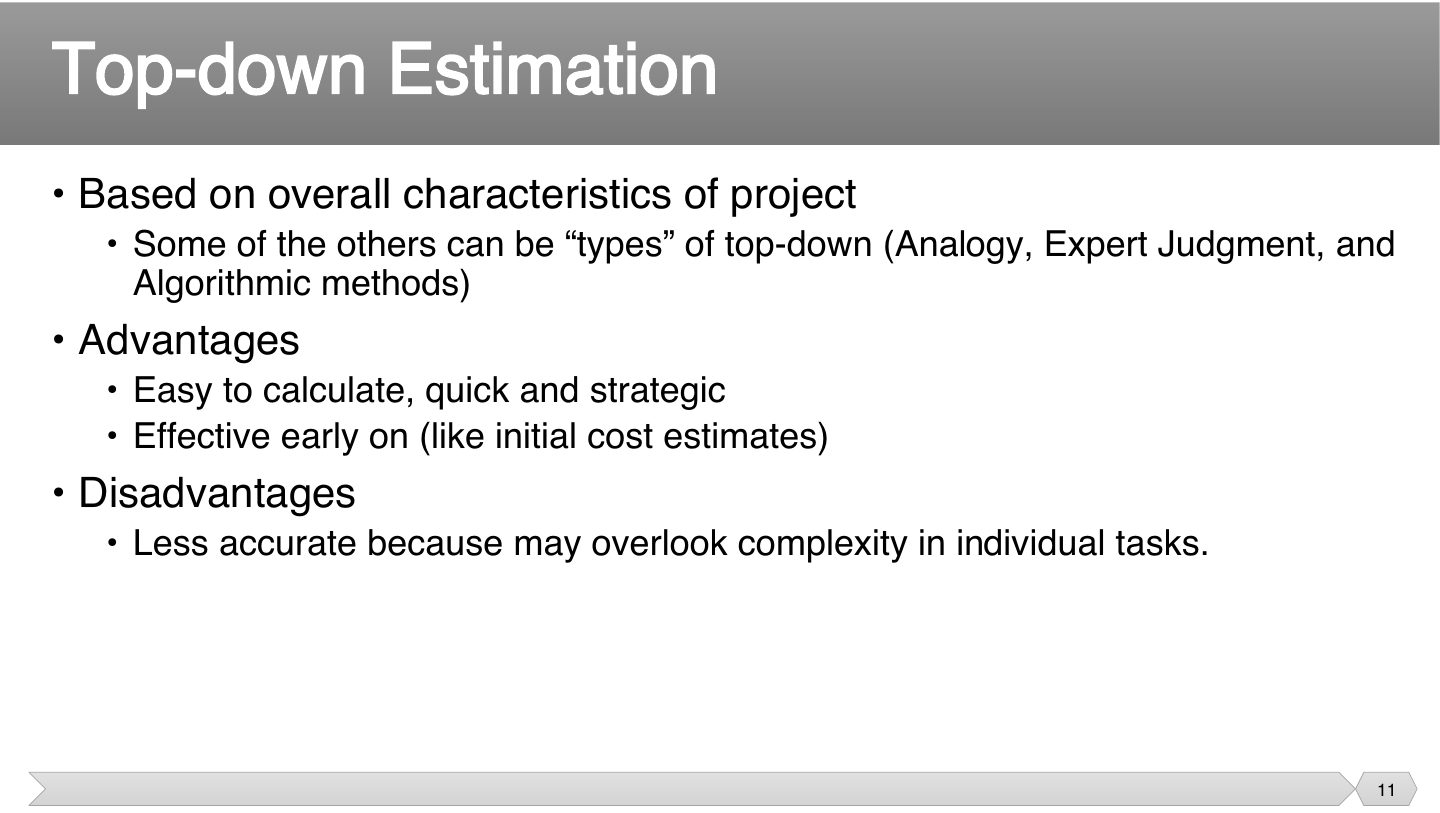
You look at the whole project and judge it from similar size or type. It works early, when you don’t yet have the detail. The weakness is that hidden complexity in individual tasks gets missed, so it’s less accurate.
Exam angle
When is top-down estimation especially useful?
- It’s useful early.
- It can miss task complexity.
- That suits bottom-up.
- It’s quick and strategic.
Bottom-up Estimation
Notes
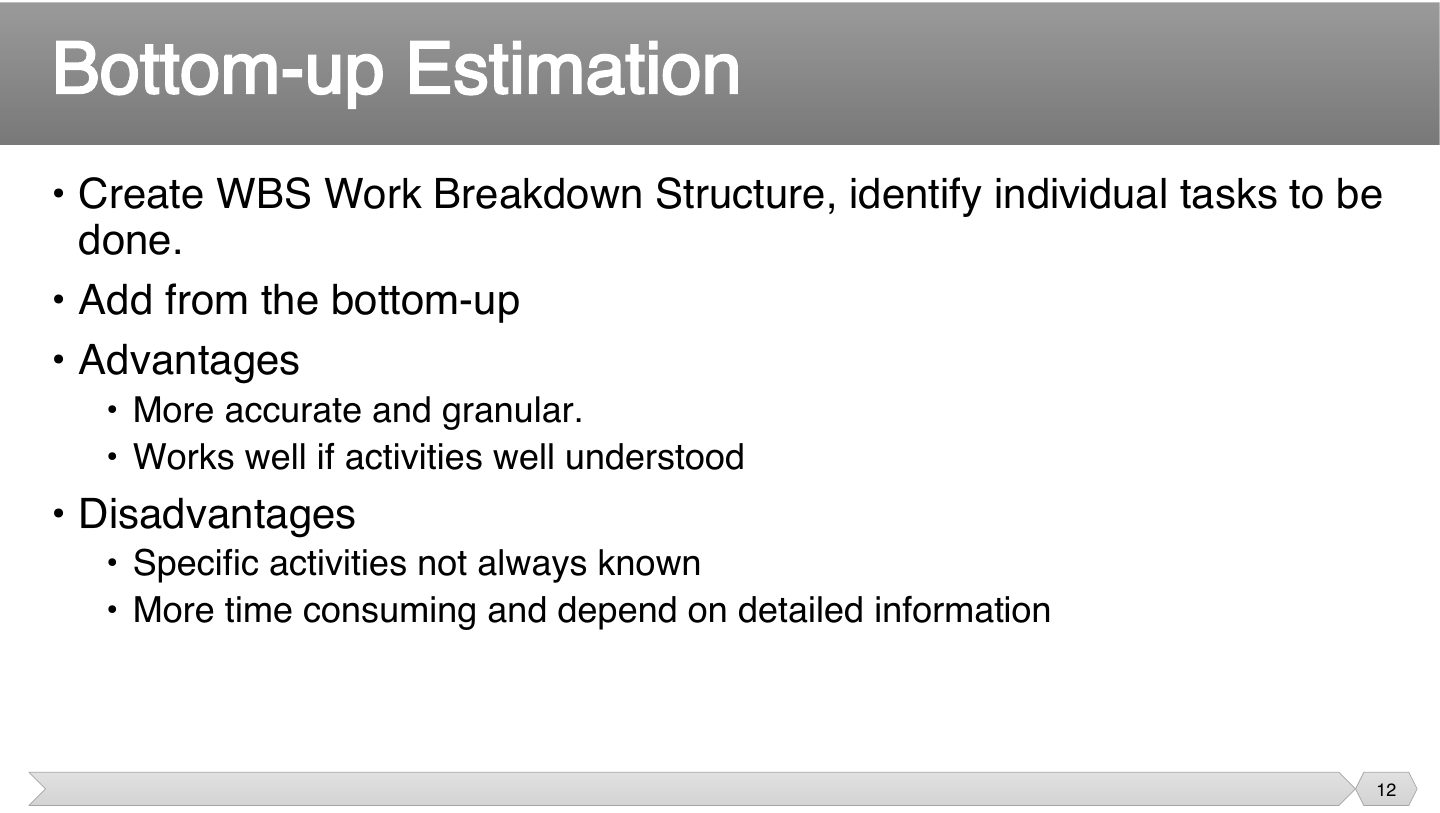
You estimate each small task and add them up, which is why it needs a WBS. Detail improves accuracy, but it takes time, and the detail may not exist yet early on.
Trap Top-down = fast but rough (early). Bottom-up = slow but accurate (needs WBS).
Exam angle
Which method requires a work breakdown structure and is the most granular?
Estimation by Analogy
Notes
If last year’s similar project took six months, that’s real evidence, not a guess. The catch is that no two are the same, so you must adjust for the differences. That’s where analogy gets hard.
Exam angle
What is the main difficulty of estimating by analogy?
- It can.
- It uses real historical data.
- No two are exactly the same.
- That’s bottom-up.
Priced to Win
Notes
Here the estimate starts from what will win the contract, not from the work. It can win the bid and still lead to overruns or cut corners. So priced to win isn’t really an estimate of effort at all.
Exam angle
A vendor underbids to win and plans to raise the cost through change requests. What’s this called?
- The slide’s term for intentional underbidding.
- That’s from the WBS.
- That’s asking an experienced person.
- That’s a consensus method.
What is the main risk of priced-to-win?
- It tends to be low.
- That isn’t the risk.
- It doesn’t.
- The slide names this risk.
Algorithmic Measures
Notes
These give you a number to feed into a formula. LOC and function points are the two to know, and note the slide’s honest point: most projects don’t use any of these.
Exam angle
Which are the most common algorithmic measures?
- Not on this slide.
- These are other possibilities.
- The slide says so.
- Those aren’t size measures.
Wideband Delphi
Notes
Starting independently stops one loud person from anchoring everybody. Each round shares reasoning without pressure, so hidden factors come out, and the group’s numbers move closer. This is the idea behind Wideband Delphi.
It’s useful when you have no past data, since it relies on people’s knowledge. But if everyone shares the same blind spot, they’ll happily agree on the wrong number.
Seen again Ch 5, slide 22: Delphi technique for risk identification
Exam angle
Wideband Delphi requires historical project data.
- It does not; it uses several experts.
Code-based Estimates
Notes
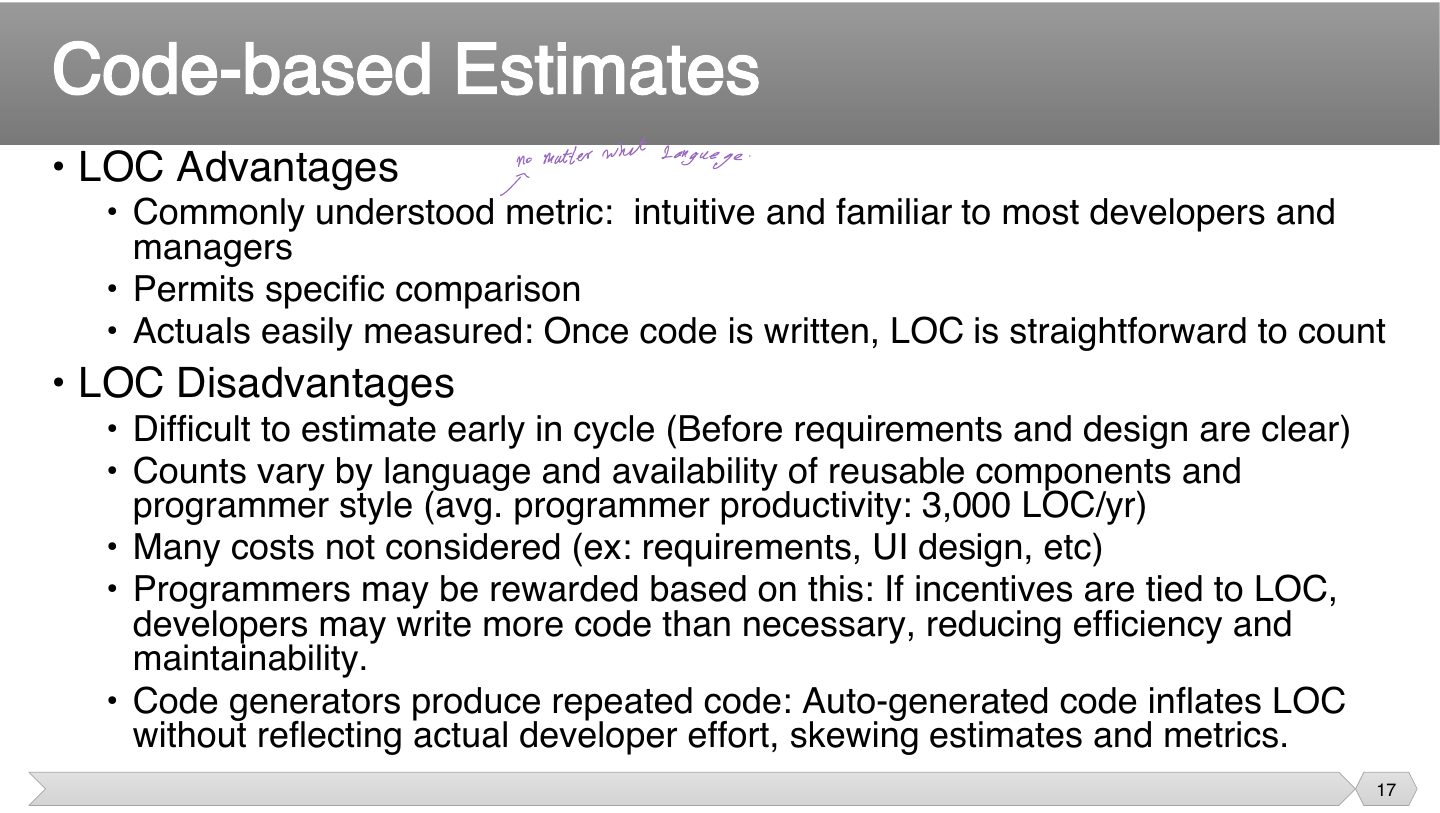
It’s easy to count finished code, but you can’t count code that doesn’t exist yet. And LOC rewards long code: 1,000 lines in one language may be 300 in another, so if people are paid by the line, you’ll get more lines.
Exam angle
Why is LOC hard to use for early estimates?
- It varies by language.
- Finished code is easy to count.
- That’s the first disadvantage.
- It does.
Developers are rewarded per line of code. What might happen?
- That’s the opposite.
- That’s the slide’s warning.
- That’s not related.
- It doesn’t help that.
Function Points
Notes
This measures what the software does for users, rather than how it’s written. So it can be estimated earlier and compared across languages, which is the main advantage of function points over LOC.
Exam angle
How do function points measure size?
- That’s team size.
- That’s effort.
- That’s the definition.
- That’s LOC.
Function Point Process
Notes
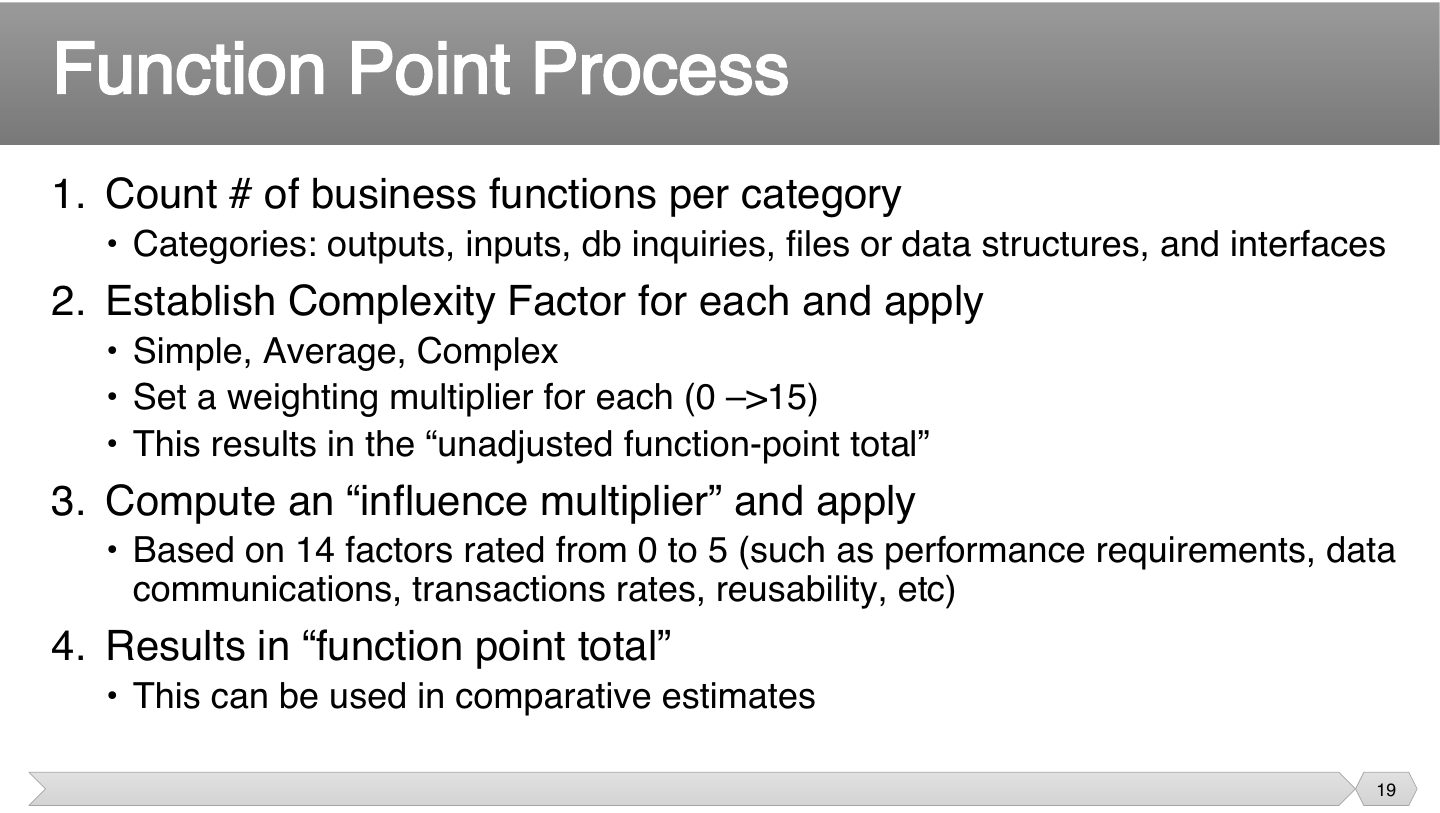
First you count what the system does, then weight each thing for how hard it is. Then you adjust for the overall situation, such as performance demands. Order matters: count → weight → adjust.
Exam angle
How many influence factors adjust the function point count?
Effort Estimation
Notes
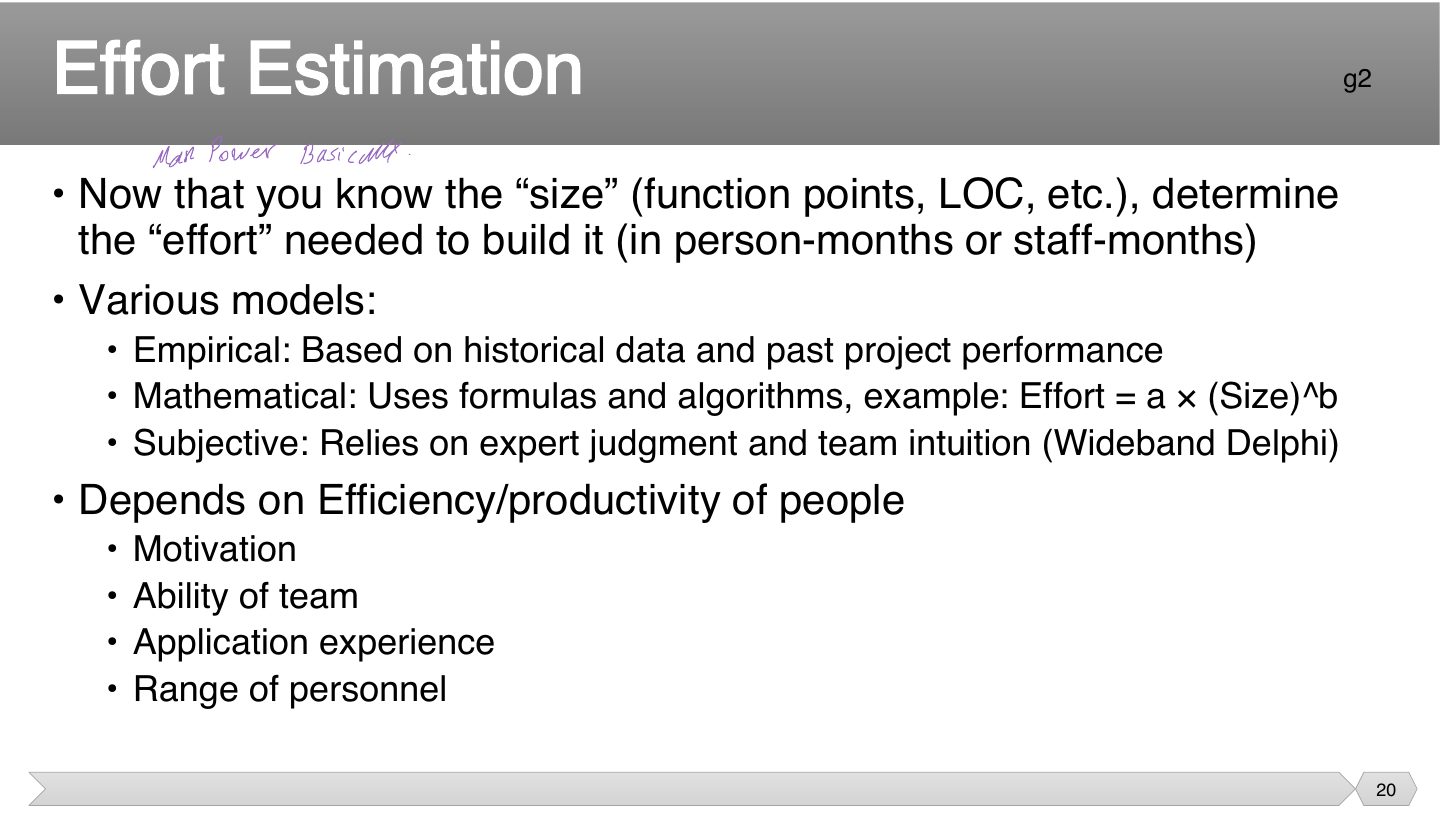
Size tells you how big it is, and effort tells you how much work that means. A skilled, motivated team needs less effort for the same size, which is why people factors are part of this conversion.
Exam angle
Which model estimates effort from past project data?
- That relies on expert judgment.
- That uses formulas.
- That isn’t on the slide.
- It’s based on historical data.
Duration
Notes
Effort is how much work there is, and duration is how long it takes on the calendar. Five people working one day is 5 person-days of effort but only one day of duration.
Trap Effort ≠ duration. Adding people can shorten duration but not effort.
Exam angle
Five people review a document for 10 hours. Effort and duration are:
Duration
Notes
Nobody works on a task for all eight hours of a day, with meetings and interruptions. So 40 hours of labor doesn’t mean one week, and treating labor time as clock time makes every schedule too short.
Exam angle
A task needs 40 hours of labor, and productivity is about 75%. How long will it take on the clock?
- That’s the wrong direction.
- That’s not possible.
- People aren’t productive for every hour of the day.
- That ignores productivity.
Causes of Variation
Notes
An estimate assumes an average person on a normal day, and real days aren’t like that. Each cause is a way reality differs from that assumption, so variation is normal, not a failure.
Tips & tricks
- The causes, in slide order: Very Unlucky Estimators Miss. Varying skill levels, Unexpected events, Efficiency of work time, Mistakes and misunderstandings.
Exam angle
Which is a cause of variation in duration?
- That’s unrelated.
- That’s the assumption, not the cause.
- That isn’t named.
- It’s on the slide’s list.
Estimation Issues
Notes
You need accurate numbers at the start, and you only get them at the end. Recording actual results helps because they make your next estimate better. That’s why past experience is the best basis.
Exam angle
Precise estimation data only arrives at the end. Why record it anyway?
- The best estimates come from past experience.
- The charter is written at the start.
- It’s very useful later.
- It’s too late for that.
Over and Under Estimation
Notes
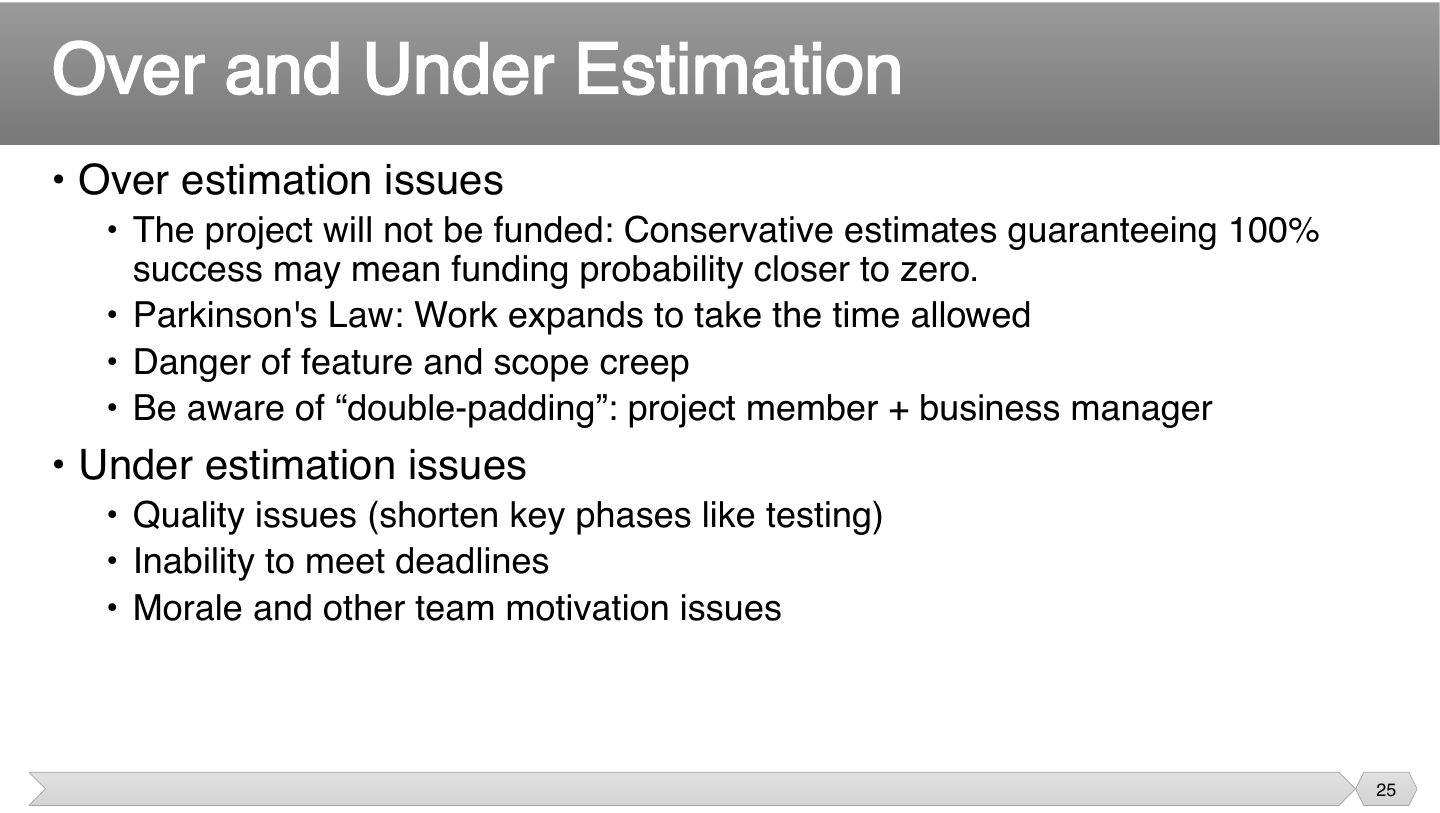
Both directions hurt. Too high and it won’t get funded, and any spare time gets filled anyway (Parkinson’s law). Too low and people cut corners, usually testing, and morale falls when dates keep slipping.
Exam angle
“Work expands to fill the time available” is:
Introduction: Activity Resource Estimation
Notes
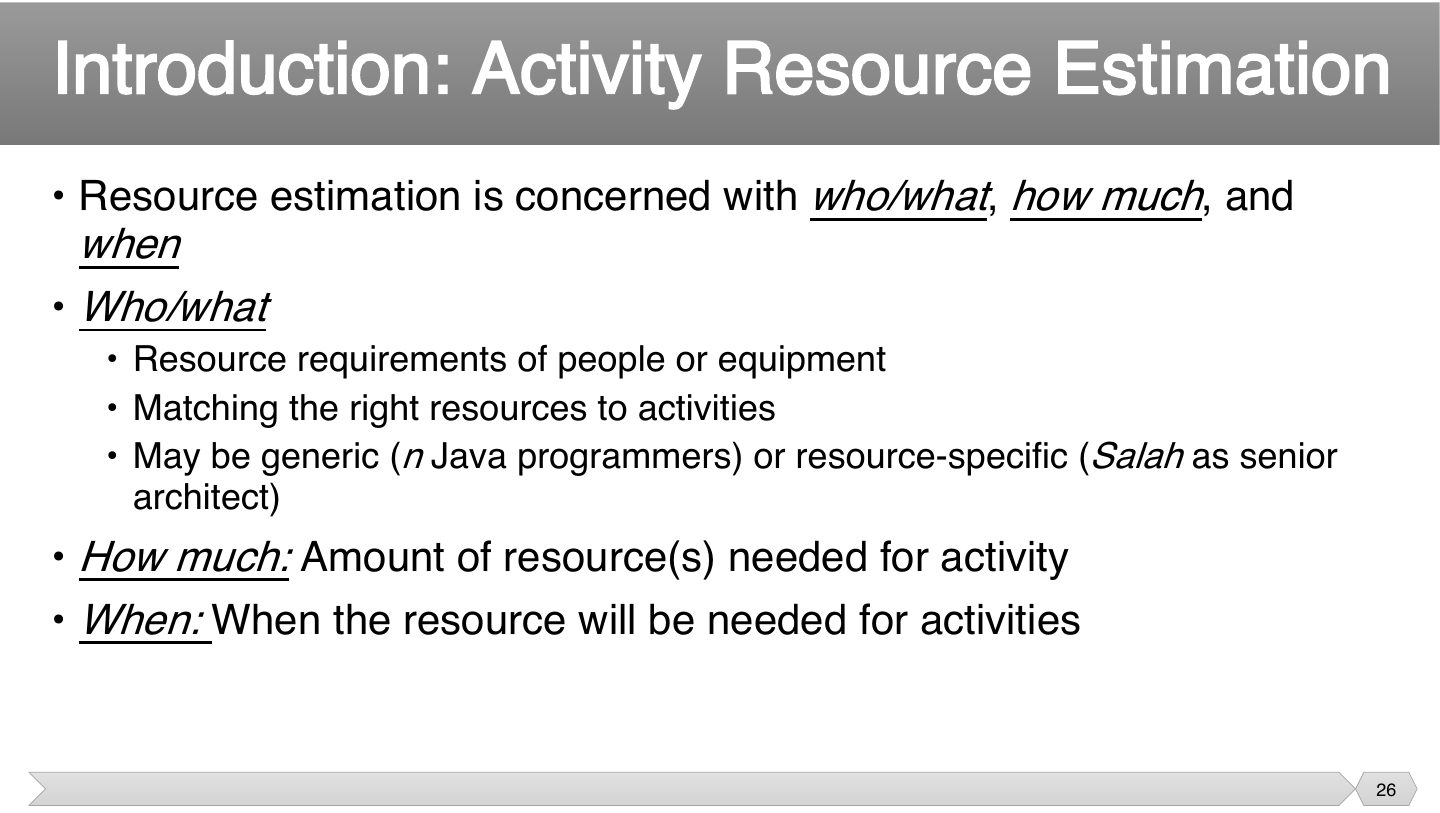
You need more than a headcount. A task may require one specific expert in March, not “a developer” sometime, so asking who, how much and when catches clashes before they happen.
Exam angle
Related question: Q2.3 · allocating resources across tasks
Related question: Q2.2 · resourcing the project
Controlling factors in resource estimation
Notes
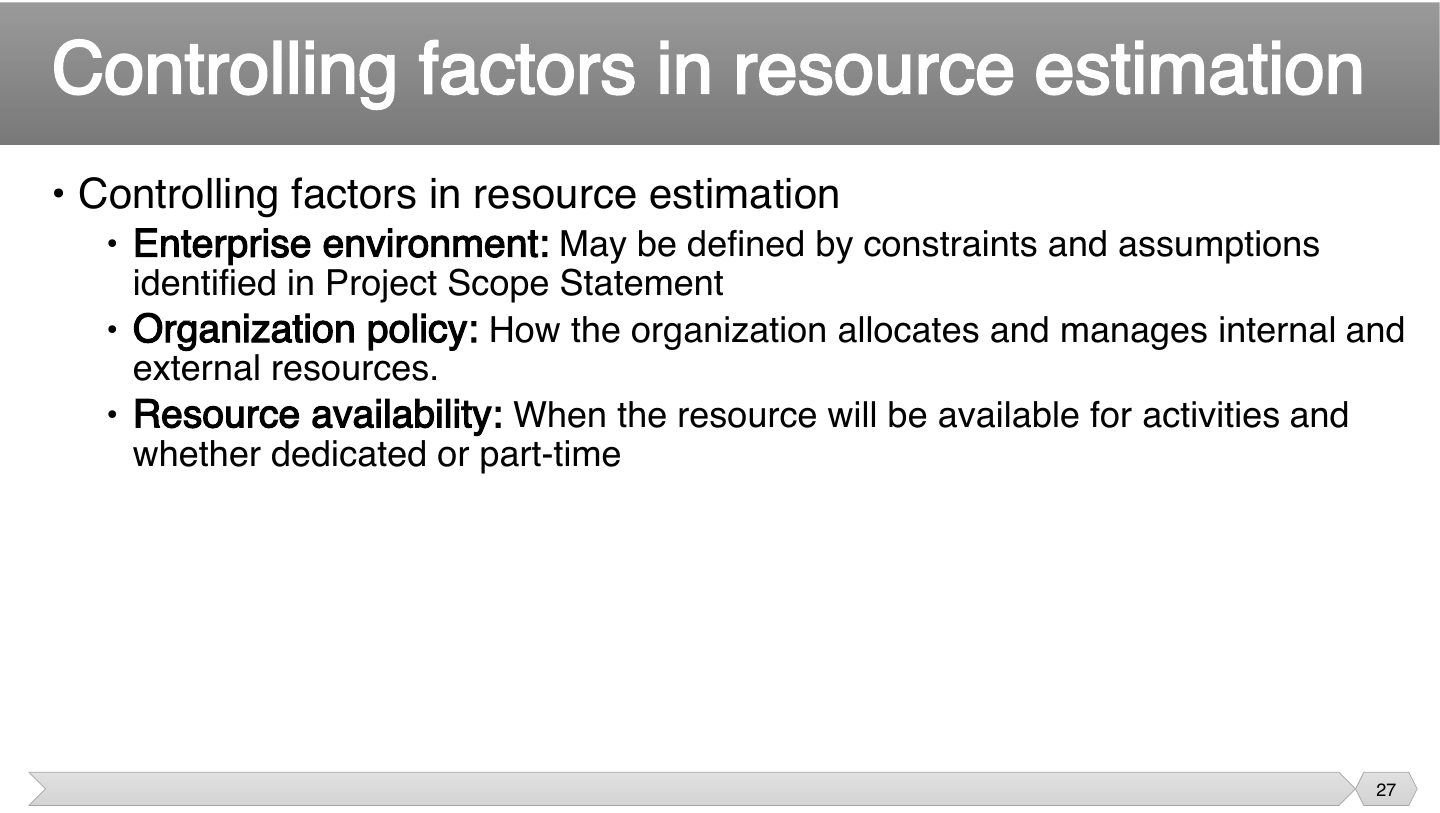
You may want three experts, but you can only plan with what’s really available. These three things limit your options, so a good estimate reflects availability, not just what the task ideally needs.
Tips & tricks
- ORE: Organization policy, Resource availability, Enterprise environment.
Exam angle
Which is a controlling factor in resource estimation?
- It’s on the slide.
- That’s not it.
- That’s not it.
- That’s not it.
Estimating tools
Notes
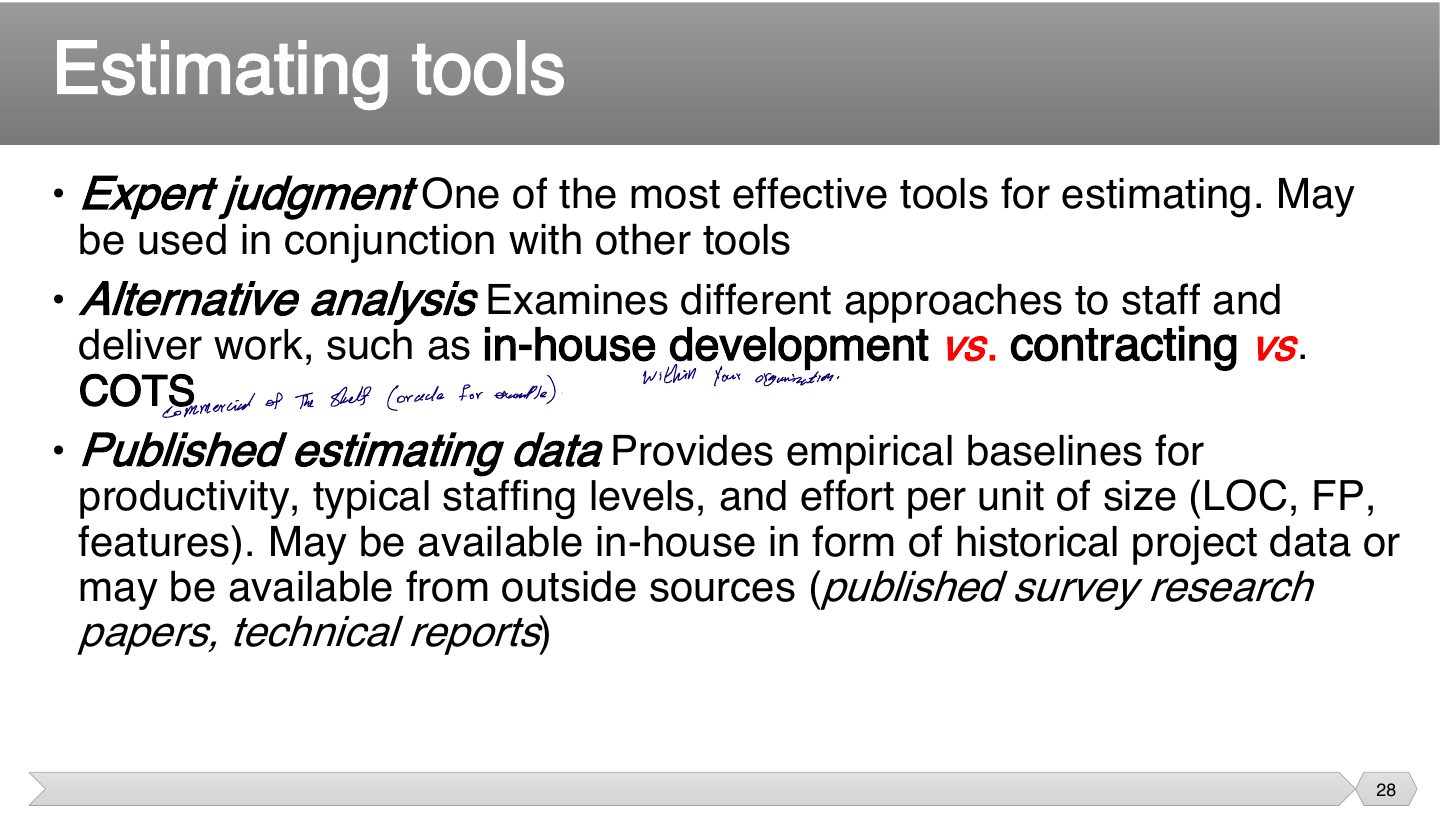
Different tools answer different questions. Alternatives analysis asks whether to build, buy or hire, and each choice leads to a different resource estimate.
Exam angle
A team compares in-house development, contracting and COTS. Which tool is this?
- That gives an empirical baseline.
- It examines different ways to staff and deliver.
- That tracks progress.
- That asks an experienced person.
Activity Resource Estimation Output
Notes
These add up from activity to work package, to give a total. The resource calendar matters because a person on holiday in week 3 can’t do week 3’s work, even though the numbers add up.
Exam angle
What does a resource calendar document?
- That’s not it.
- That’s the register.
- It includes resource-specific holidays.
- That’s not it.
Introduction: Activity Duration Estimation
Notes
Those closest to the work know how long it really takes, so ask them. As you learn more, estimates improve, which is why they’re progressively elaborated, rather than fixed at the start.
Exam angle
Who should provide duration estimates?
- They don’t do the work.
- They don’t do the work.
- They know how long it takes.
- They know the least.
Controlling factors in duration estimation
Notes
More people can lower productivity (Mythical Man-Month, Chapter 6.2).
Seen again Ch 6.2, slide 56: Mythical man-month
Exam angle
Why might adding people not shorten a task proportionally?
- That’s the quantity and productivity trade-off.
- They do.
- They do.
- Not stated.
A useful rule of thumb
Notes
Mixing hours and days causes silly mistakes, like adding 2 days and 3 hours as 5. One unit throughout avoids this, and you convert only for the final presentation.
Exam angle
What’s the rule of thumb for time units?
- That’s too coarse.
- Don’t mix increments.
- That’s what to avoid.
- Units matter.
Estimating tools
Notes
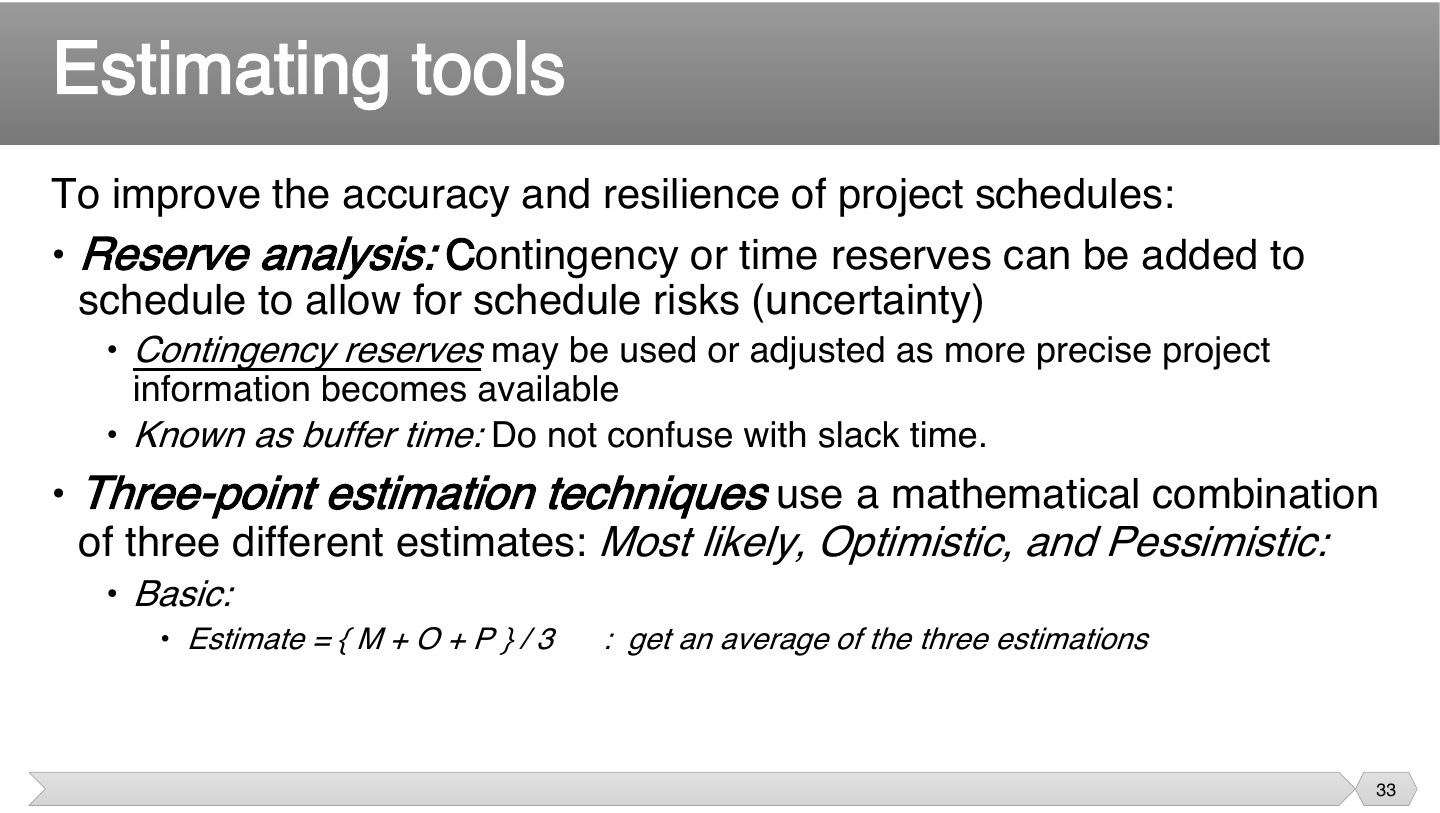
A buffer is time you added on purpose because something may go wrong. Slack is spare time that just happens to exist on a task not on the critical path. So one is planned protection, and the other results from the network.
One single number hides how uncertain you are. Taking three and averaging builds in that range. This simple version treats all three equally.
Seen again Ch 6.2, slide 34: Slack time
Exam angle
What’s the difference between buffer time and slack?
- Don’t confuse them.
- The slide warns against this.
- That’s buffer.
- It’s schedule time.
Three Point Estimating
Notes
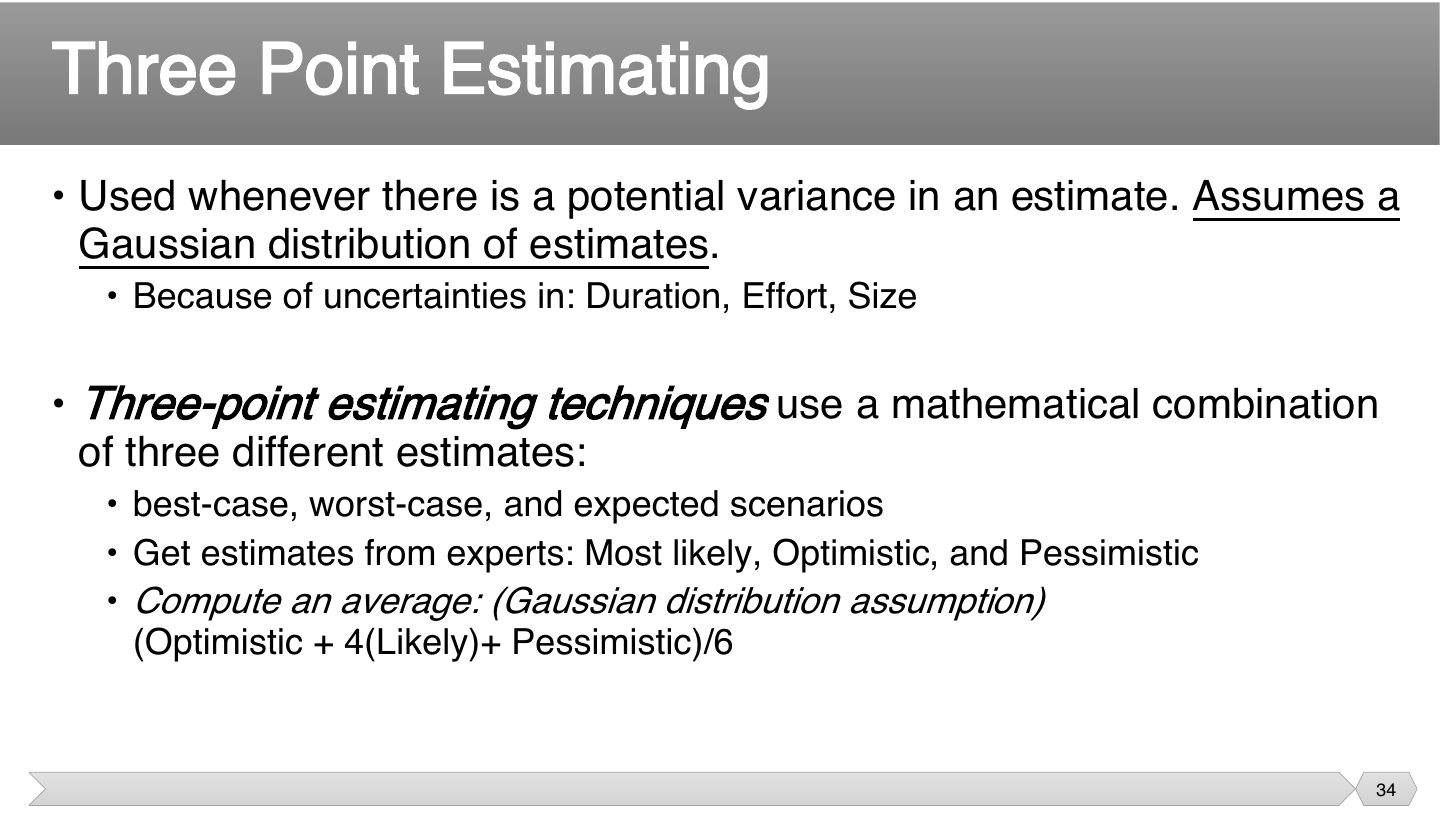
PERT/beta formula: (O + 4M + P) / 6 weights the most likely value 4×.
Memory trick One, four, one, over six.
Tips & tricks
- MOP: Most likely, Optimistic, Pessimistic.
Exam angle
O = 4 days, M = 6 days, P = 14 days. PERT estimate?
- (4 + 24 + 14) / 6 = 42/6 = 7.
O = 2, M = 5, P = 8. Basic (simple average) three-point estimate?
- (2+5+8)/3 = 5.
Example: Three Point Estimation of LOC
Notes
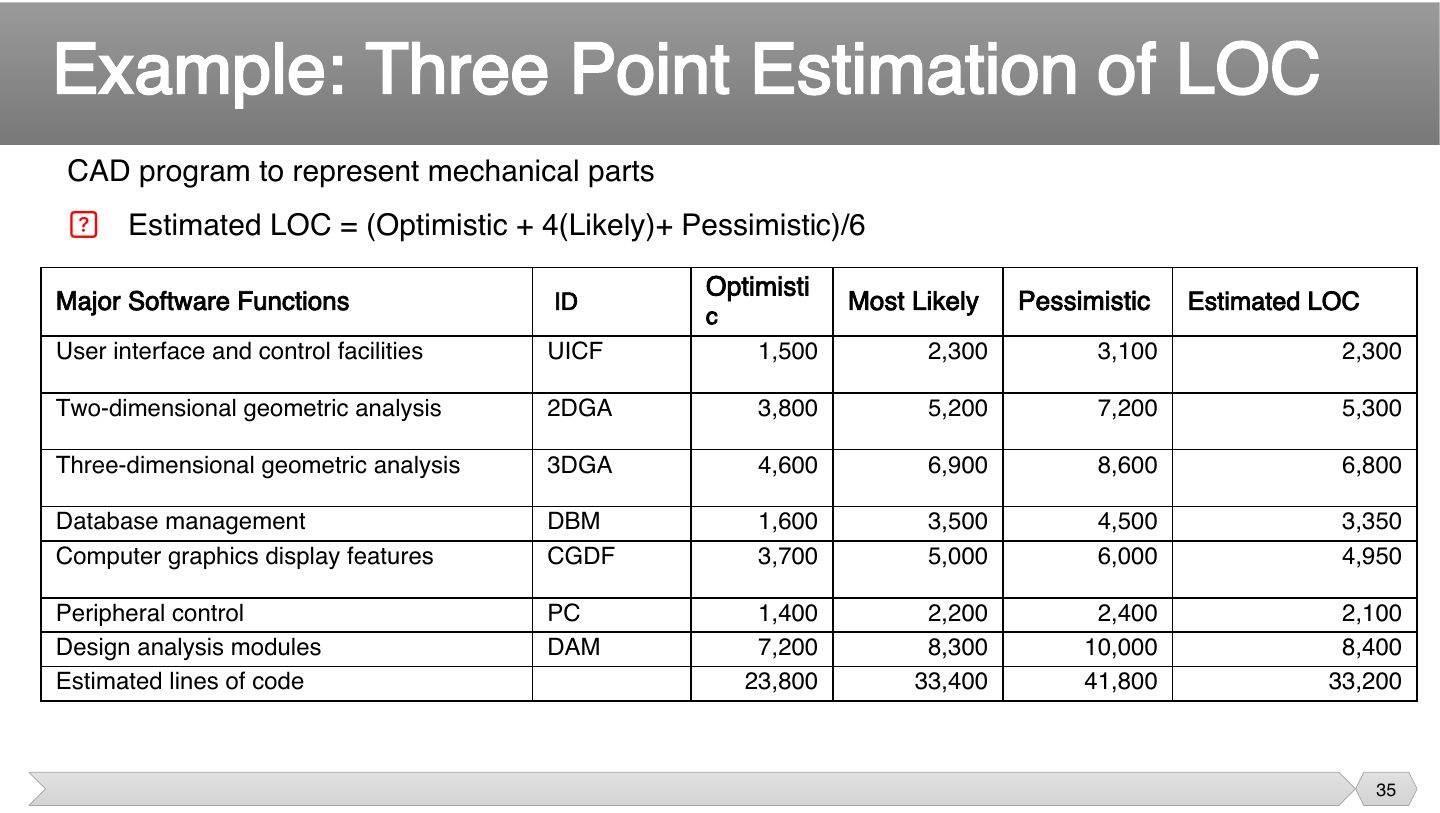
It’s just the formula applied to each function, then added up. Weighting the most likely value by 4 means one extreme guess can’t pull the answer too far. Check one row yourself to practice.
Exam angle
Optimistic 1,500, most likely 2,300 and pessimistic 3,100 LOC. What’s the estimate?
- That doesn’t follow the formula.
- That’s the simple sum.
- (1,500 + 4×2,300 + 3,100) ÷ 6 = 2,300.
- That’s only the pessimistic value.
Example: Three Point Estimation using Function Points
Notes
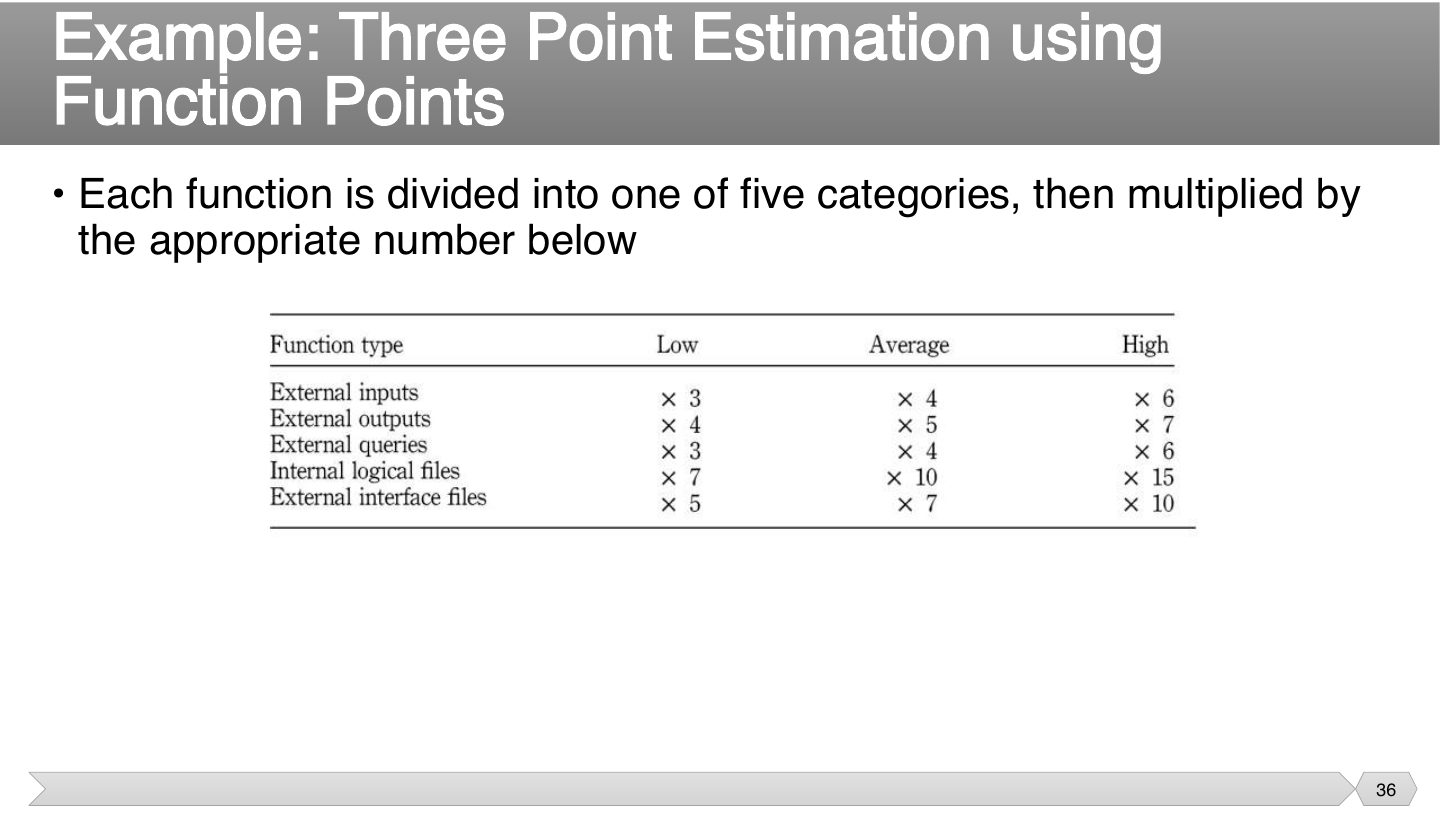
Weights (low/average/high): inputs 3/4/6, outputs 4/5/7, queries 3/4/6, internal files 7/10/15, external interfaces 5/7/10.
Exam angle
Which function category has the highest weights in the table?
- 4, 5, 7 is lower.
- 3, 4, 6 is lower.
- 7, 10, 15 is the highest.
- 3, 4, 6 is lower.
COCOMO
COnstructive COst Model (COCOMO)
Notes
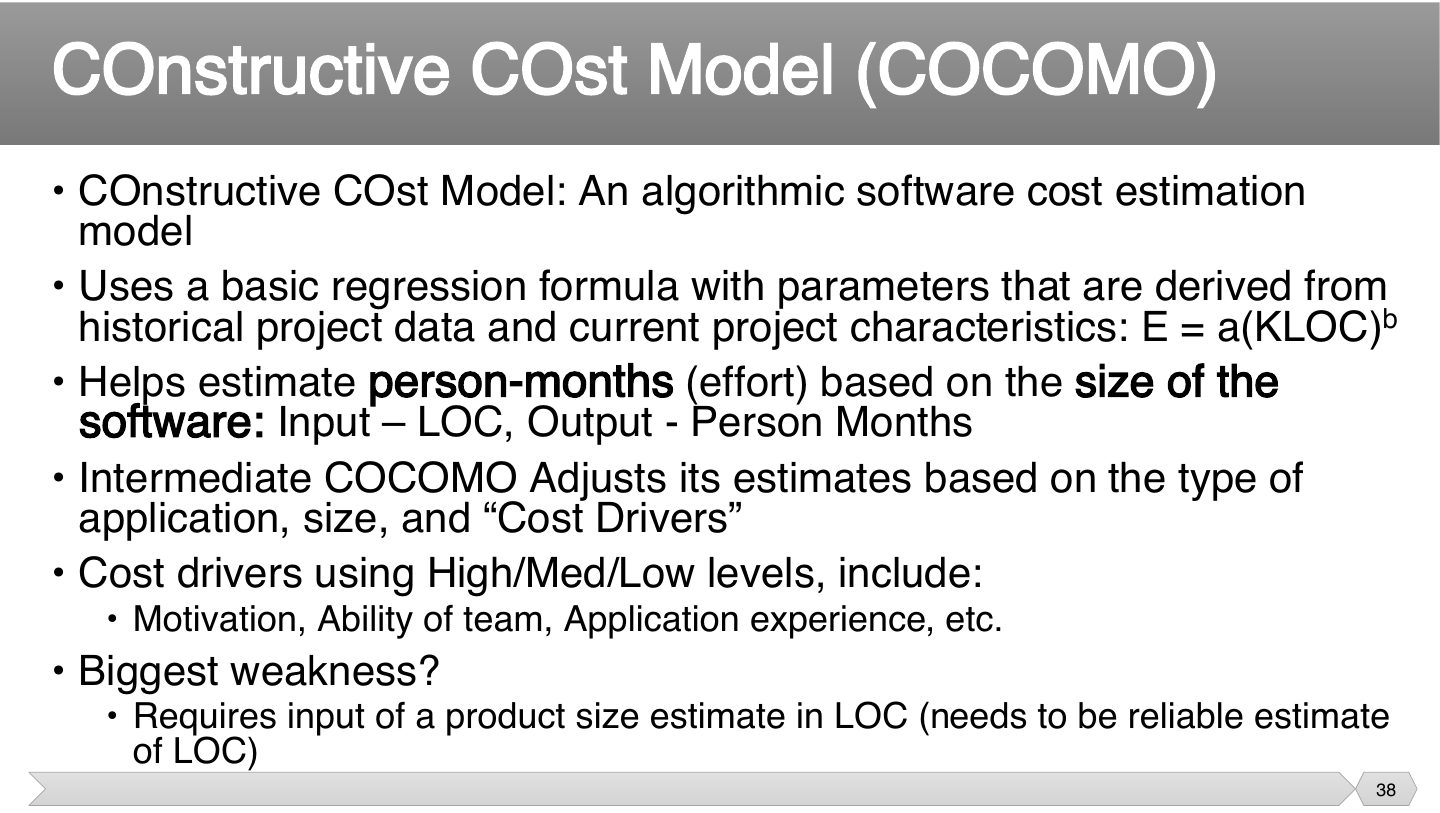
It’s a formula built from data on many past projects, and that’s its strength. You give it a size and it gives you effort, so it’s only as reliable as that size estimate.
Here’s the catch: you need to know the size early, which is exactly when you know least. So a confident-looking result can rest on a weak guess.
Exam angle
The biggest weakness of COCOMO is that it:
Basic COCOMO – More Constants
Notes
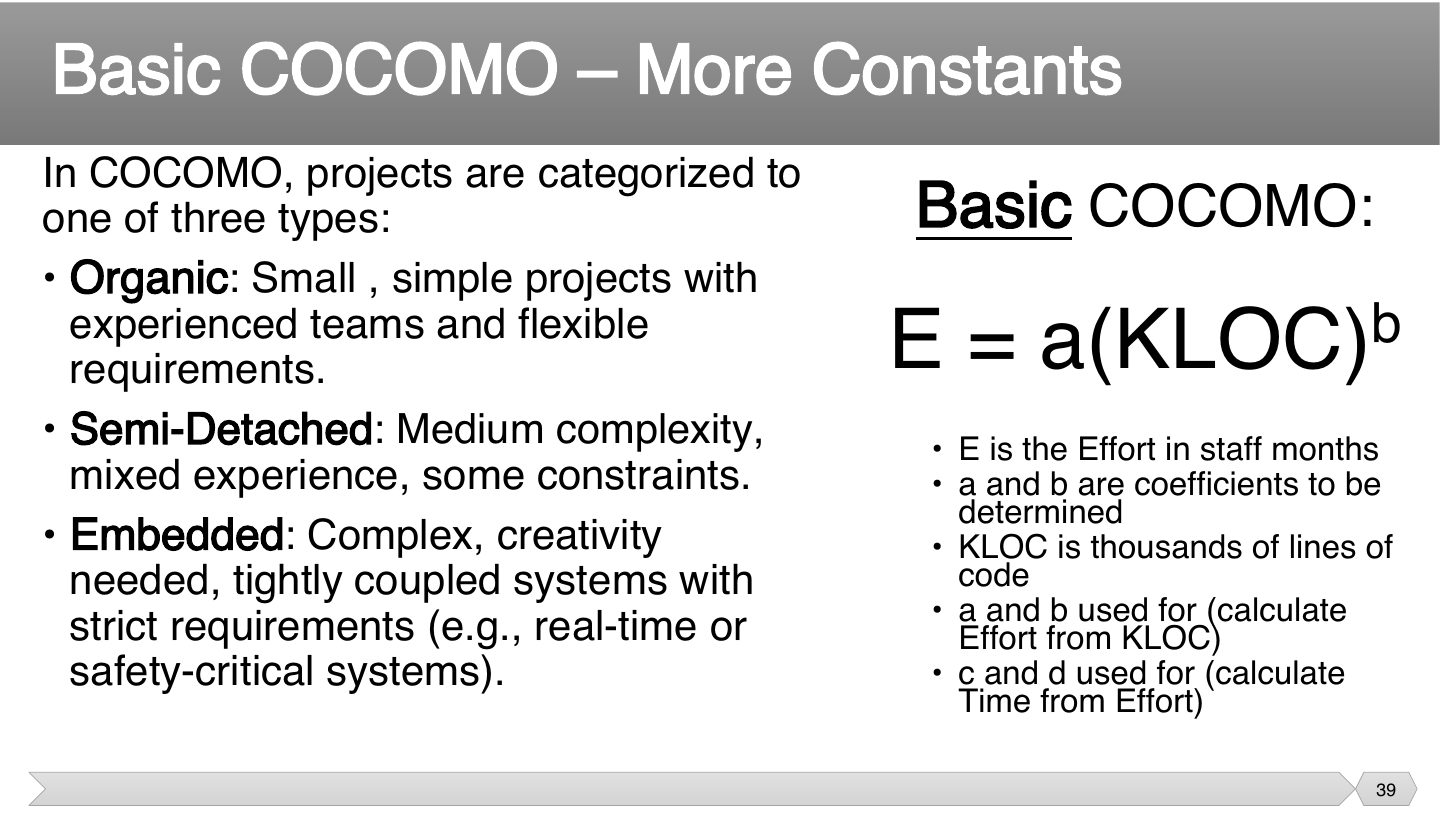
The exponent b is above 1, which is the important part: doubling the code more than doubles the effort, as bigger projects carry more coordination.
Don’t mix these up in an exam: a, b give effort, and c, d give time.
Exam angle
Q2.4 · COCOMO organic, 32 KLOC: effort, time, staff
Q2.5 · COCOMO organic, 20 KLOC: effort, time, productivity, staff
Basic COCOMO – The Modes
Notes
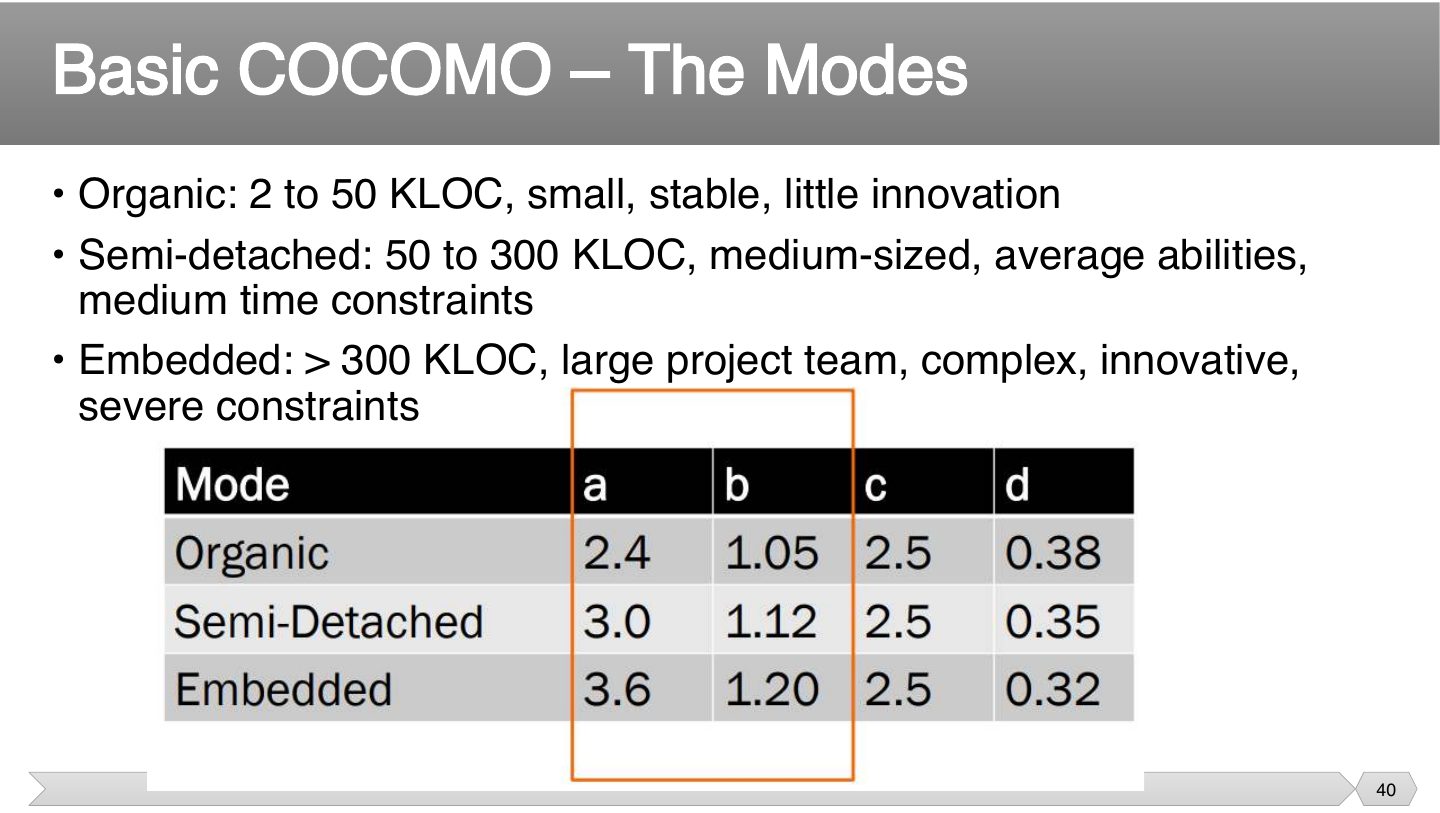
Remember size isn’t the only thing that decides. A small project with severe constraints may still be embedded, because it’s the difficulty that drives effort.
Note c = 2.5 for all three modes.
Memory trick a goes 2.4 → 3.0 → 3.6 (+0.6 each). d goes 0.38 → 0.35 → 0.32 (−0.03 each). c is always 2.5.
Tips & tricks
- hOSE, from small to large: Organic, Semi-detached, Embedded.
Exam angle
Which COCOMO mode has a = 3.0 and b = 1.12?
In Basic COCOMO, c = 2.5 for all three modes.
Basic COCOMO – Example
Notes
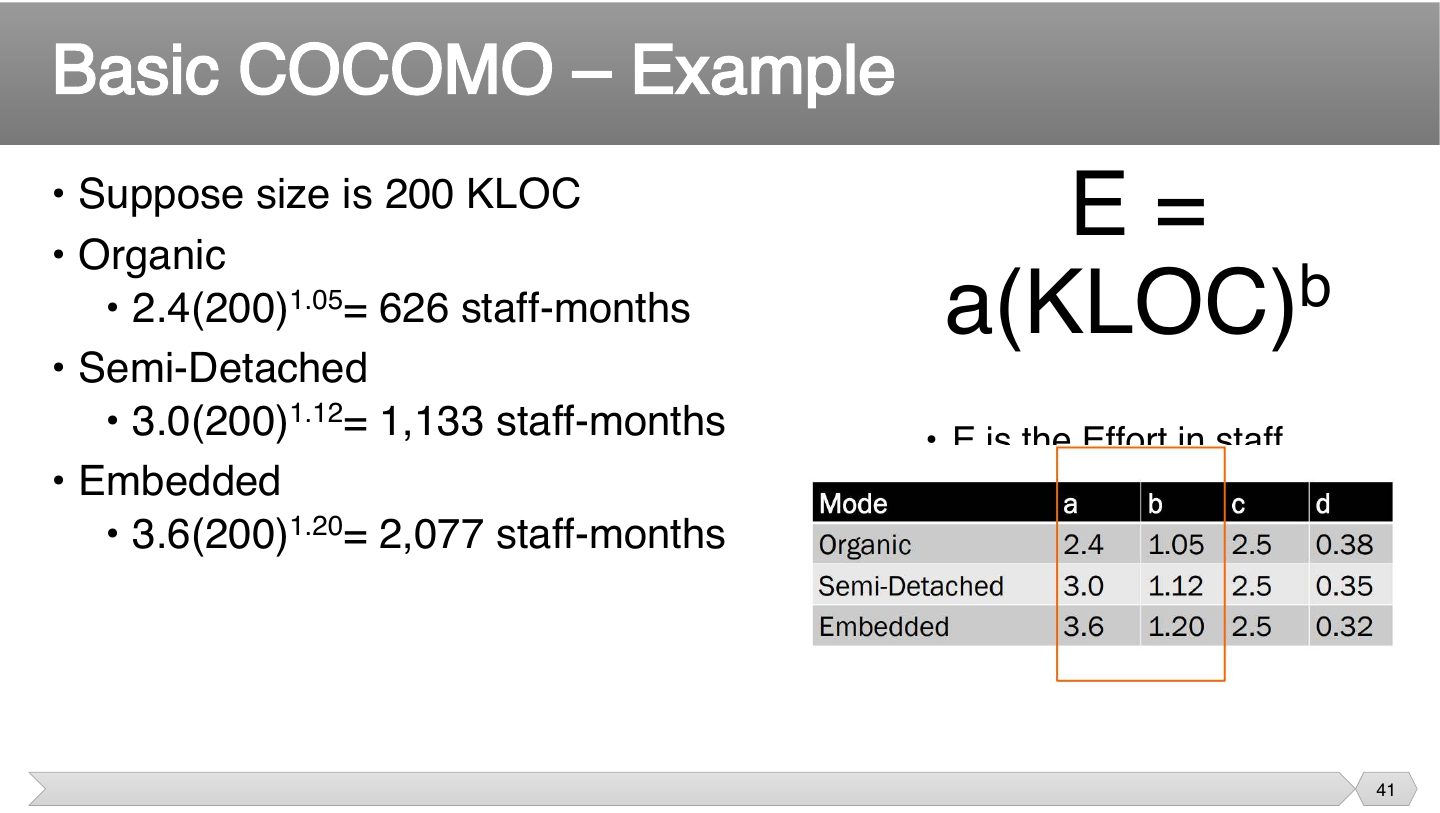
Same amount of code and more than three times the effort. That’s what difficulty does, so picking the right mode matters as much as the size.
Exam angle
For the same 200 KLOC, which mode needs the most effort?
- They differ greatly.
- That’s in between.
- That needs the least.
- 2,077 staff-months against 626 for organic.
Basic COCOMO – Development Time
Notes
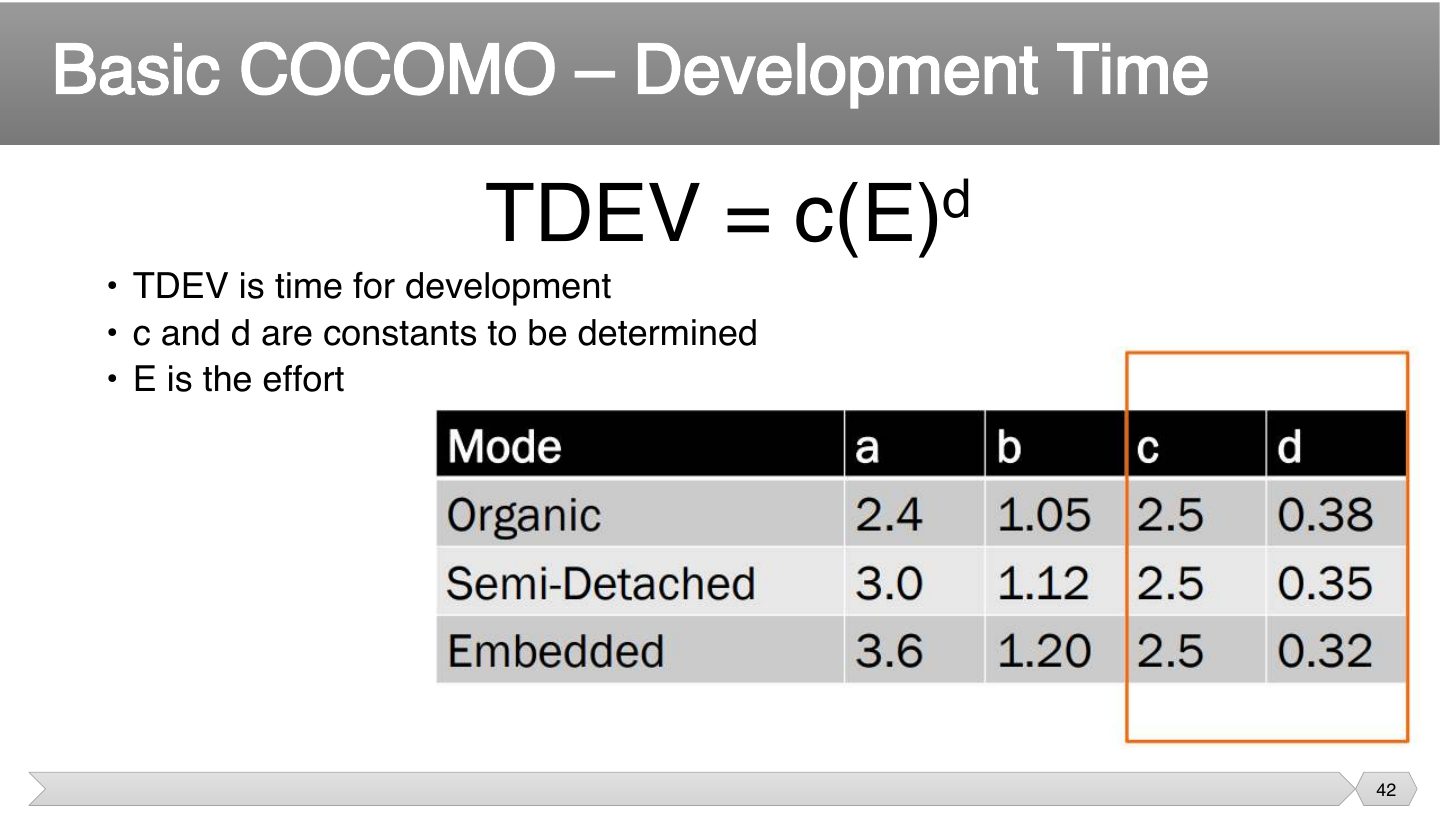
Time TDEV = c × E^d (months). Uses E, not KLOC.
Trap TDEV uses EFFORT (E) as input, not KLOC.
Exam angle
What’s the input to the TDEV formula?
- TDEV = c(E)^d.
- That’s not it.
- KLOC feeds effort, not TDEV directly.
- That’s not it.
Basic COCOMO – Example
Notes
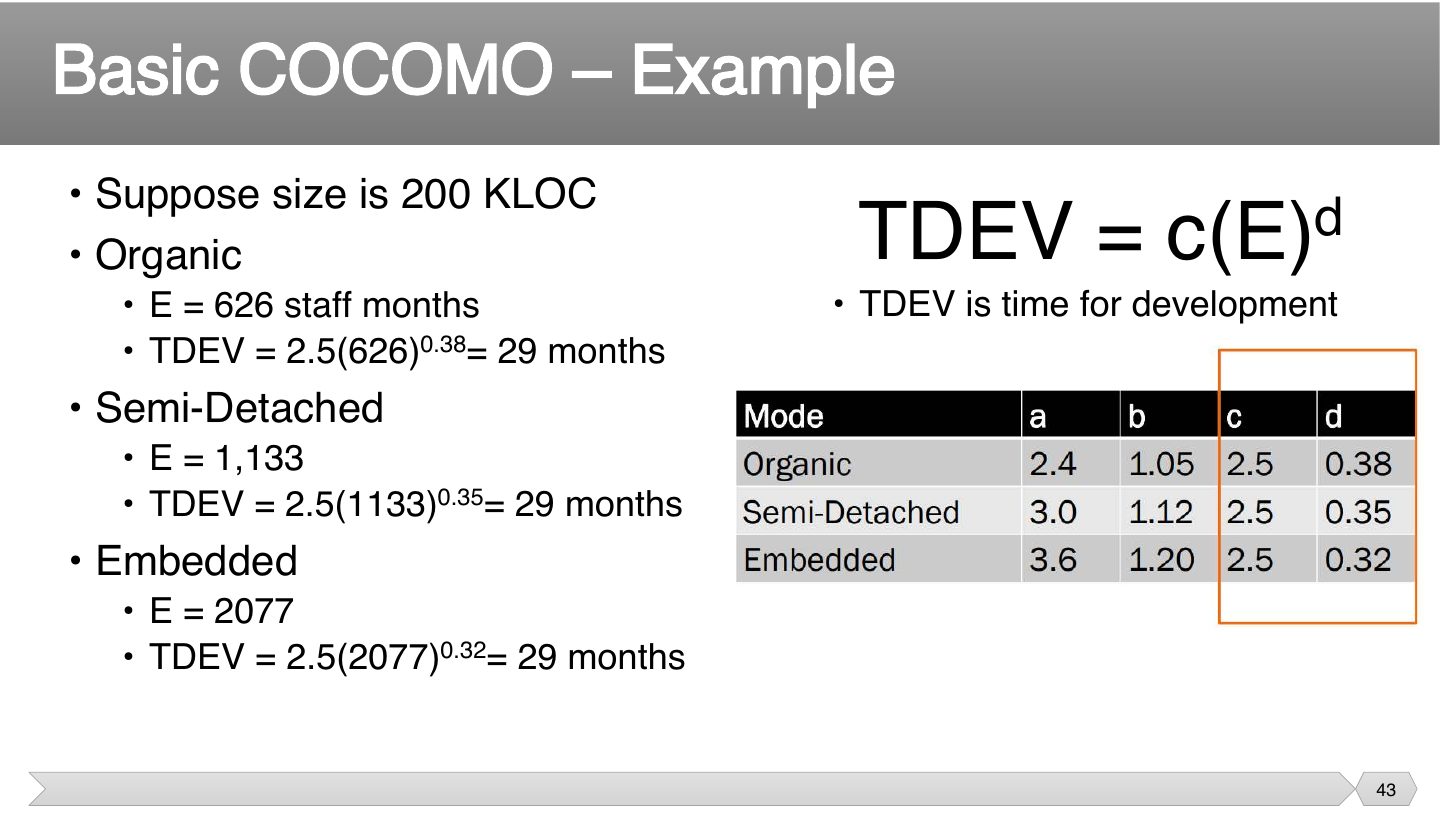
Interesting: all three give ~29 months. Harder projects need more PEOPLE, not more time.
Exam angle
The three modes all give about 29 months. What does this suggest?
- Effort differs greatly.
- It doesn’t.
- That’s what the calculation gives.
- Effort differs while time barely does.
Basic COCOMO – Average Staff Size
Notes
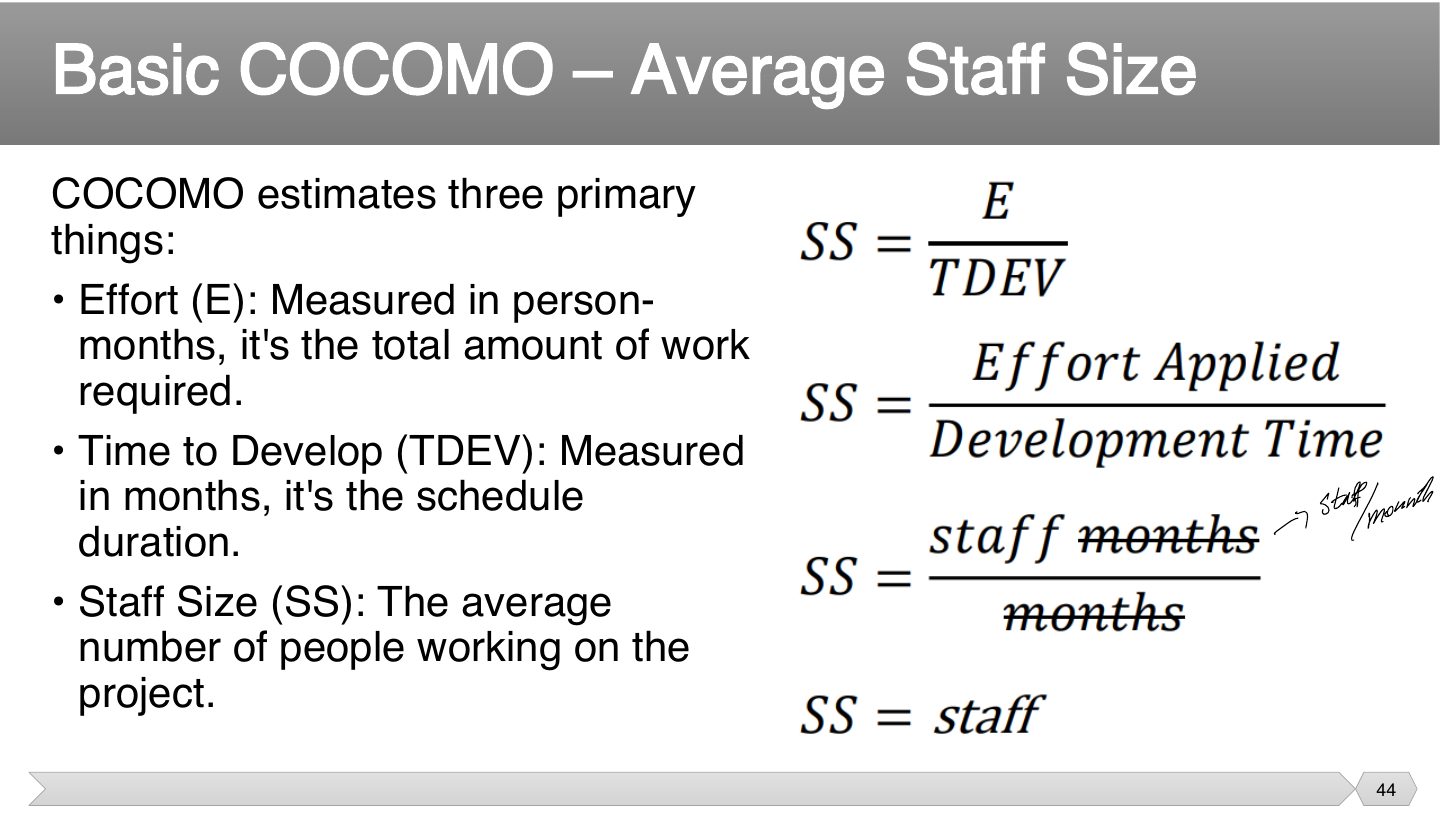
Total work divided by time gives how many people you need on average. It’s a check on your plan: if it says 23 people and you have 5, the schedule isn’t realistic.
Exam angle
E = 20 staff-months and TDEV = 8 months. How many staff on average?
- SS = E / TDEV.
- That adds them.
- That divides the wrong way.
- That multiplies instead.
Basic COCOMO – Productivity
Notes
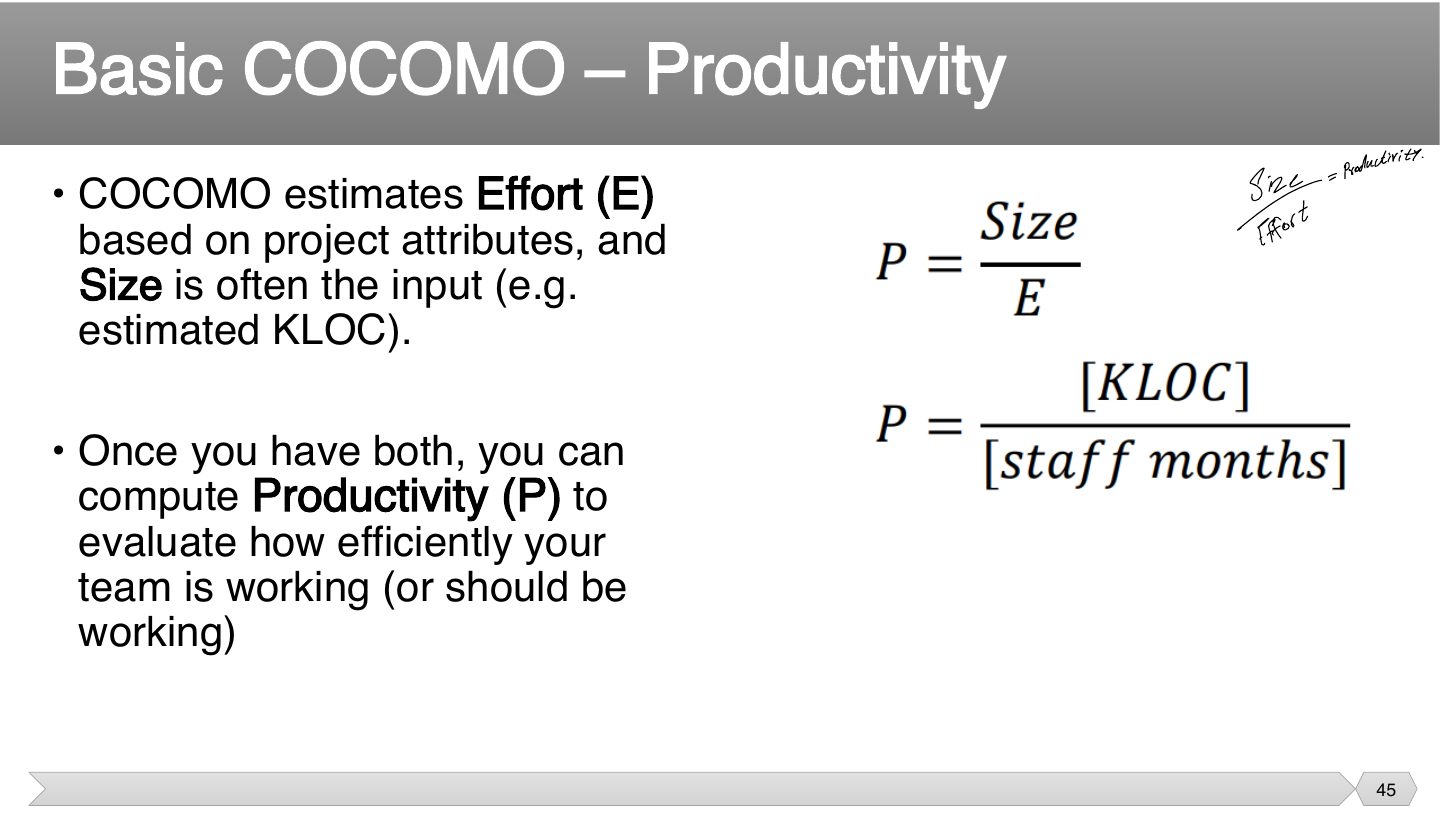
This tells you how much output to expect per person. Use it to sanity-check, since if the required rate is far above your team’s normal rate, something in the estimate is wrong.
Exam angle
How is productivity calculated?
- That’s effort.
- P = LOC / E.
- That’s the inverse.
- That’s not it.
COCOMO Complete Example - Organic
Notes
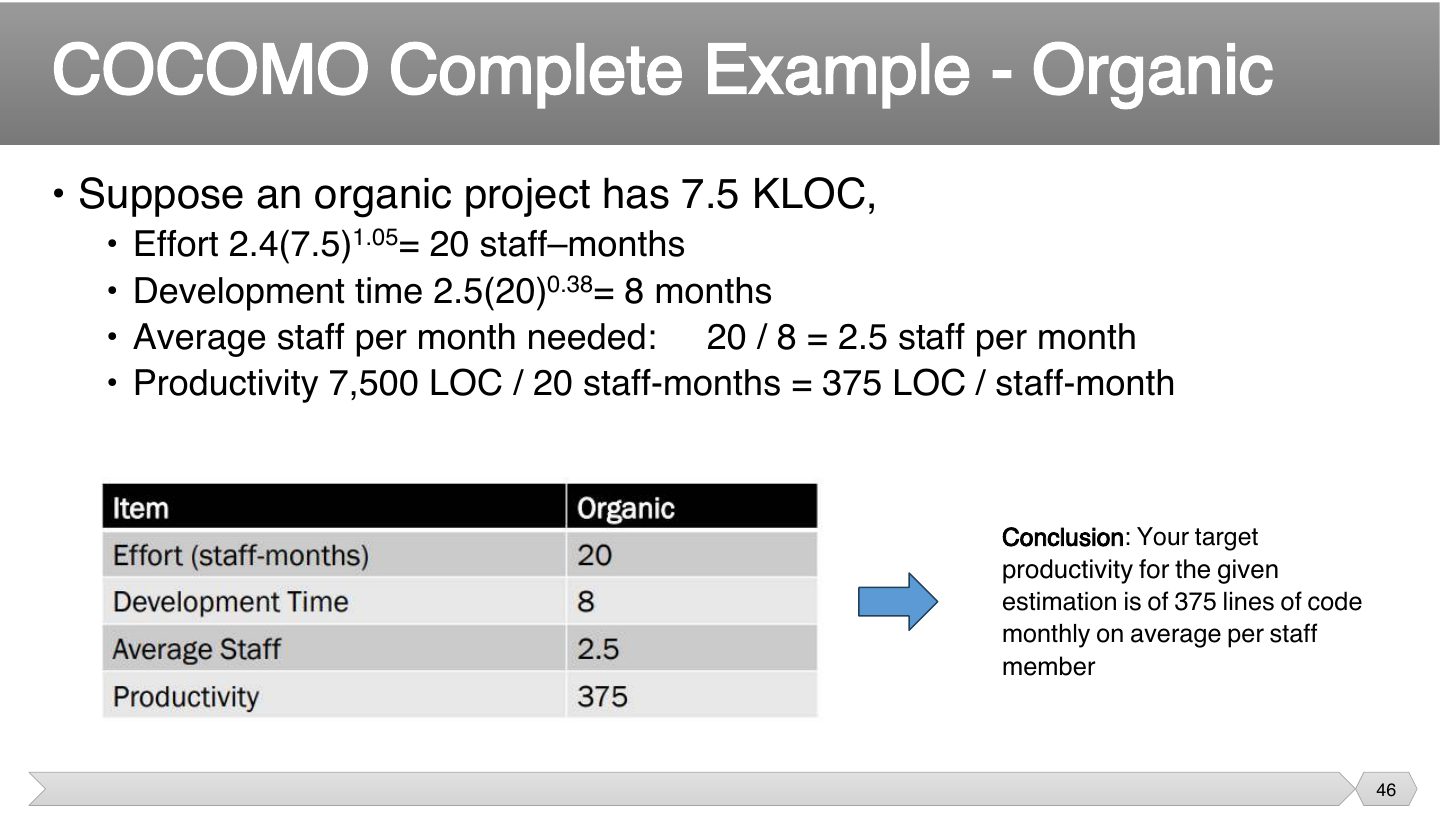
The full recipe: E → TDEV → SS = E/TDEV → P = LOC/E. Exactly what both finals asked.
Tip Show every step with the formula, keep 1 decimal, and give units (person-months, months, people, LOC/PM). Partial marks are per step.
Exam angle
Q2.4 · COCOMO organic, 32 KLOC: effort, time, staff
Q2.5 · COCOMO organic, 20 KLOC: effort, time, productivity, staff
COCOMO organic, 32 KLOC (a=2.4, b=1.05, c=2.5, d=0.38). Compute effort, development time and average staff (Final 242).
Compare with the model answer
E = 2.4 × 32^1.05 ≈ 2.4 × 38.06 ≈ 91.3 person-months. TDEV = 2.5 × 91.3^0.38 ≈ 2.5 × 5.56 ≈ 13.9 months. Average staff = E / TDEV ≈ 91.3 / 13.9 ≈ 6.6 people (about 7).
COCOMO organic, 20 KLOC. Compute effort, development time, productivity and staff (Final 251).
Compare with the model answer
E = 2.4 × 20^1.05 ≈ 2.4 × 23.2 ≈ 55.8 person-months. TDEV = 2.5 × 55.8^0.38 ≈ 2.5 × 4.61 ≈ 11.5 months. Productivity = 20,000 LOC / 55.8 PM ≈ 359 LOC per person-month. Staff = 55.8 / 11.5 ≈ 4.8 people (about 5).
COCOMO Complete Example - Embedded
Notes
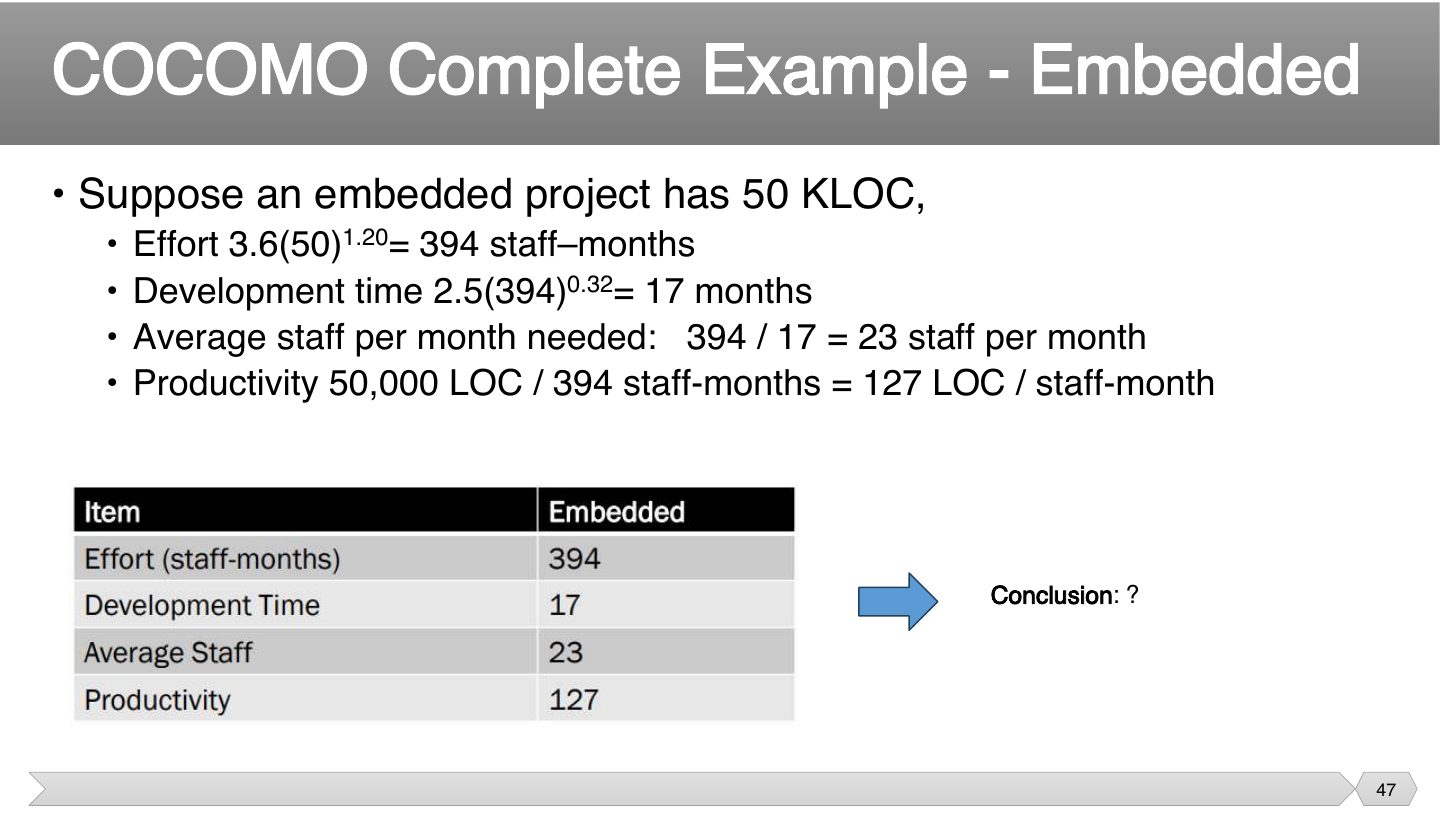
Answer to “Conclusion ?”: an embedded project needs far more effort per line, so expected productivity is only ~127 LOC per person-month (vs 375 organic).
Exam angle
An organic project is estimated at E = 40 PM and TDEV = 10 months. Average staff?
- SS = E / TDEV.
Intermediate COCOMO – Cost Drivers
Notes
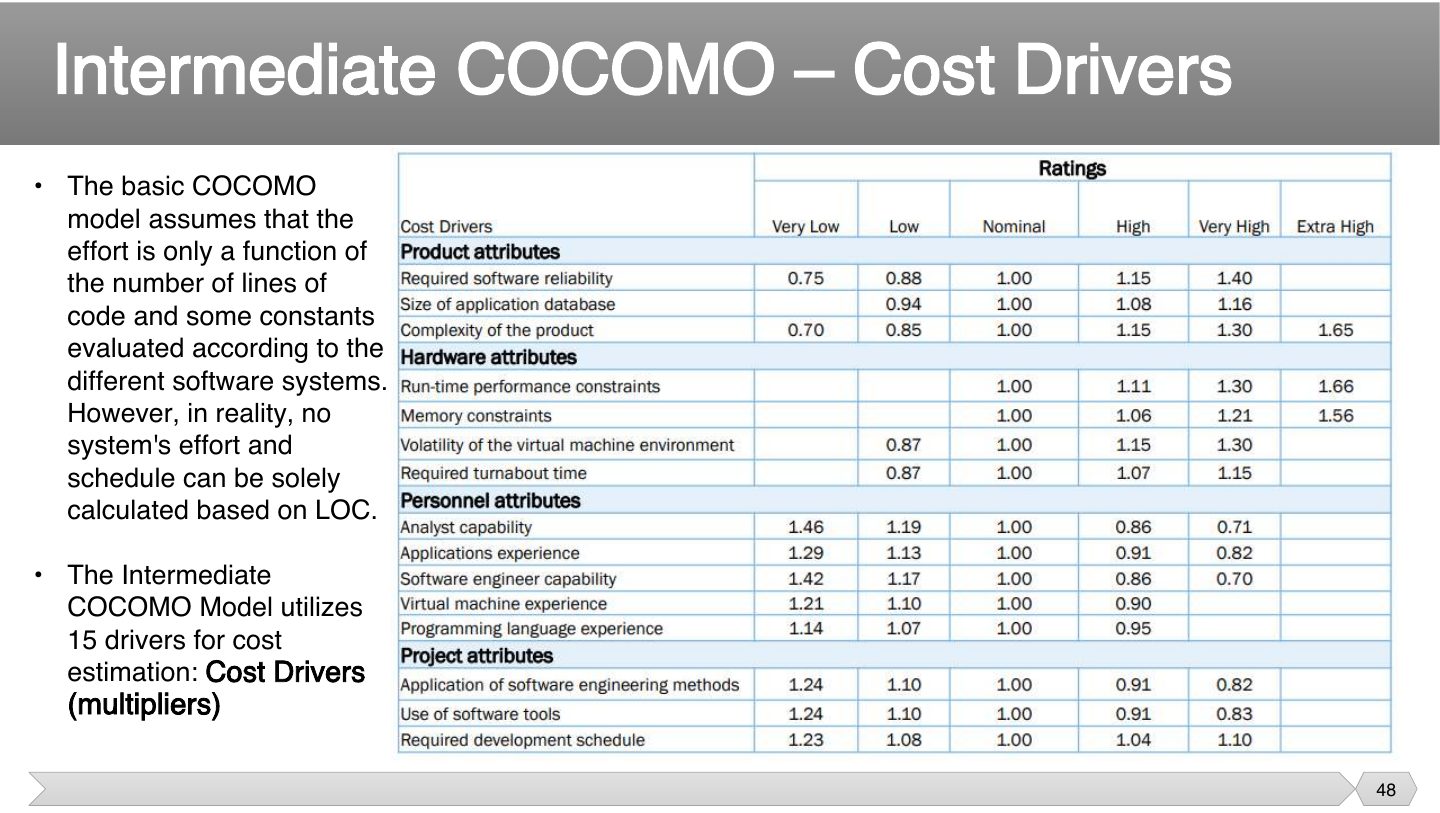
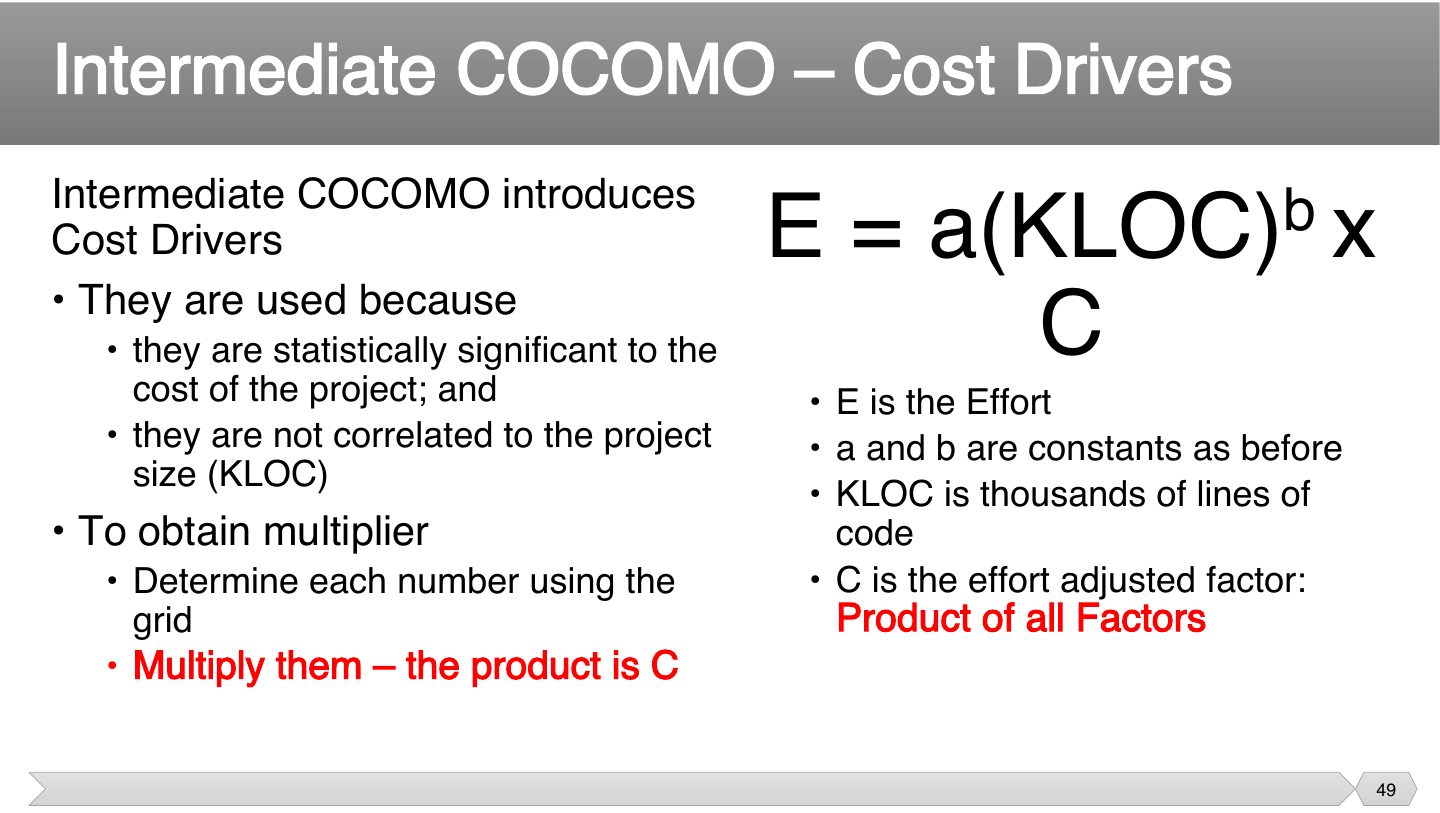
Basic COCOMO only looks at size, yet a strong team on a familiar platform needs less effort. Cost drivers add these real-world factors, making the estimate more realistic.
Exam angle
Why add cost drivers to COCOMO?
- Size is still used.
- It’s meant to be more realistic.
- Effort is still the output.
- Intermediate COCOMO includes other factors.
Intermediate COCOMO – Cost Drivers
Notes
Each driver is a multiplier: above 1 adds effort, below 1 reduces it. Multiply them together to get C, then scale the basic effort by it.
Exam angle
In Intermediate COCOMO the cost-driver multipliers are added together.
- They are multiplied; the product is C.
COCOMO Advantages
Notes
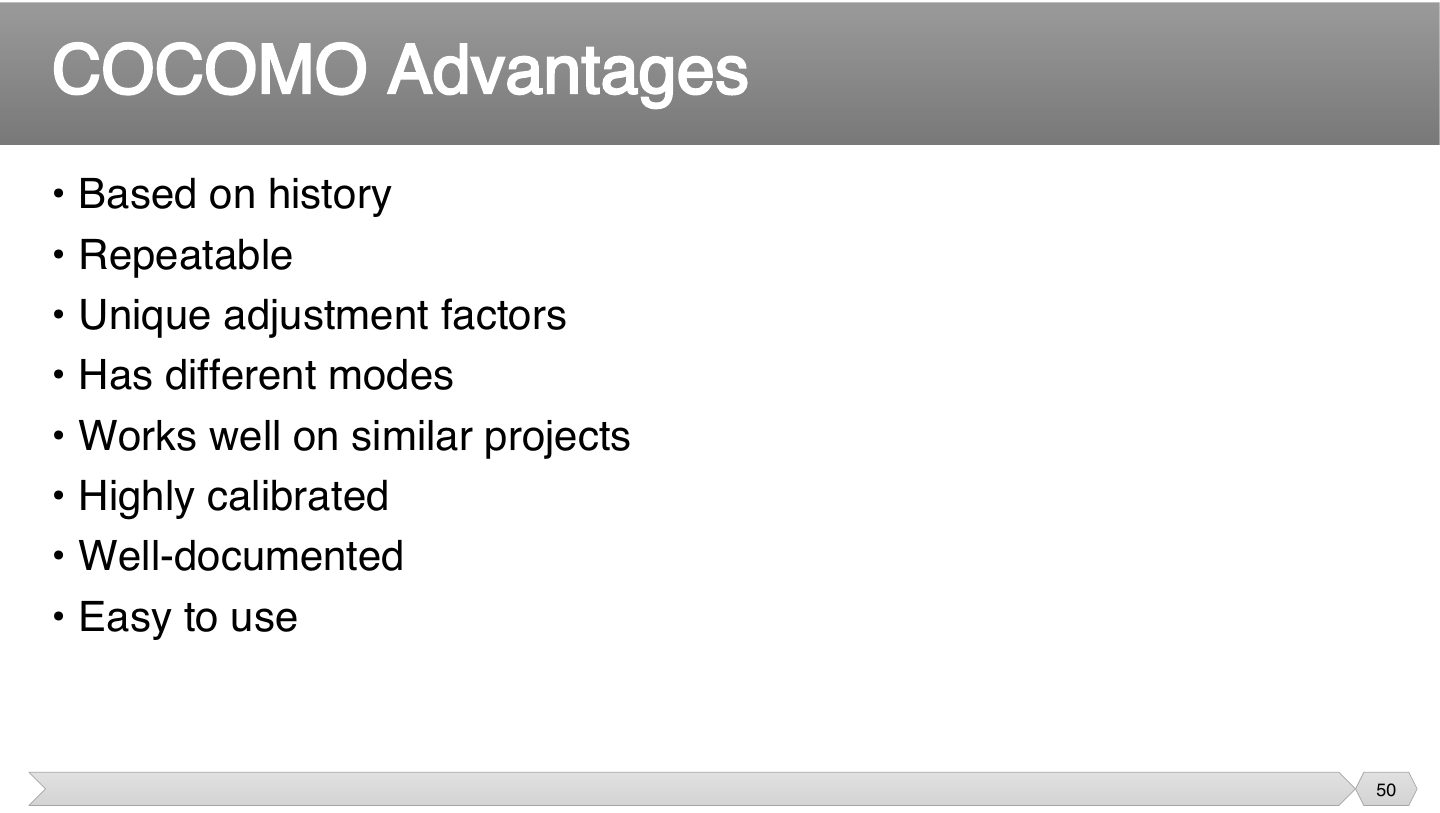
Being based on real projects means it isn’t just opinion. Anyone using it with the same inputs gets the same answer, which makes it easy to explain and defend. That’s why repeatable counts for so much.
Exam angle
Which is an advantage of COCOMO?
- It ignores that.
- It does.
- It’s on the slide.
- It ignores that.
COCOMO Limitations
Notes
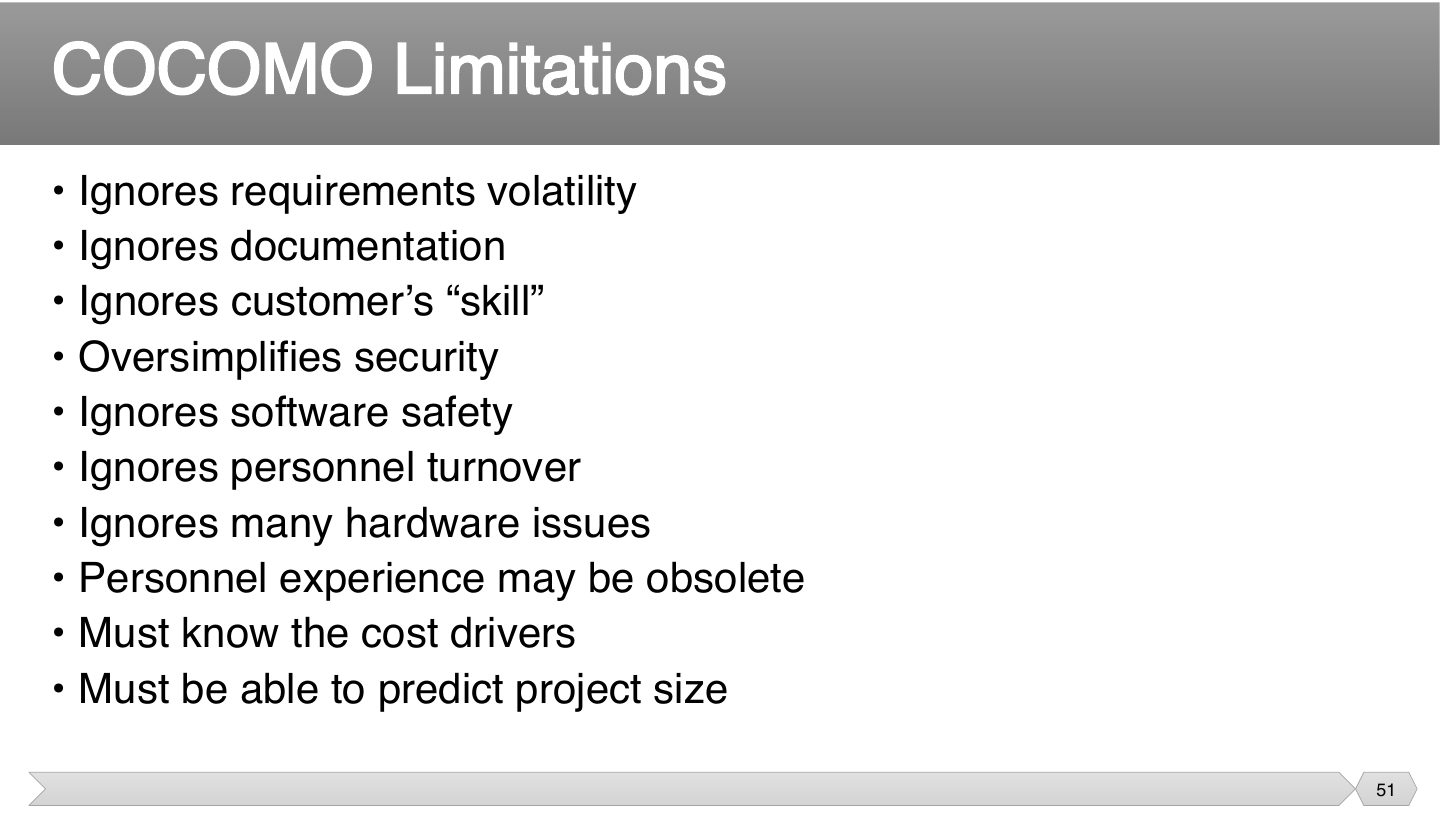
Each item is something that affects real effort but isn’t in the formula. So treat its result as a starting point. And you must predict size first, which is hard early on.
Exam angle
Which is a COCOMO limitation?
- It’s on the slide.
- It has three.
- It’s easy to use.
- It’s based on history.
Final Notes

Code Reuse and Estimation
Notes
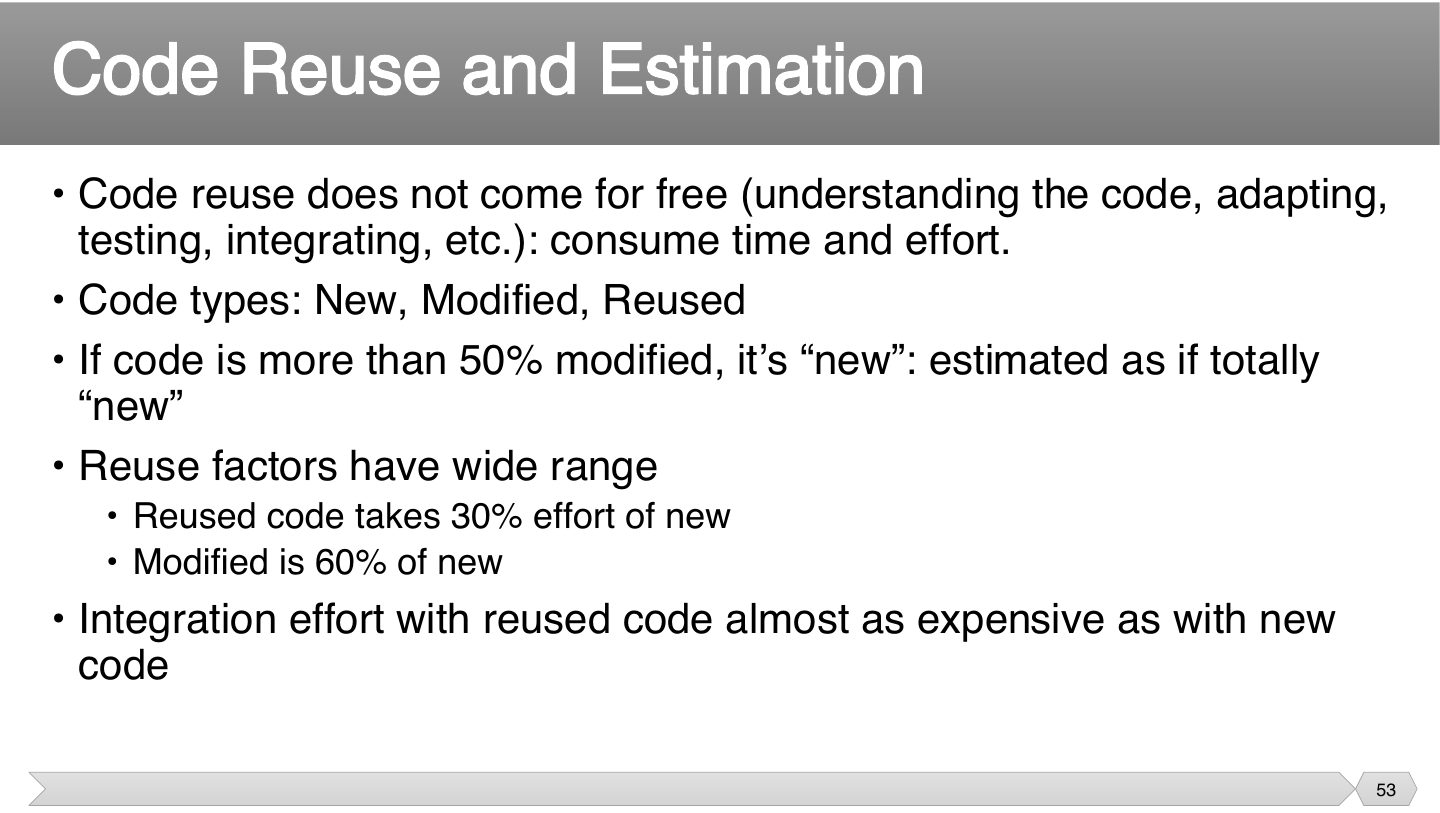
Reuse looks free, but someone must still understand, adapt and test that code. Rewriting most of something is often just as hard as new code, which explains the 50% rule.
Tips & tricks
- NoRM: New, Reused, Modified.
Exam angle
Code is 60% modified. How should it be estimated?
- More than 50% modified counts as new.
- It takes real effort.
- That’s for reused code.
- Reuse isn’t free.
About how much effort does reused code take, compared with new?
- That’s not stated.
- Reuse isn’t free.
- That’s modified code.
- That’s on the slide.
Estimation for Agile
Notes
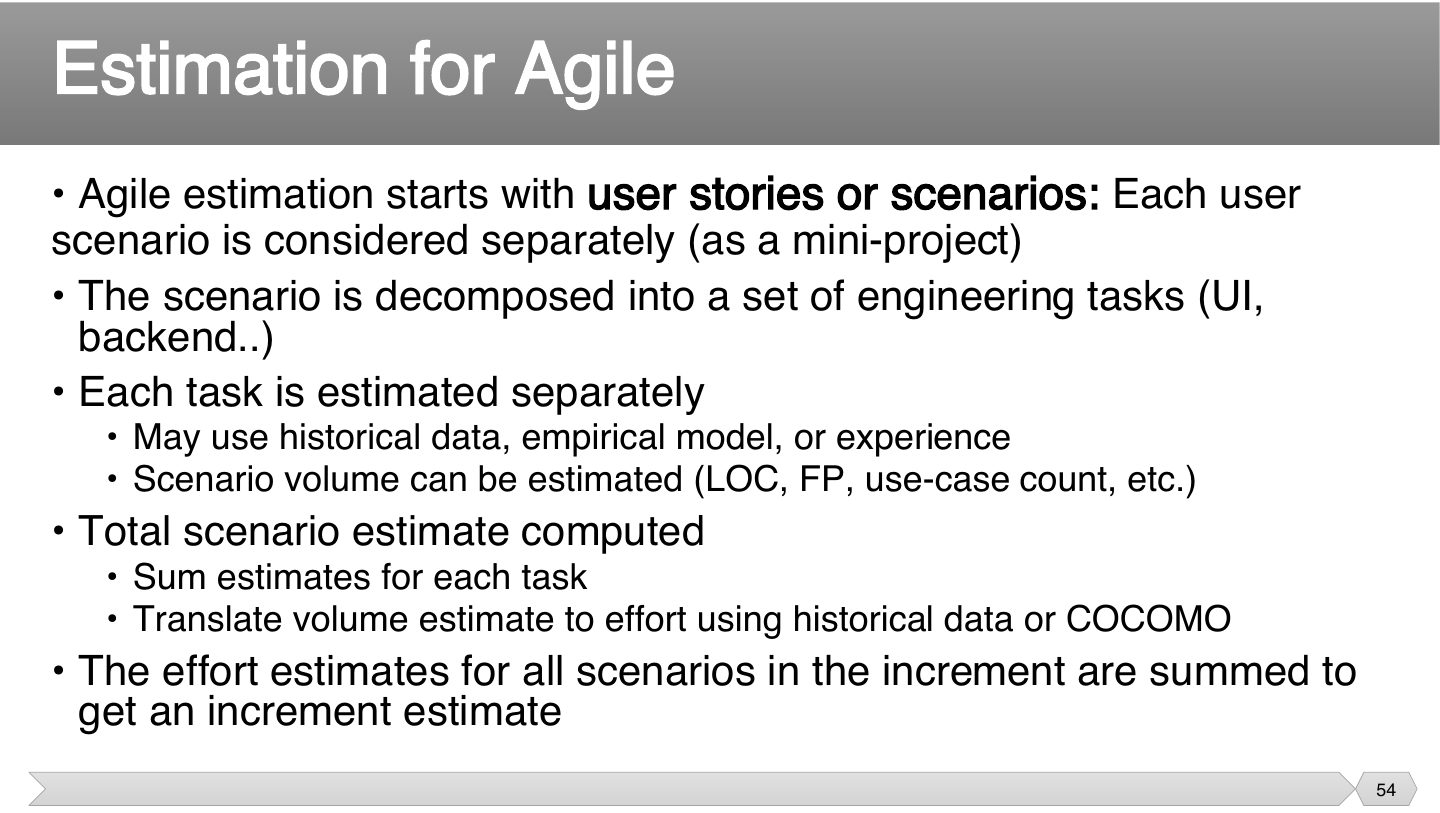
Agile doesn’t skip estimating. It estimates smaller things, closer to when they’re built, so each one is easier. Adding up tasks gives a total for the increment that’s easier to trust.
Exam angle
How does agile estimation get a total?
- It may use several sources.
- It does.
- Each scenario is treated as a mini-project.
- It decomposes first.
Know Your Deadlines
Notes
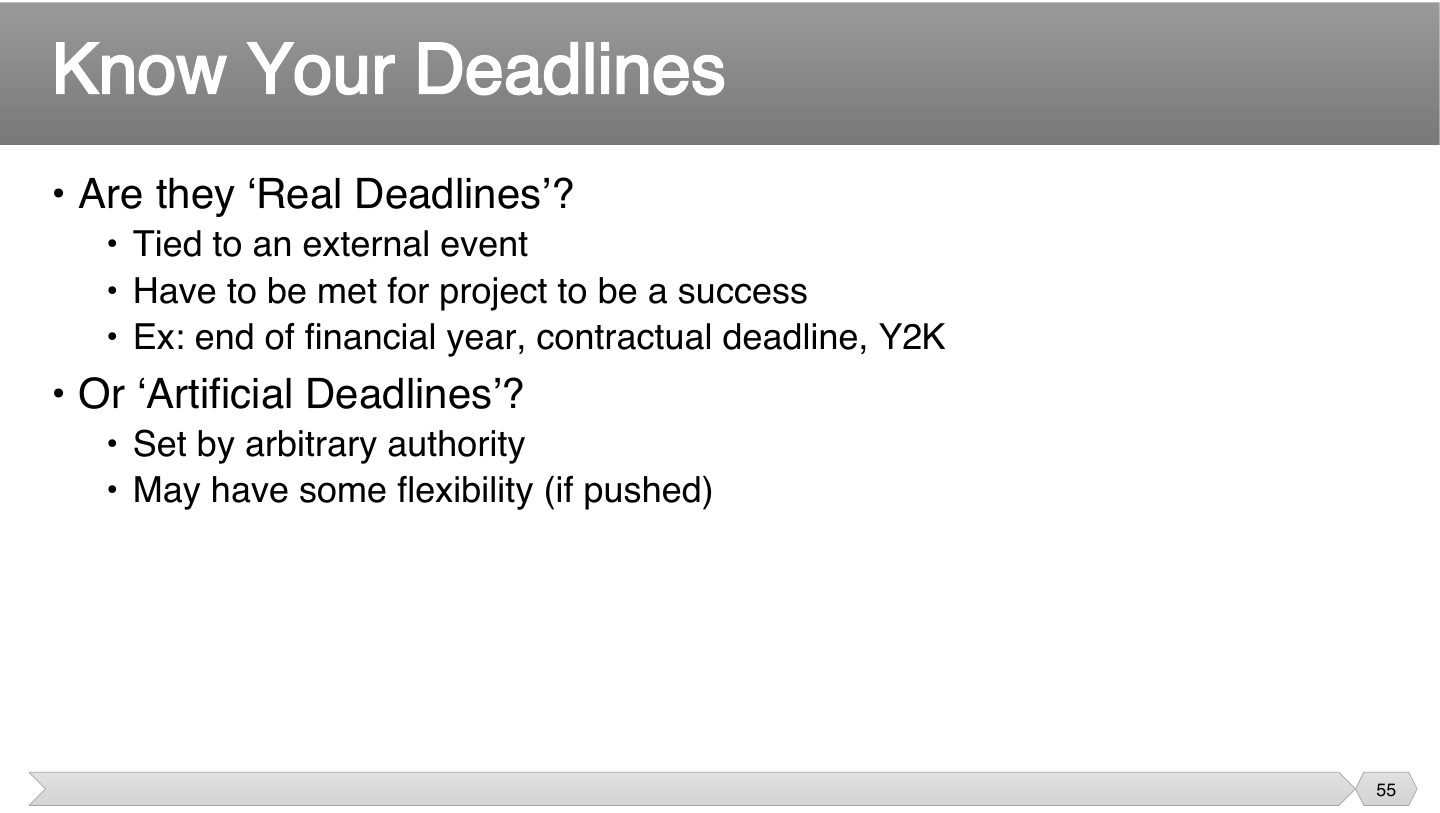
Before fighting for a date, ask why it exists. A legal deadline can’t move, so you’d cut scope, while a date someone just picked may be negotiable. That’s the difference between real and artificial.
Exam angle
A contract requires delivery by year-end. What kind of deadline is this?
- Those are set by arbitrary authority.
- It’s tied to an external event.
- It must be met.
- A contract is external.
Estimation Presentation (Communication)
Notes
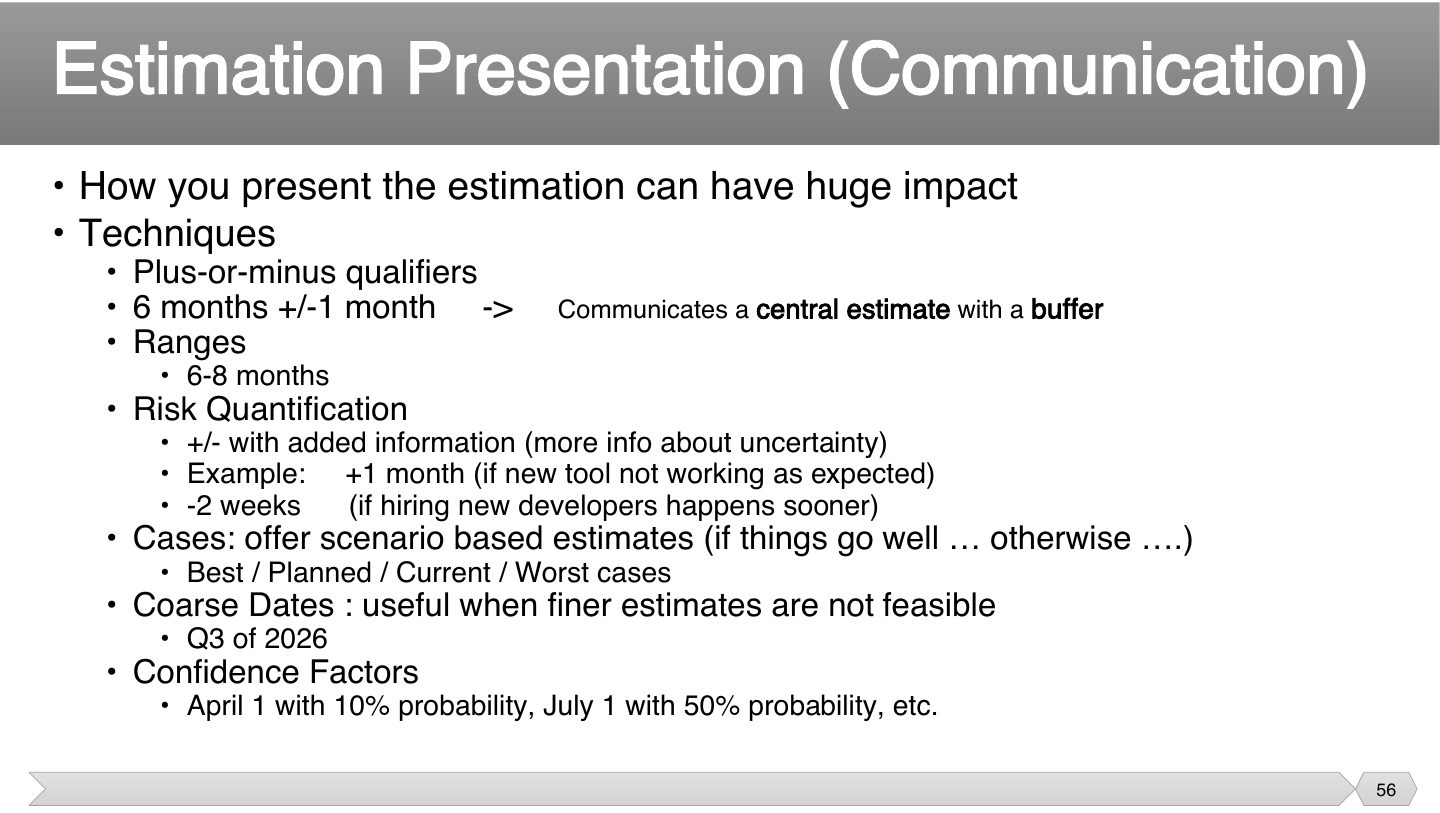
“Six months” sounds like a promise. A range or a confidence level says what you really know, and it leads to better decisions. That’s why how you present it has so much impact.
Exam angle
“July 1 with 50% probability” is which presentation technique?
Final Estimates
Notes
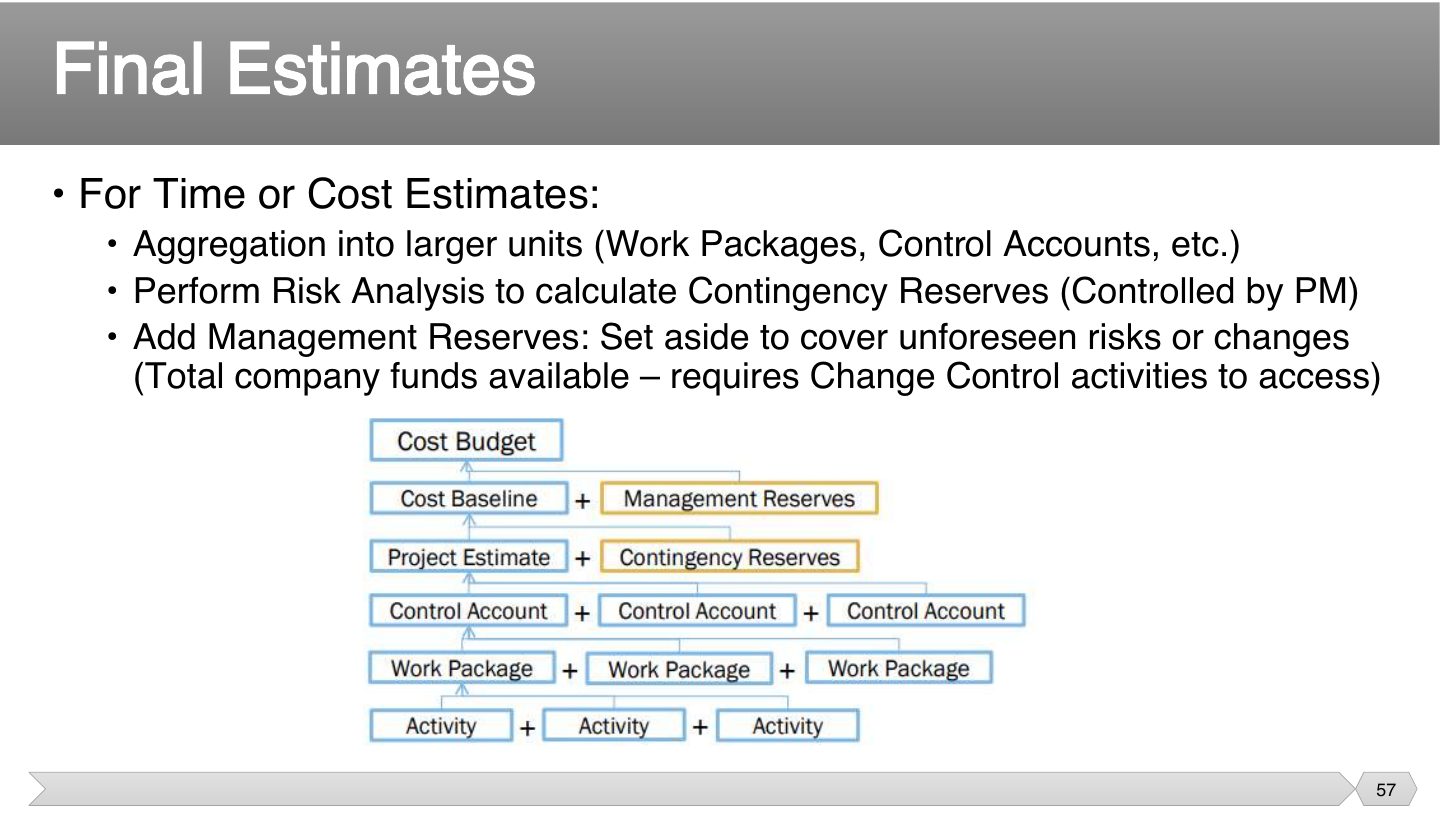
Known risks get money the PM can use right away, and unforeseen ones need permission. That separation keeps both visible, rather than hiding extra padding in each task.
Seen again Ch 1.2, slide 47: Contingency vs. management reserves
Tips & tricks
- ARM, already in order: Aggregation, Risk analysis, Management reserves.
Exam angle
Who controls contingency reserves in final estimates?
- That’s on the slide.
- That’s not it.
- Someone does.
- That’s not it.
How do you access management reserves?
- They’re controlled.
- They can, with approval.
- They’re not.
- They require change control activities.
Estimation Guidelines
Notes
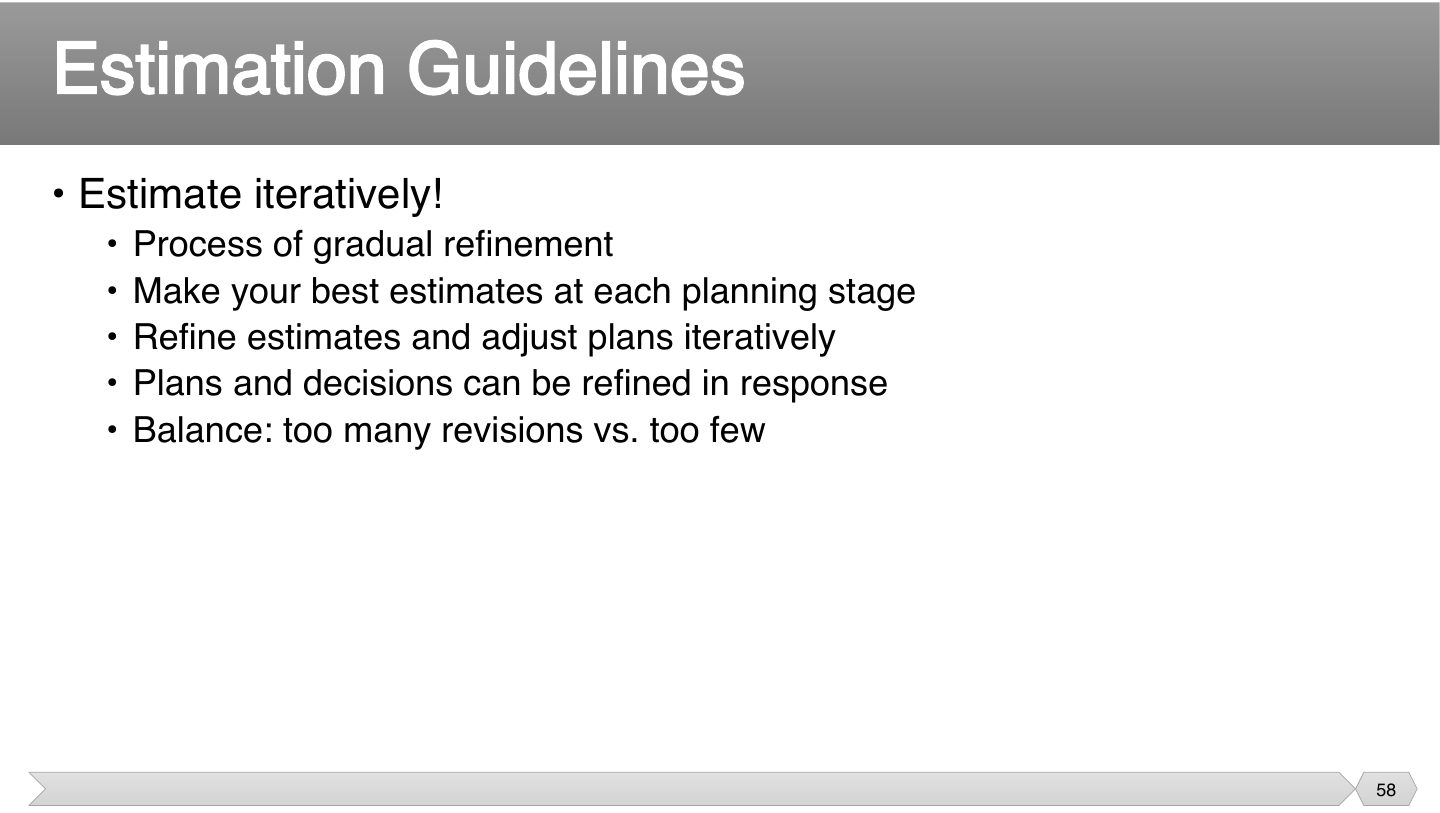
Early estimates are rough and later ones are better, so keep updating them. But changing plans too often is chaotic, which is why the slide asks you to balance. Iterative doesn’t mean constant.
Exam angle
What does “estimate iteratively” mean?
- That’s the opposite.
- You do estimate.
- It’s gradual refinement.
- The slide says to balance revisions.
Other Estimation Factors
Notes
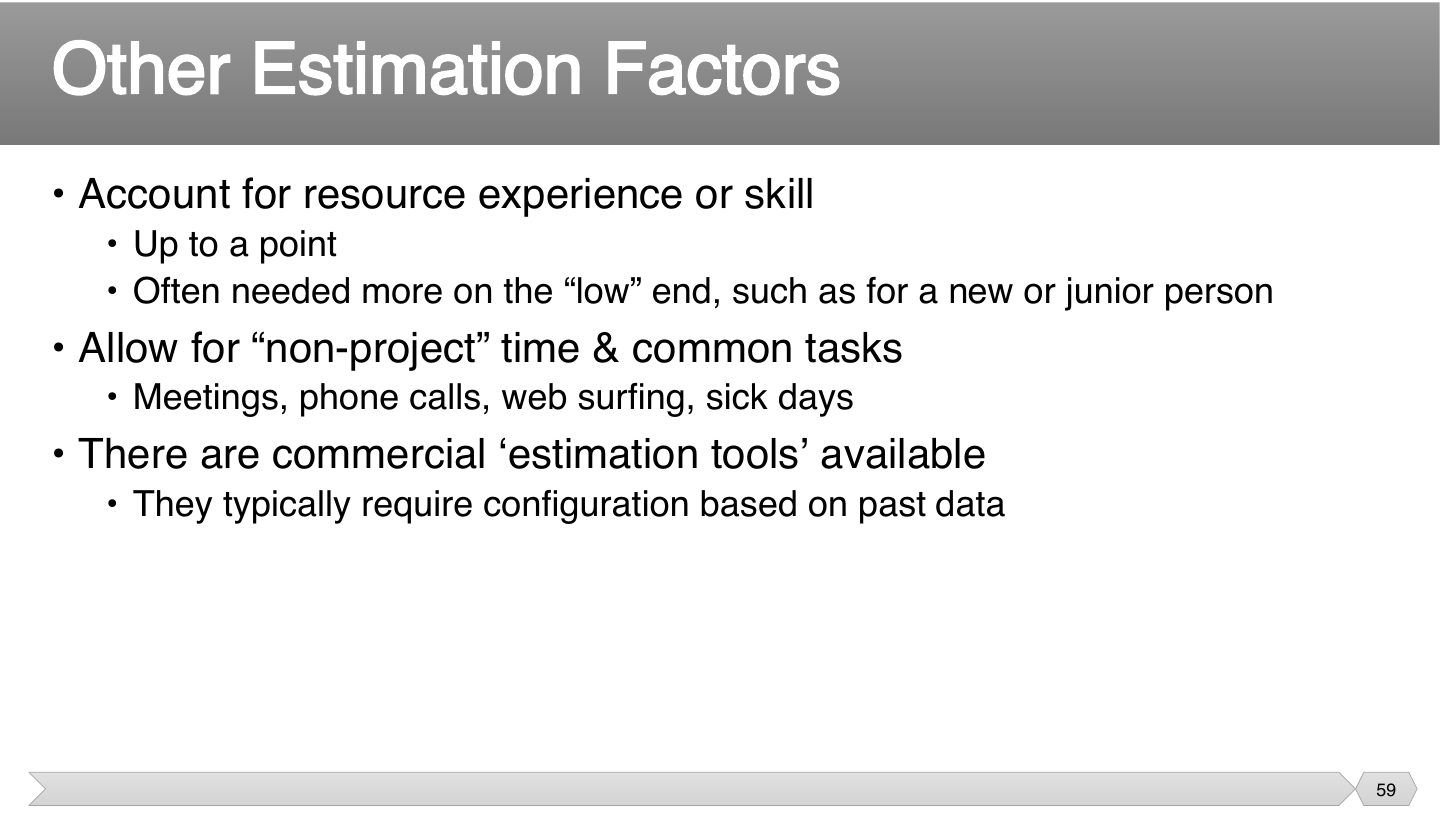
Plans often assume every working hour goes to the project. Real days include meetings and sick leave, and a new person needs extra help. Ignoring non-project time makes each estimate optimistic.
Exam angle
Why allow for non-project time?
- That’s not stated.
- That’s not realistic.
- That’s not it.
- Plans must reflect real days.
Other Estimation Notes
Notes
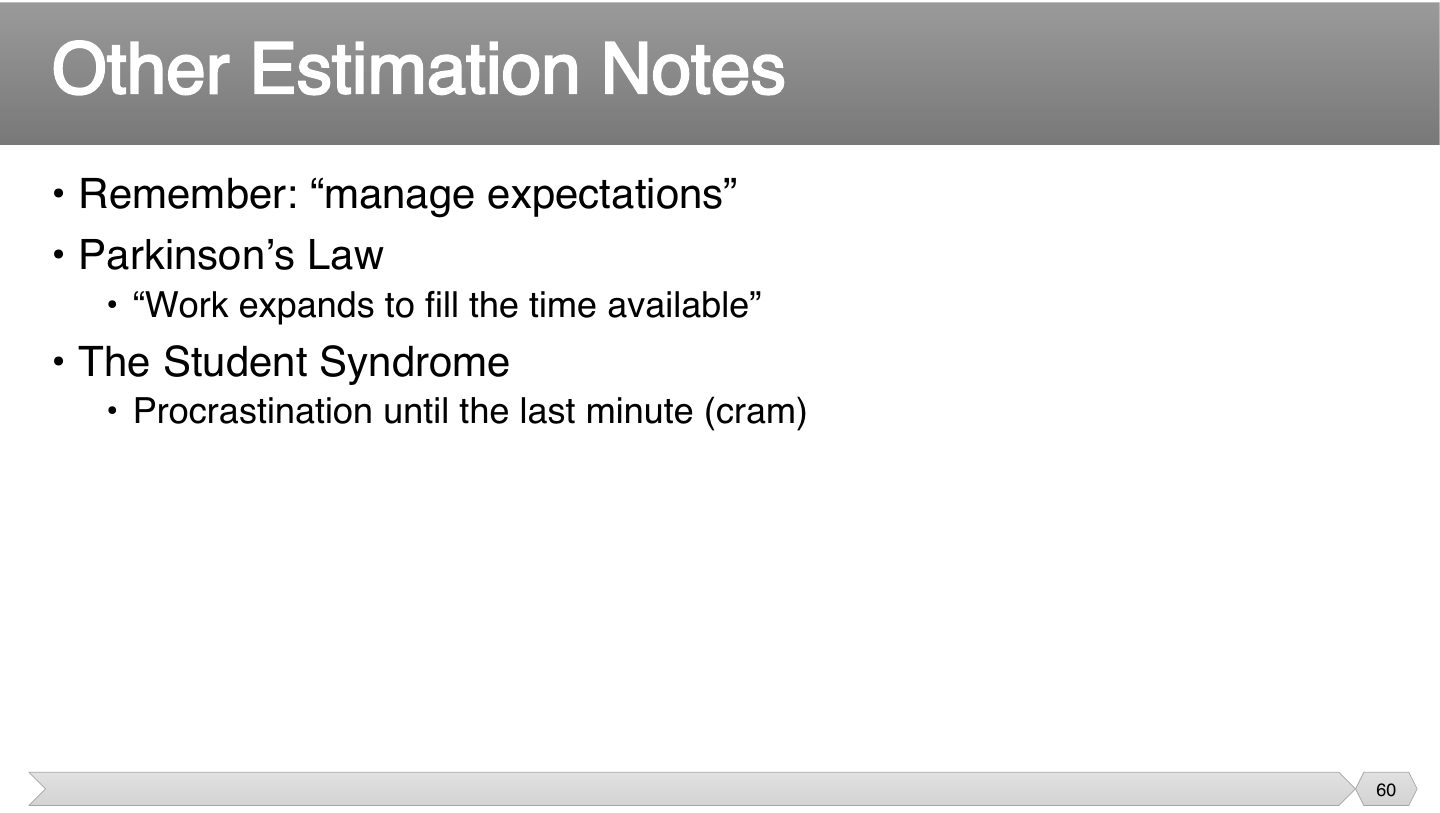
People tend to start late when they believe there’s plenty of time. So added padding gets wasted, not used as protection. Student syndrome is why extra time doesn’t always mean you’ll finish safely.
Exam angle
Team members who wait until the last minute to start a task despite padding show: