In PMBOK 7, a risk can only have negative effects.
- Positive risks are opportunities.
Identify → analyze → plan → monitor, for threats. Both finals asked for two risk-identification techniques plus how you would assess, mitigate, prioritize and monitor risks, so know at least three techniques, risk exposure (RE = P × I), the probability/impact matrix and the five threat strategies cold.
Every original slide is shown unchanged. Yellow marks on a slide point to a numbered note: hover or tap a mark to jump to its note, and hover a note to see its marks. Questions tagged Past exam appeared on a real paper; Prediction questions are likely angles, not confirmed. Pick an answer to each question: a wrong pick tells you why it is wrong, so you can try again.
Process: Identify → Analyze → Plan → Monitor. This chapter covers threats only; opportunities appear briefly on slide 72.
Memory trick “I Am Planning More”: Identify, Analyze, Plan, Monitor.
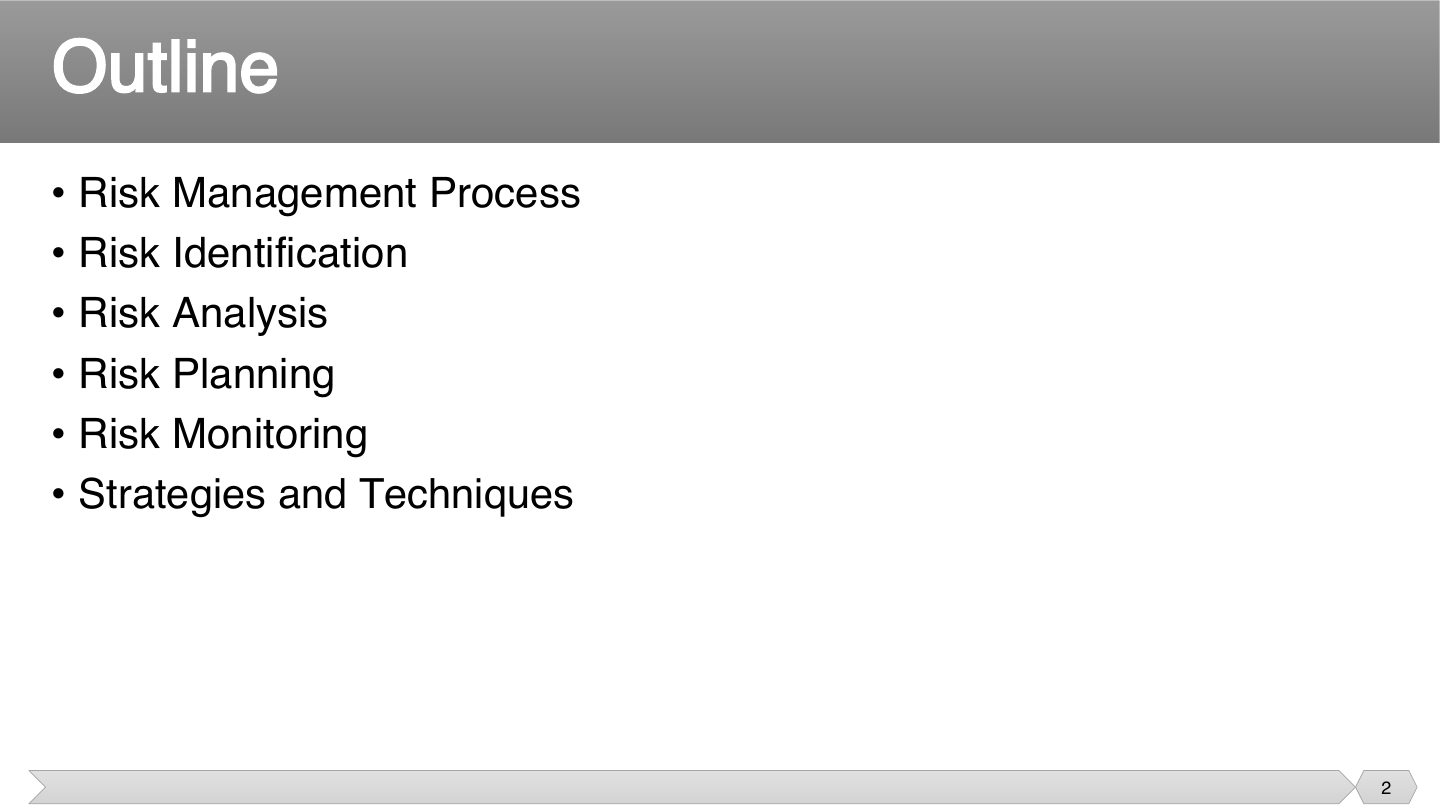
The outline follows the process order.
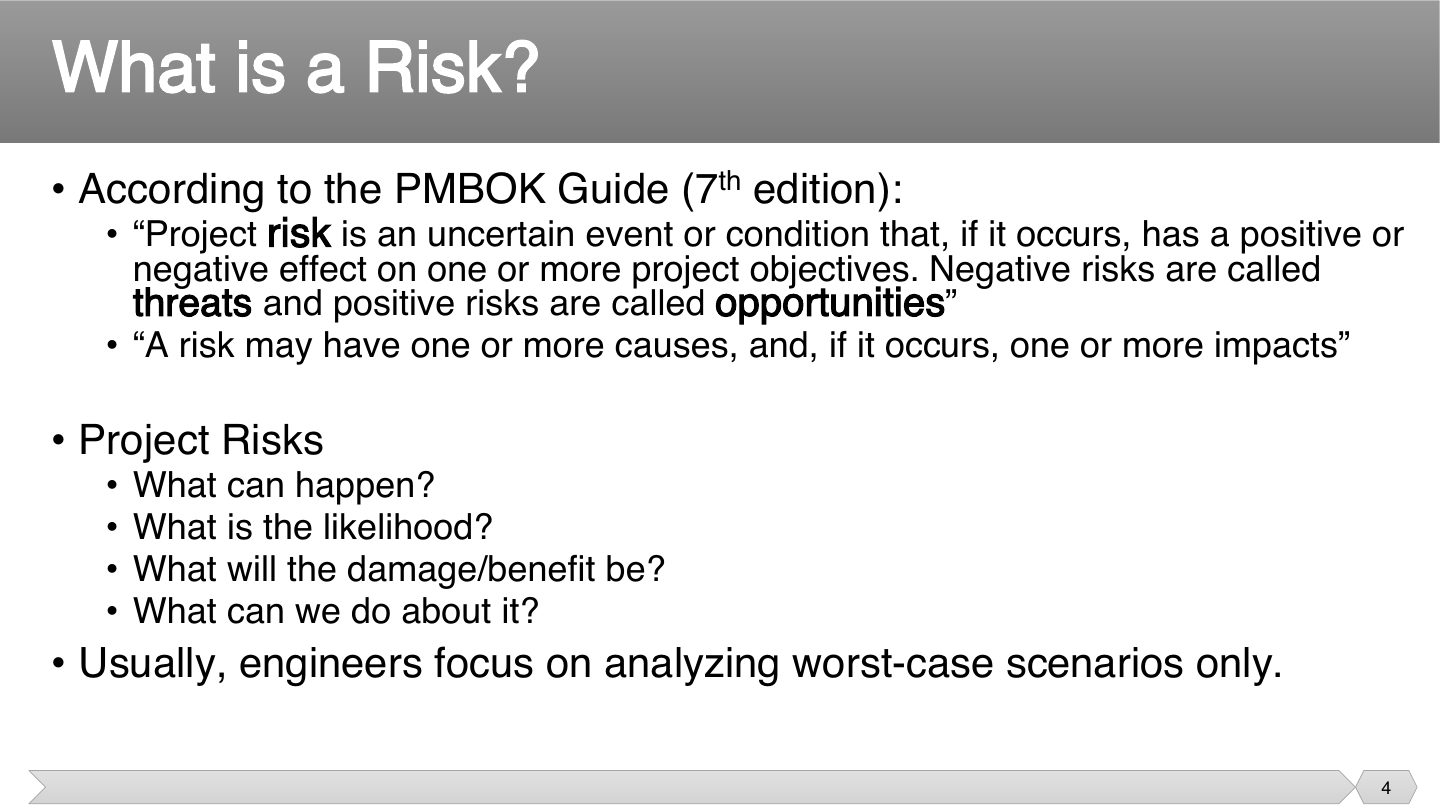
A risk is something that might happen and would change a project goal if it did. The word positive matters: a chance to finish early is also a risk, called an opportunity. A negative one is a threat.
These four questions are the whole of risk management in one line. They move from noticing a possibility, to sizing it, to deciding what to do, and skipping any of them leaves you unprepared.
Seen again Ch 1.2, slide 100: Risk in the Uncertainty domain
Seen again Ch 1, slide 68: Risk principle
In PMBOK 7, a risk can only have negative effects.
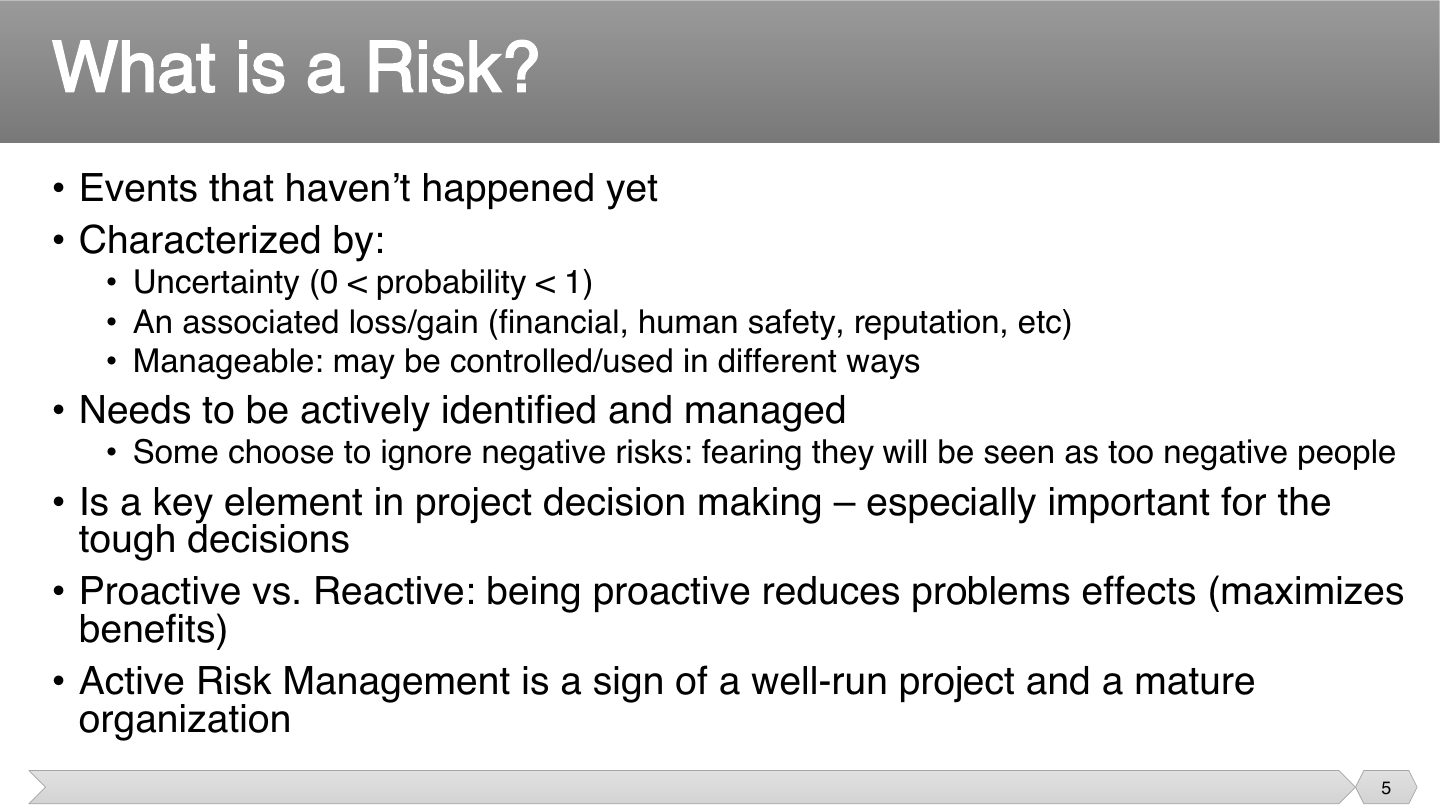
Once it has happened, it’s no longer uncertain: it’s an issue, and you deal with it right away. That’s why 0 < probability < 1: 0 means it can’t happen, and 1 means it already has.
Mature teams talk about risks openly and early. Teams that stay silent, fearing they’ll seem negative, simply meet those same problems later, when they cost more.
Trap Something that has already happened is an issue, not a risk.
A server has already crashed. Is this a risk?
Active risk management is a sign of a mature organization.
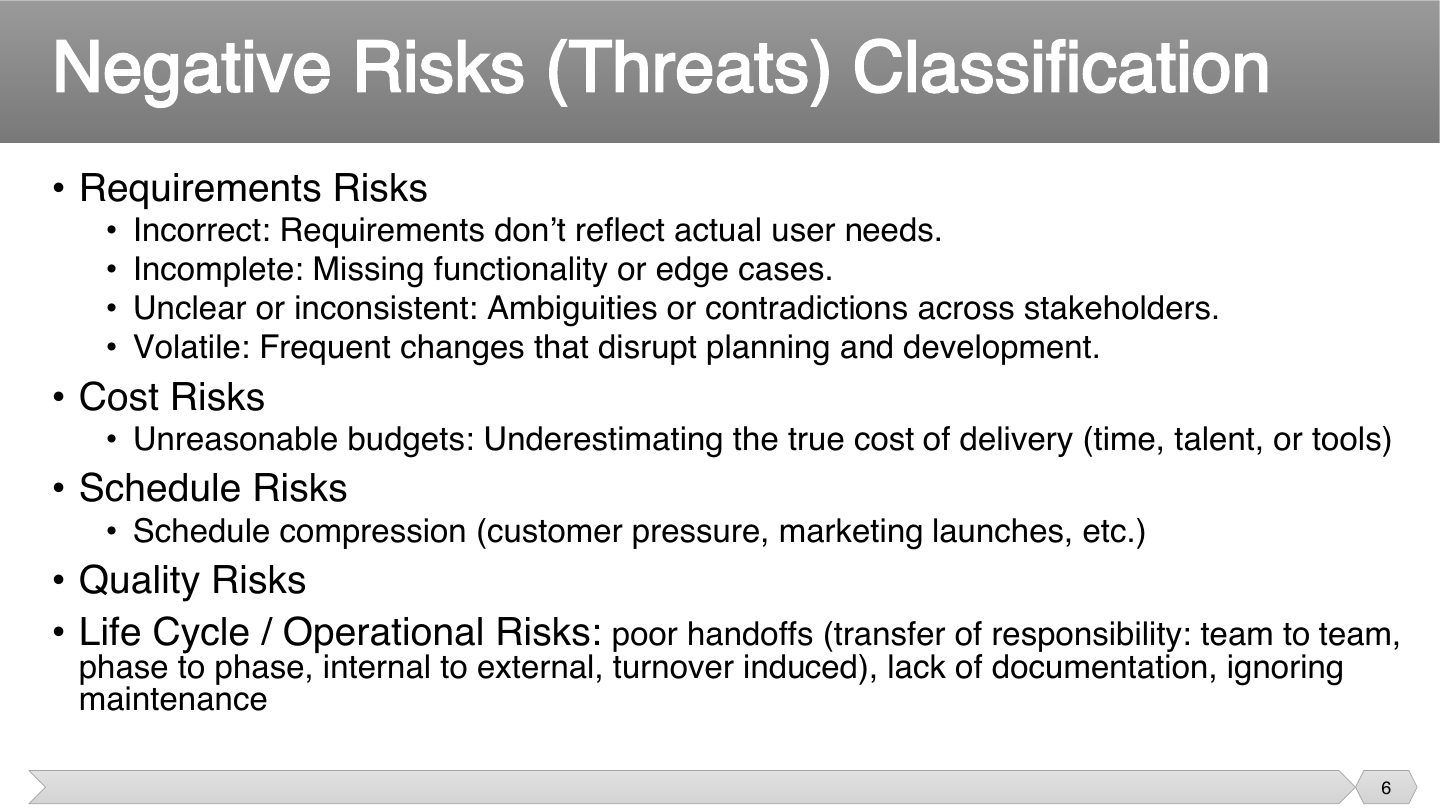
Grouping threats makes them easier to spot, because each class suggests its own questions. Requirements problems are often the most damaging, since everything is built on them. Operational risks are easy to overlook: a poor hand-off between teams can undo good work.
Requirements keep changing in ways that disrupt planning. Which kind of requirements risk is this?
Poor hand-offs and missing documentation fall under which class?
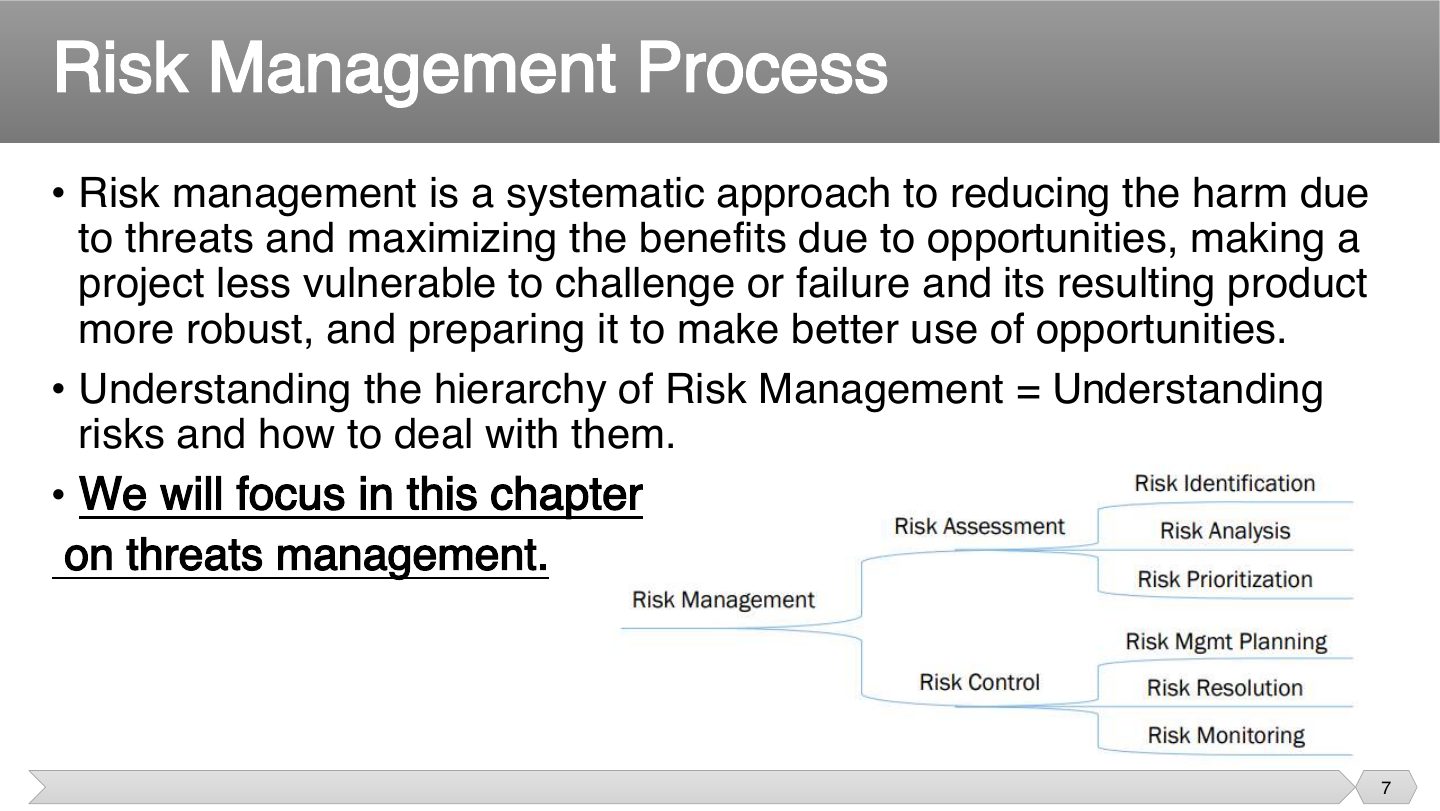
Assessment asks “what could go wrong, and how bad is it?”, and control asks “what do we do about it?”. Doing only the first gives you a list of worries and no protection.
Which belongs to risk control rather than assessment?
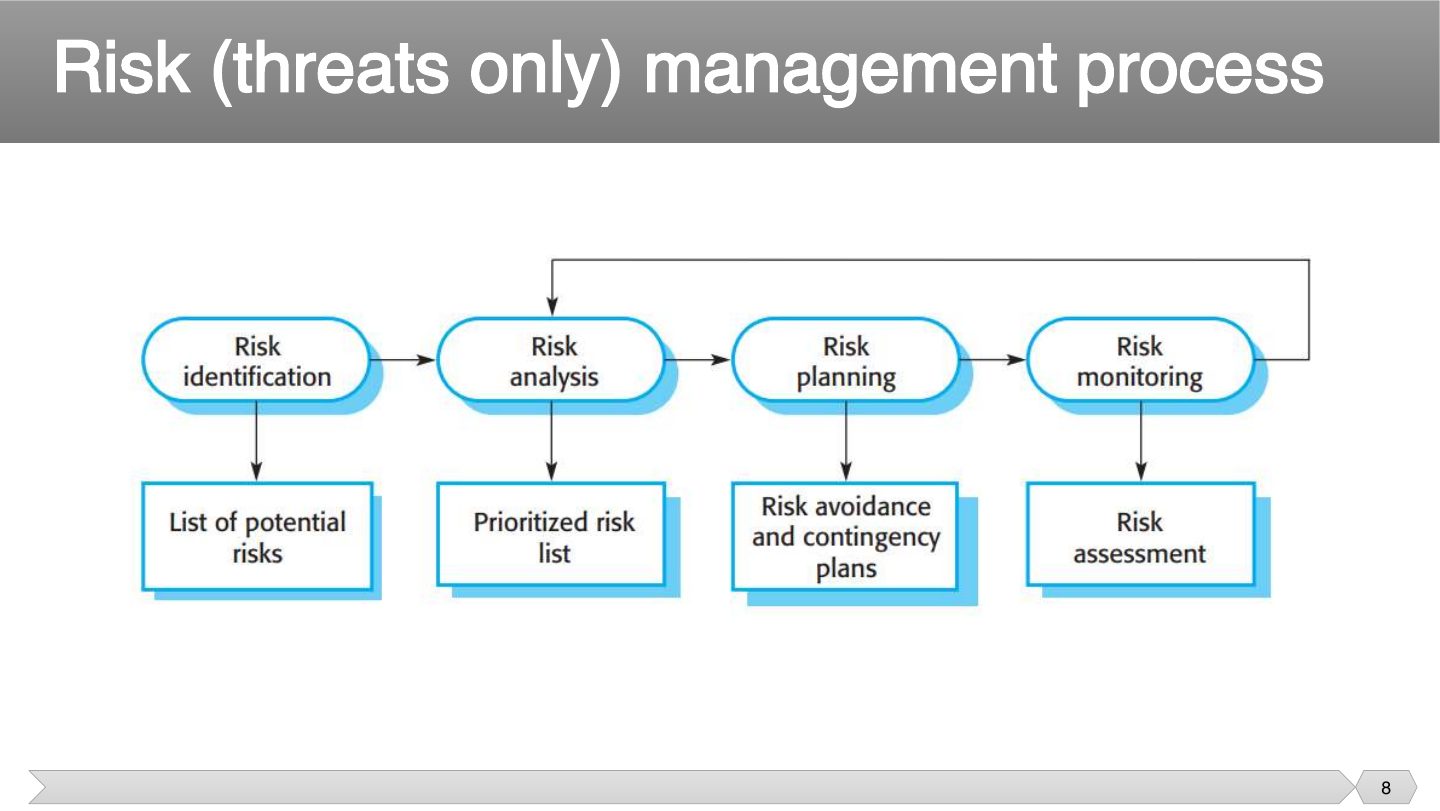
Each step has an output: list of risks → prioritized list → response plans → assessment. Monitoring loops back to identification.
What is the output of the risk analysis step?
A plan looks fine until someone asks what could break it. Testing it this way before you start shows whether it’s resilient, not just optimistic. It’s also easier to win support when you can show you’ve thought about what may go wrong.
Instructor Arabic gloss for advocacy: “مناصرة”.
How does risk management help sell a plan?
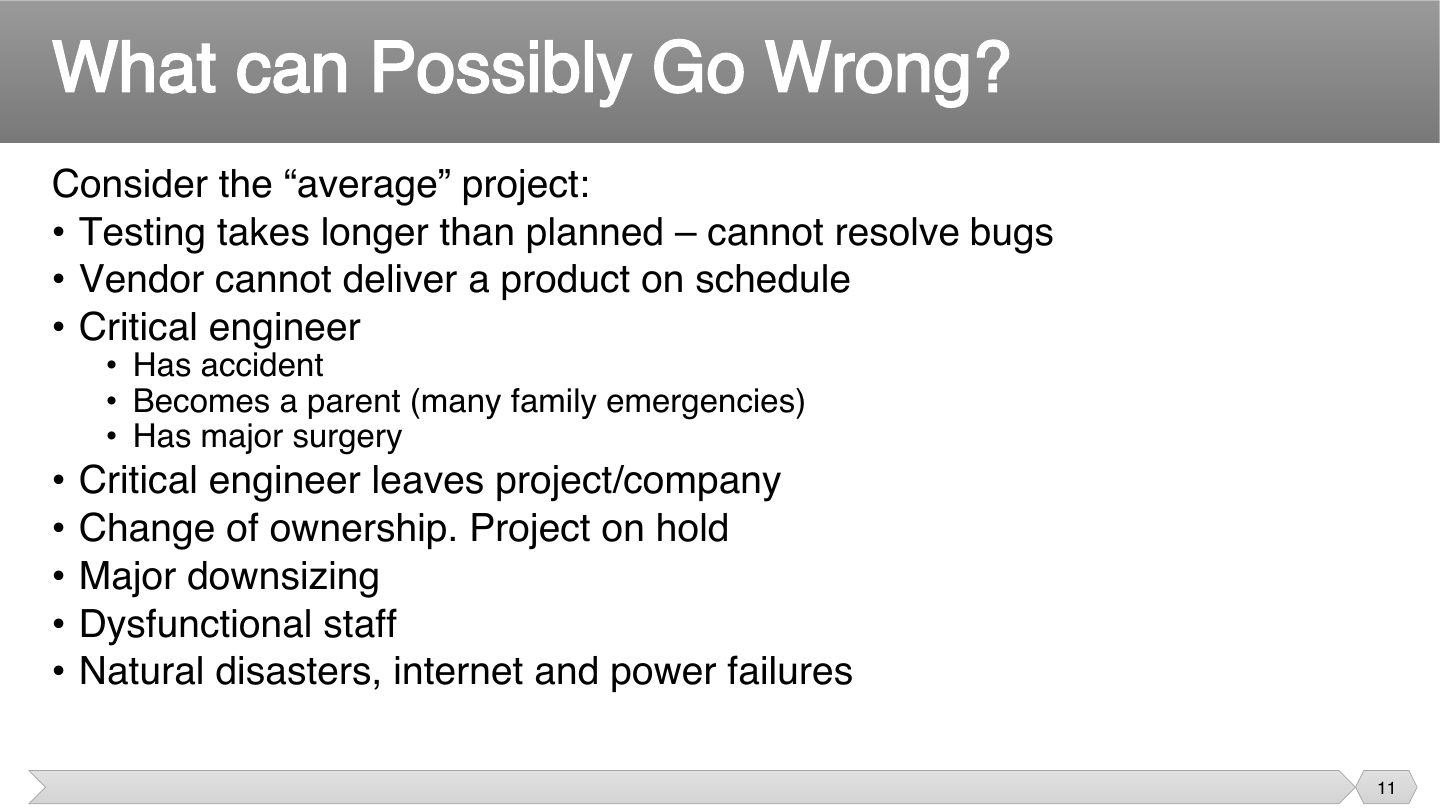
None of these are unusual, and that’s the point. A key person leaving or a late vendor happens all the time, so plan for it, rather than treating it as bad luck.
Which is a typical threat on the “average” project?
New risks appear as you learn more, and old ones stop mattering. A list made once and never updated gives false comfort, so identification has to be iterative.
Risk identification is done once at project start.
“Known” doesn’t mean certain to happen. It means you could find it by carefully looking at your plan, such as noticing an unrealistic date. Since you can see it coming, you can write a response in advance.
An unrealistic delivery date is found by evaluating the plan. Which kind of risk is this?
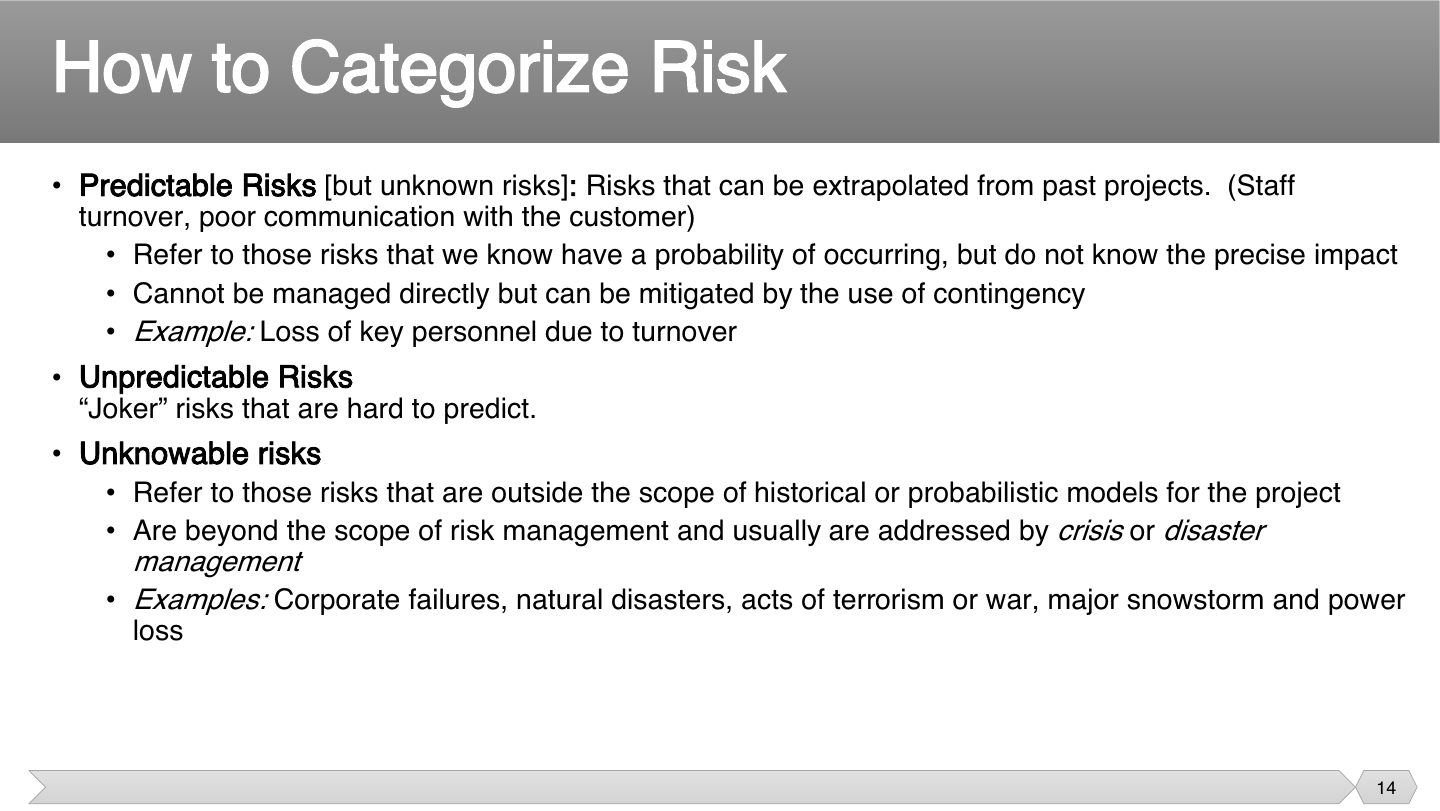
You know roughly how often staff leave, but not what it would do to this project. Since you can’t pin down its impact, predictable risks are handled by keeping something in reserve.
No plan covers a natural disaster striking your office. These sit outside risk management, so companies handle them by way of crisis or disaster management.
Memory trick Known → plan · Predictable → contingency · Unknowable → crisis management.
A terrorist attack or major natural disaster is classified as:
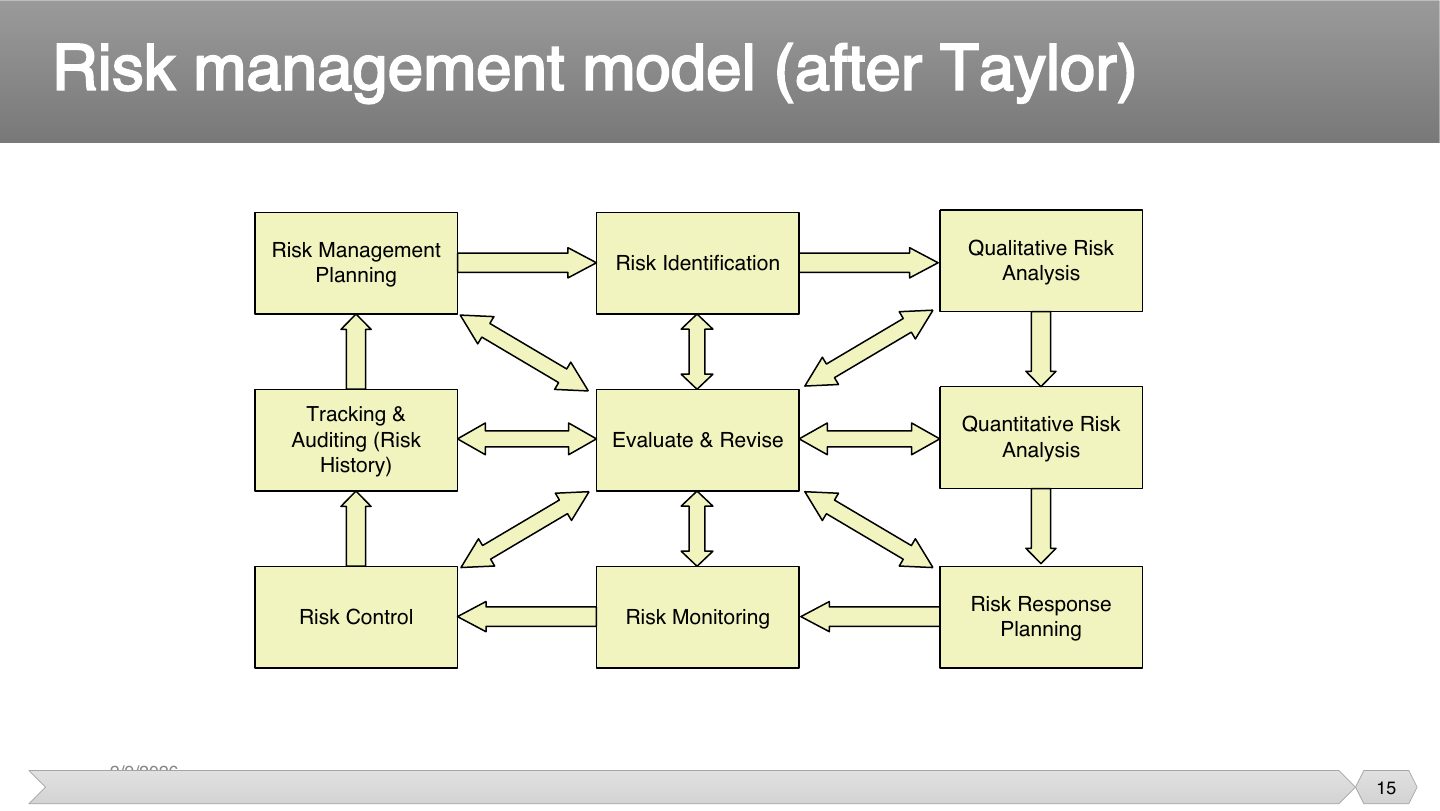
In the Taylor model, what follows risk identification?
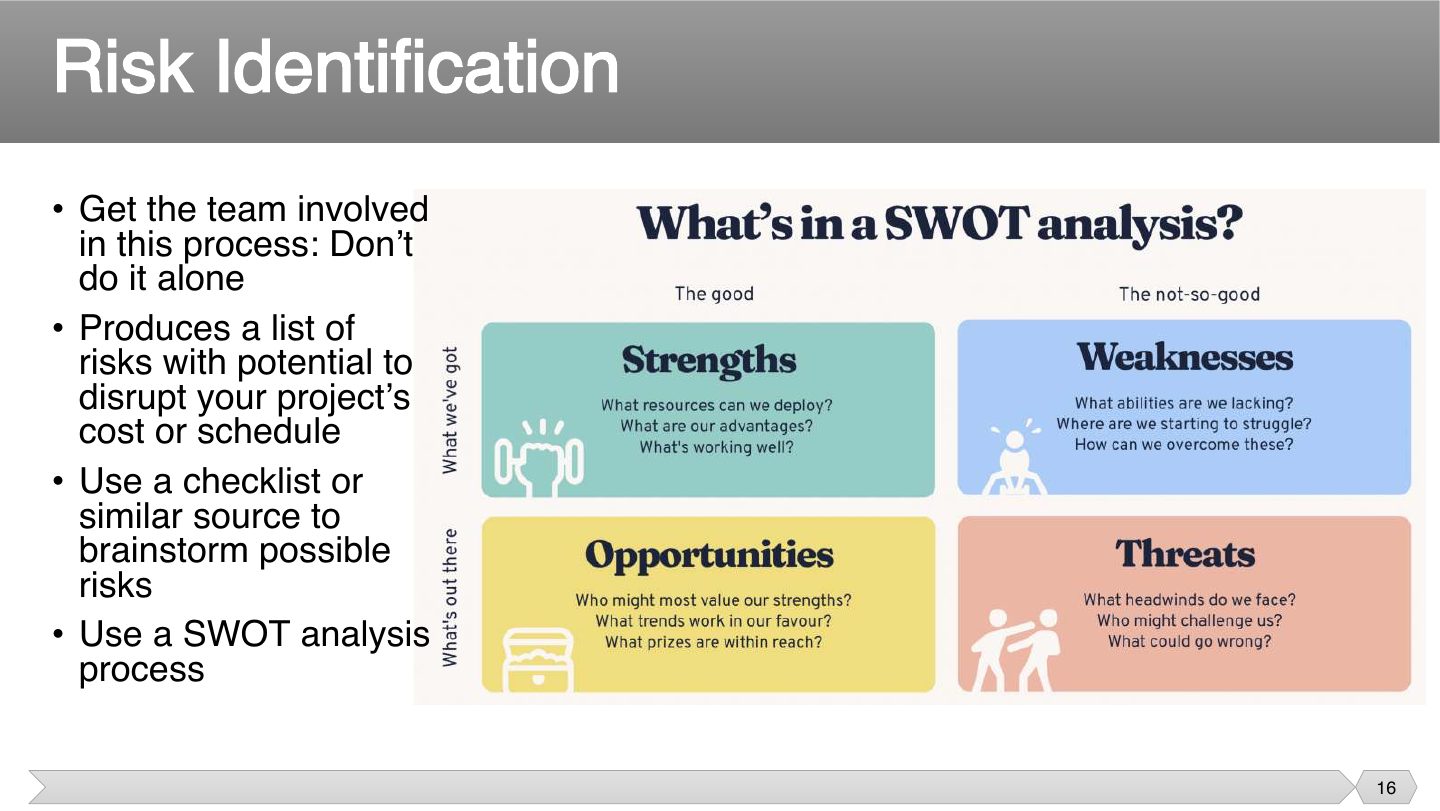
One person only sees their part. A tester and a developer notice different dangers, so involve the team, and a checklist or SWOT stops you relying only on memory.
Q2.5 · two risk identification techniques + risk assessment matrix
Q2.4 · two identification techniques; mitigate, prioritize and monitor
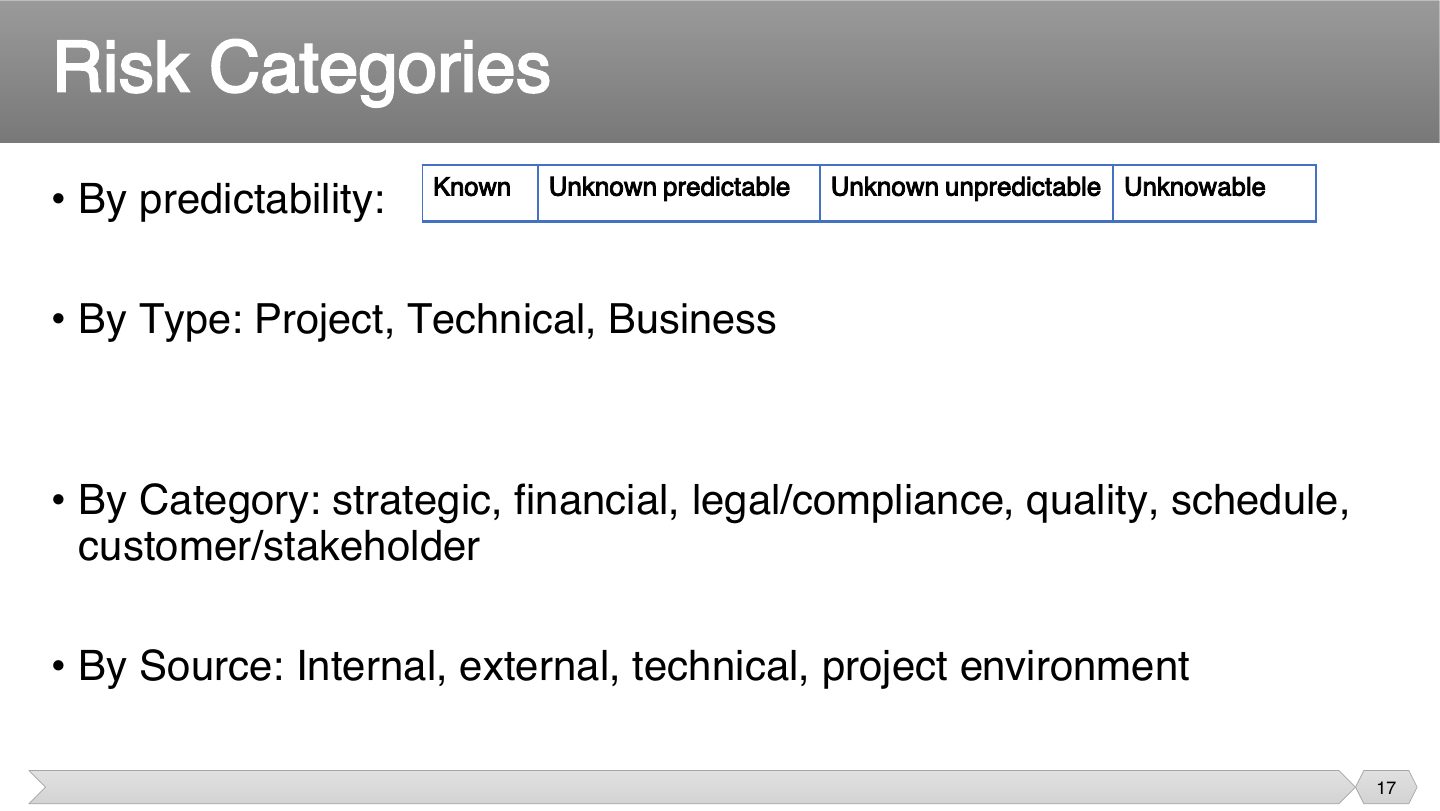
These aren’t competing lists but different ways of sorting the same risks. Sorting helps because risks in one group often share a response or an owner.
Which is sorting risks “by type”?
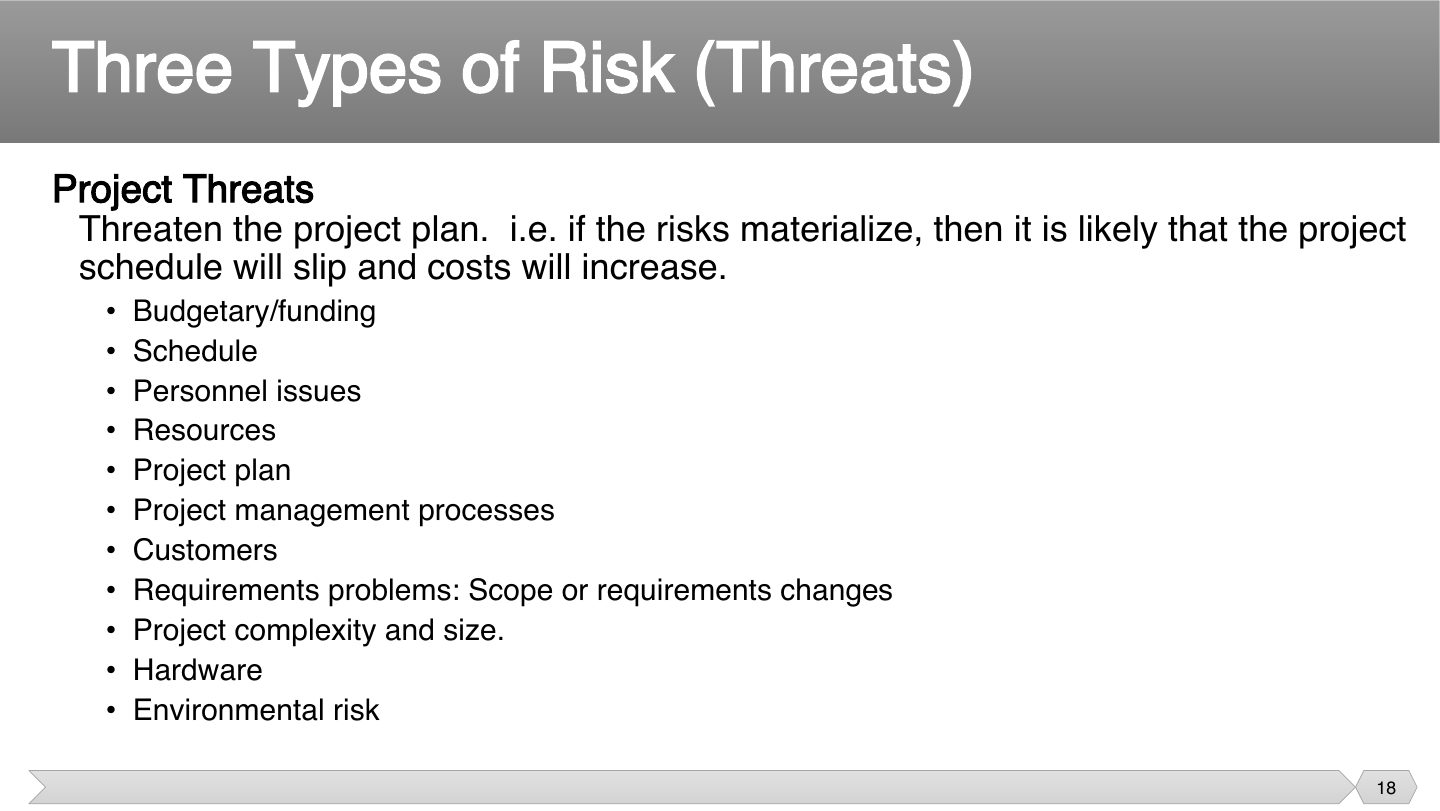
The test is what the risk would hurt. If it mainly makes you late or over budget, it’s a project risk. A departing team member fits here, because the plan is what suffers.
A team member resigns, and the schedule will slip. Which type of risk is this?
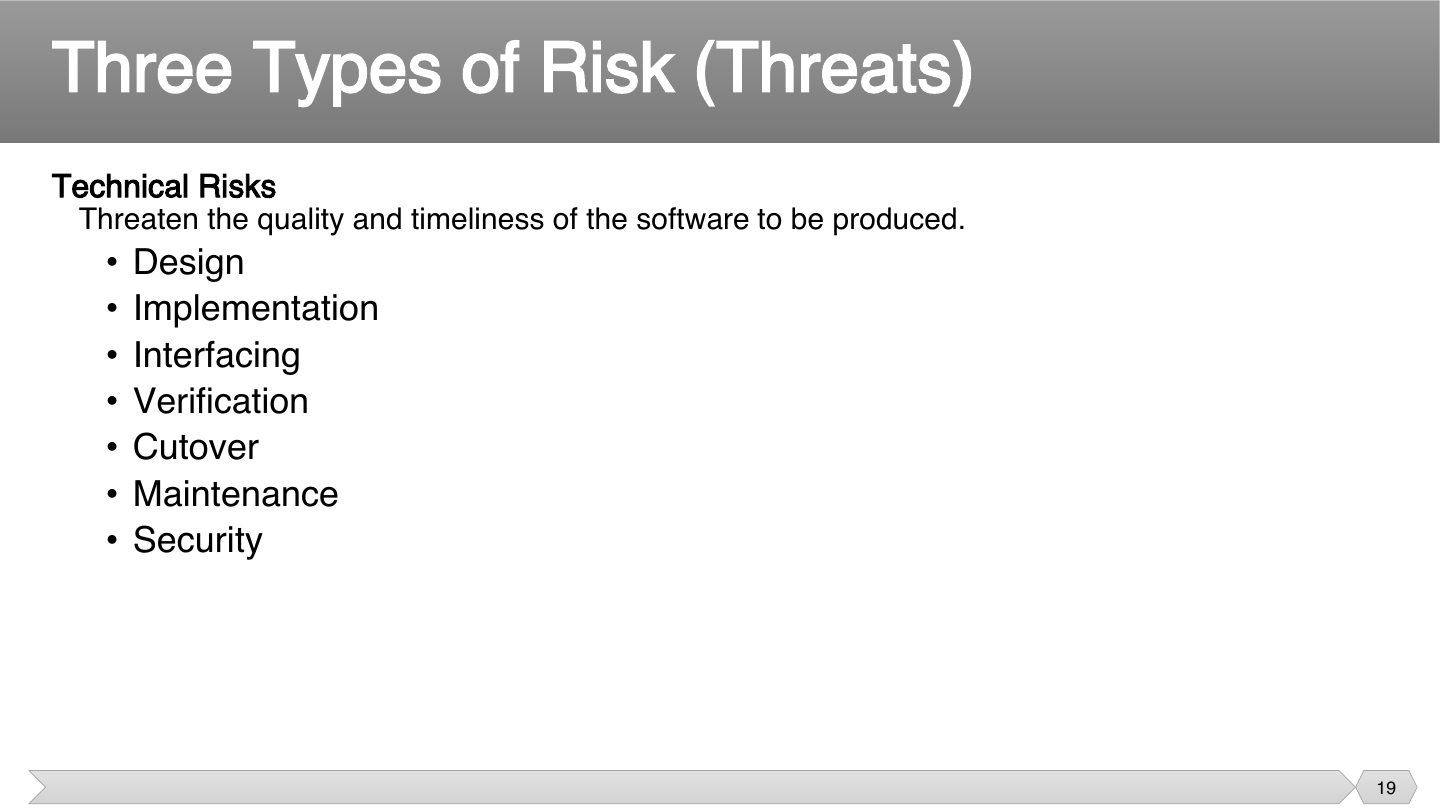
Here the danger is to the software itself. A technical risk may leave the schedule intact, while the product doesn’t work properly, such as a design that can’t handle the load.
A new interface may not work with an old system. Which type of risk is this?
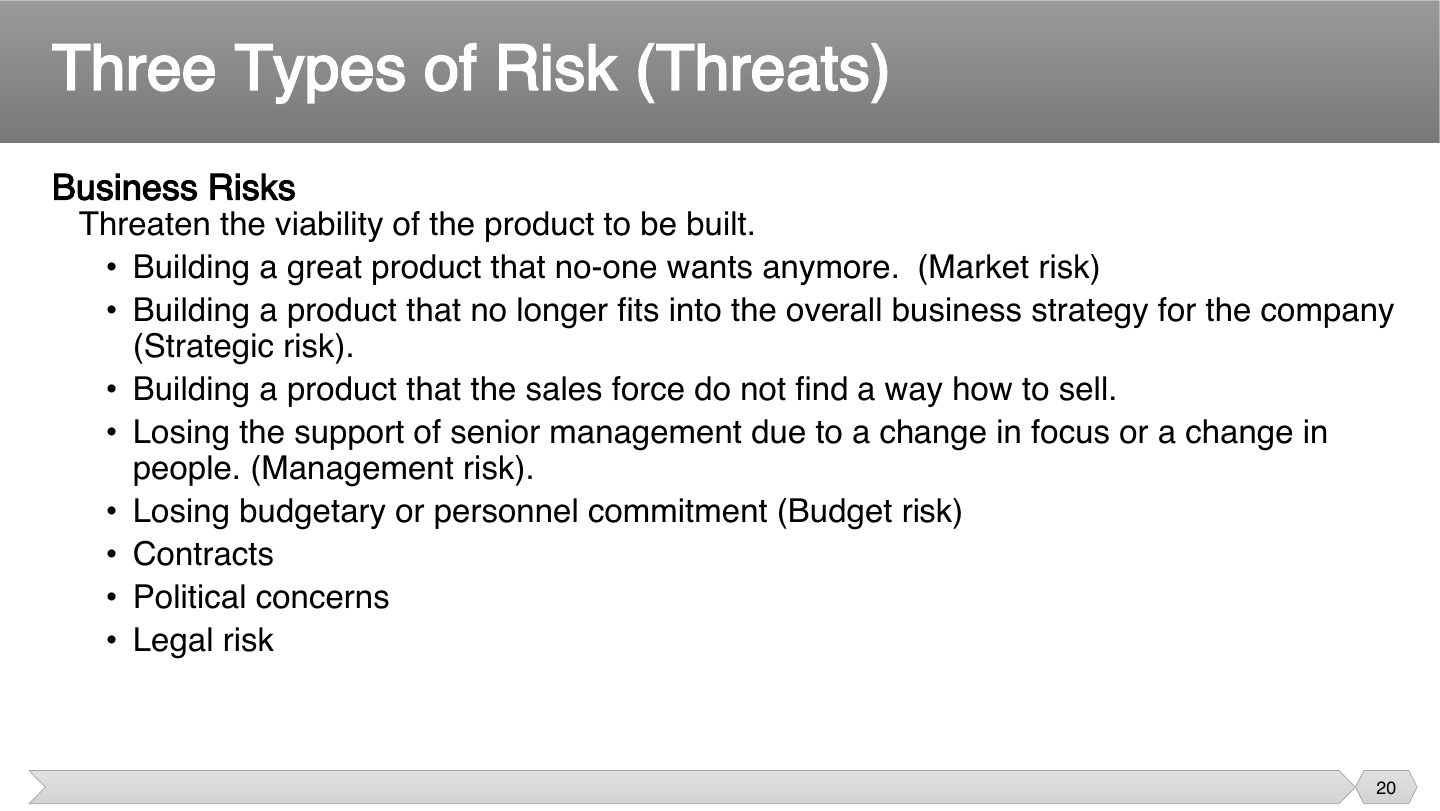
You could finish on time with no bugs and still fail, if nobody wants what you built. That’s what viability means. These are the easiest risks for a technical team to miss.
Memory trick Project → plan · Technical → software quality · Business → product viability.
Building a great product that no one wants anymore is which risk type?
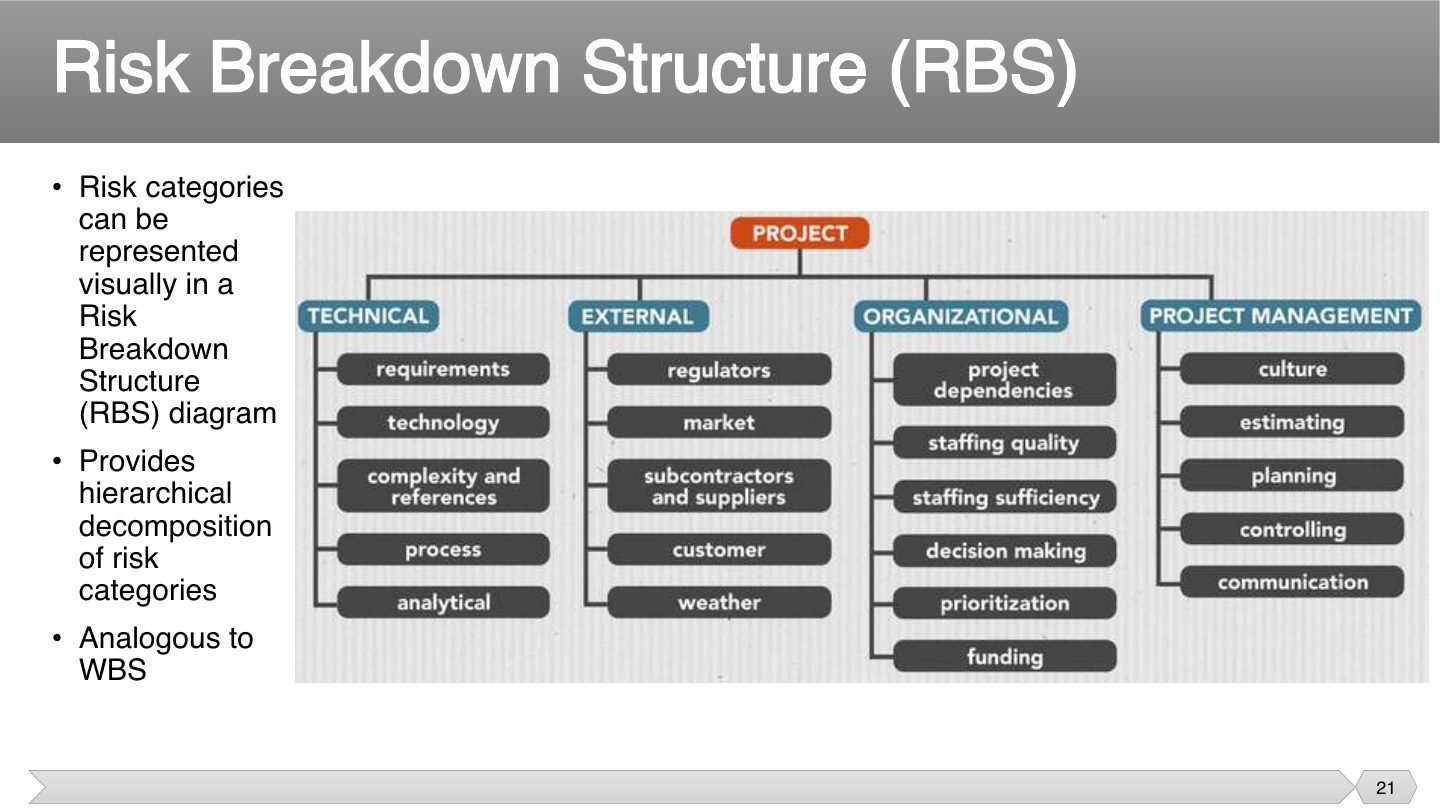
Just as a WBS breaks work into parts, an RBS breaks risks into groups. This makes gaps easy to see: if a whole branch is empty, you probably haven’t looked there yet.
Seen again Ch 6.2, slide 8: WBS
What is an RBS similar to?
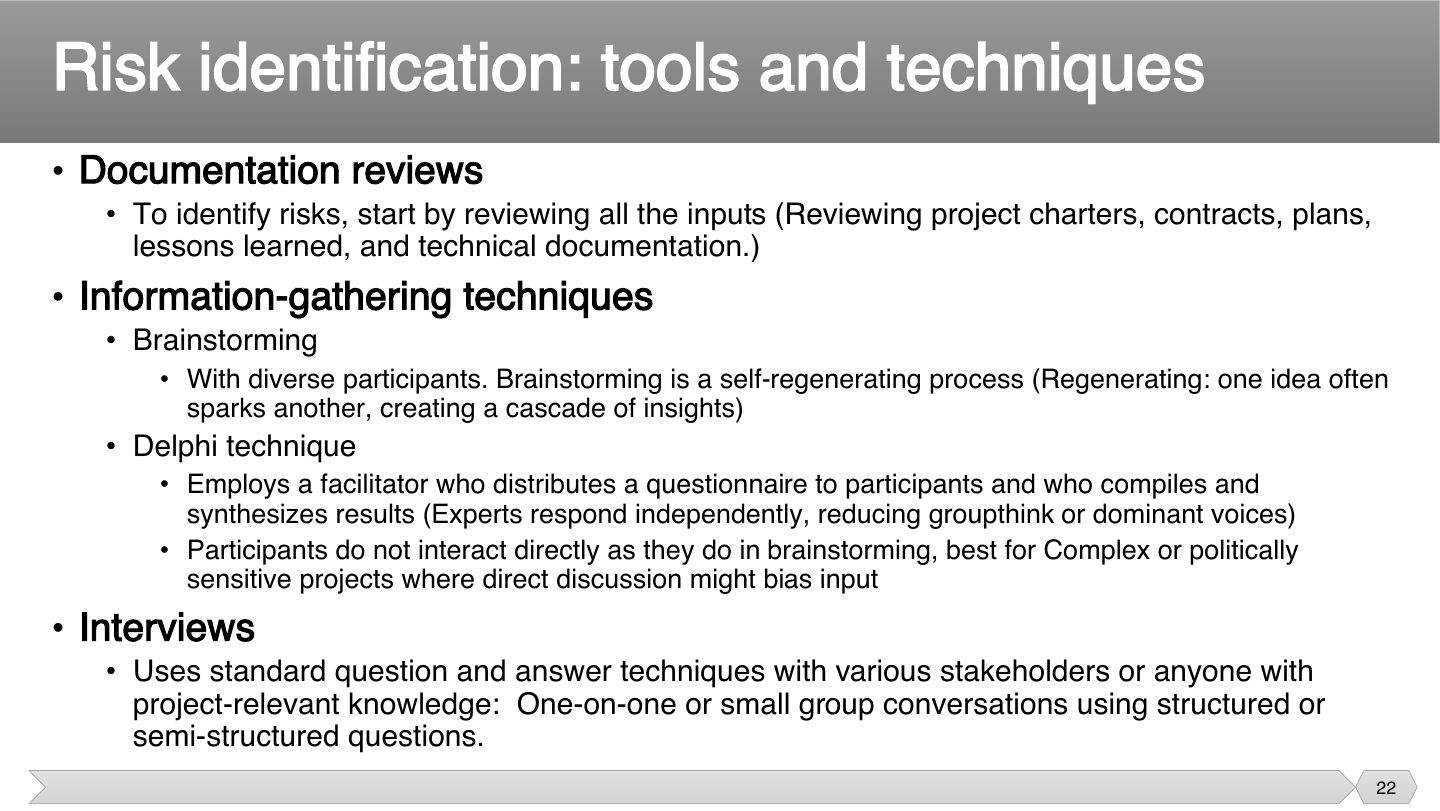
Everyone’s ideas trigger more ideas, so brainstorming is quick and generates many. But louder people can dominate, which is what the next technique tries to avoid.
Anonymity is the key: an expert can’t be swayed by a senior colleague’s opinion. Going through several rounds with a facilitator lets experts converge without pressure, which is what makes Delphi different.
Trap Brainstorming: participants interact. Delphi: they do NOT.
Q2.5 · two risk identification techniques + risk assessment matrix
Q2.4 · two identification techniques; mitigate, prioritize and monitor
Which technique uses a facilitator and anonymous questionnaires so experts don’t influence each other?
List two software risk identification techniques and explain how you would mitigate, prioritize and monitor the risks (Final 251).
Identification: (1) brainstorming with a diverse team, and the Delphi technique where experts answer anonymously to avoid groupthink; (2) checklist analysis built from past projects and the lowest level of the RBS (also: root-cause/5-whys, assumptions analysis, interviews, SWOT). Prioritize: estimate probability and impact, compute risk exposure RE = P × I, and place each risk in the probability-impact matrix; actively manage only the top-10 high risks. Mitigate: choose a strategy per threat: avoid (remove the cause), transfer (contract or insurance), mitigate (more testing, simpler design), or accept with a contingency reserve; give every risk an owner. Monitor: keep a top-10 risk list and the risk register updated, review risks in weekly meetings and status reports, watch triggers, and hold reassessments and audits at milestones.
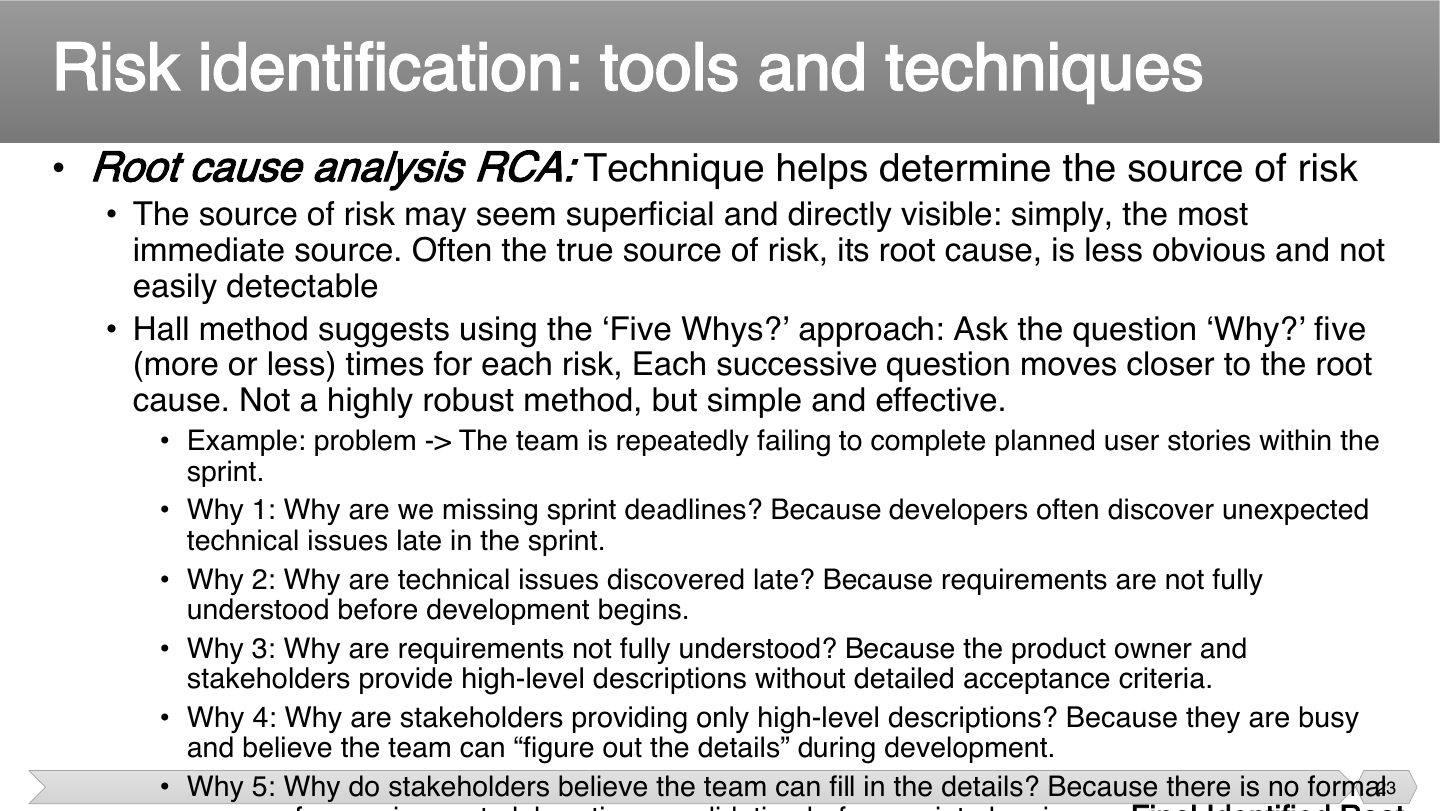
“Missed the sprint” is a symptom. Fixing it directly doesn’t help if the real cause lies deeper. Asking “why?” repeatedly gets you there: root cause analysis treats what’s actually causing the problem.
Notice that the answer is about process, and not about any one person. Good 5 Whys usually ends at something you can change.
Your team keeps missing sprint goals. Apply the 5 Whys briefly.
Why missed? Issues found late. Why late? Requirements unclear before coding. Why unclear? Stories lack acceptance criteria. Why? Stakeholders expect the team to fill gaps. Why? No formal requirement-elaboration step before sprint planning → that root cause is the risk to address.
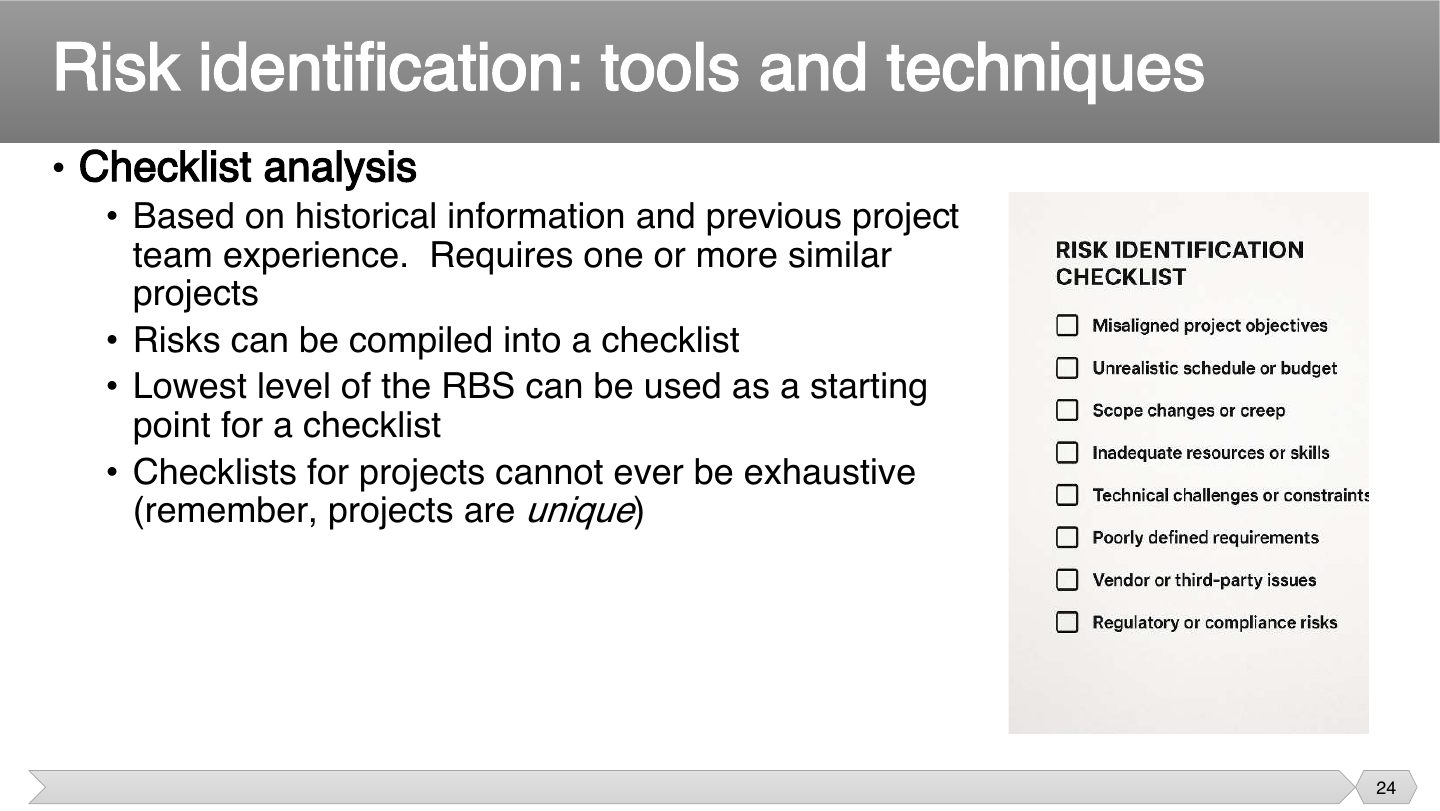
Past projects tell you what tends to go wrong, which saves time. But every project is unique, so a checklist is a starting point, and treating it as complete means missing what’s new here.
Q2.5 · two risk identification techniques + risk assessment matrix
Q2.4 · two identification techniques; mitigate, prioritize and monitor
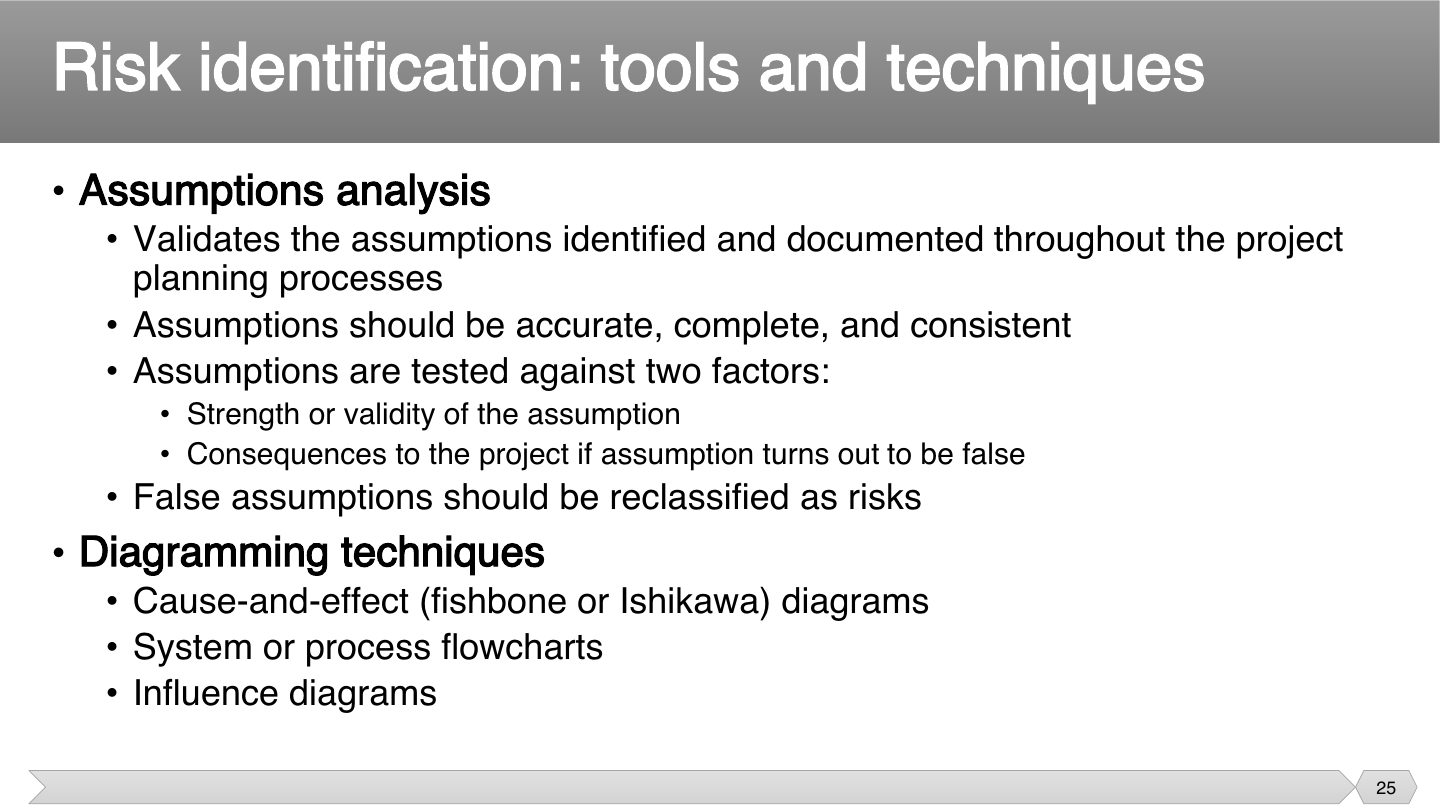
Every plan quietly assumes things, like “the vendor delivers on time”. If that’s shaky and would hurt badly if false, you’ve found a risk nobody listed. That’s what assumptions analysis looks for.
Pictures show connections that lists can hide. Fishbone diagrams show causes, flowcharts show steps, and influence diagrams show what affects what.
An assumption turns out to be false. What should you do?
Against which two factors are assumptions tested?
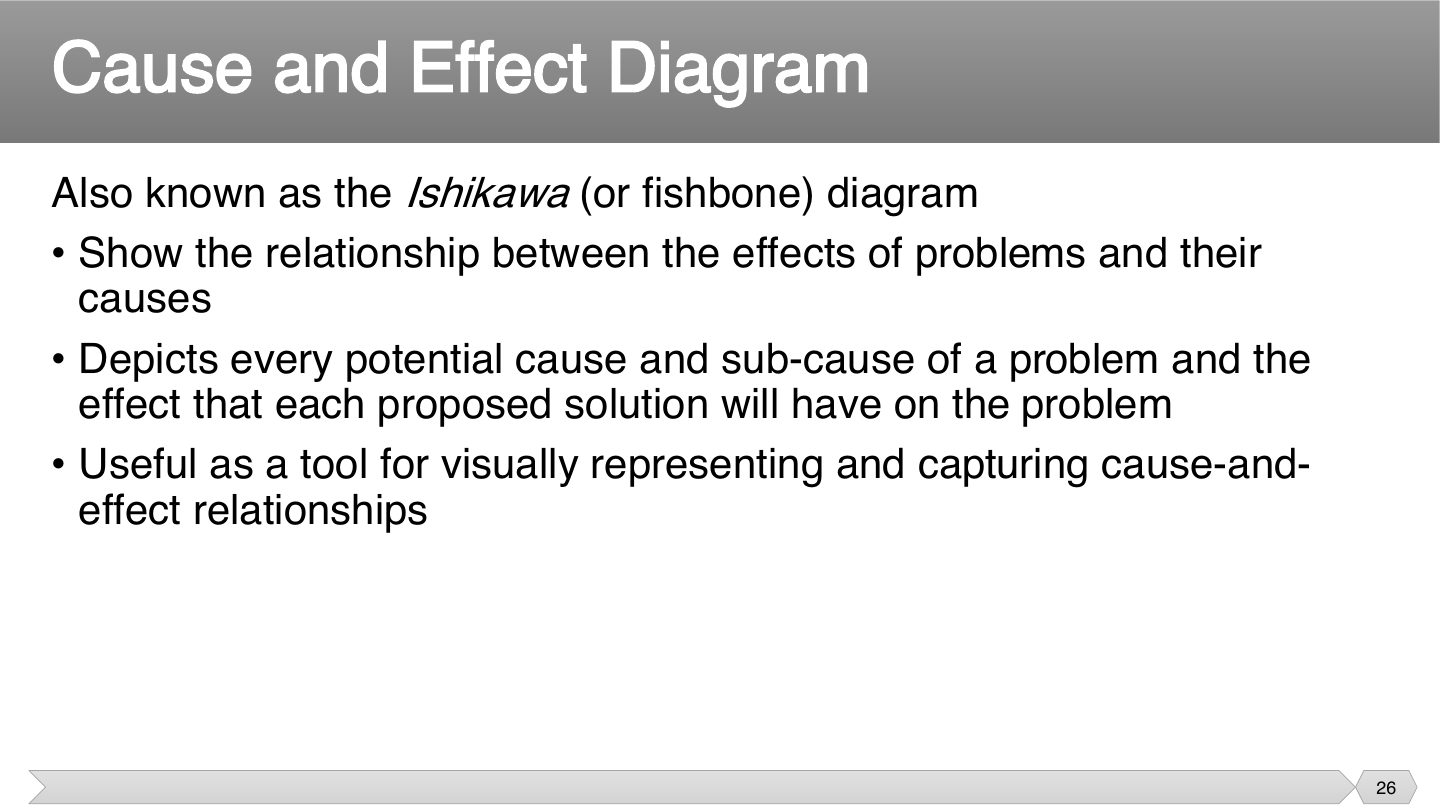
You start from the problem and work backward through the possible causes. It’s drawn like a fish skeleton, and that layout helps a group explore every branch rather than stopping at the first idea.
What does a fishbone diagram show?
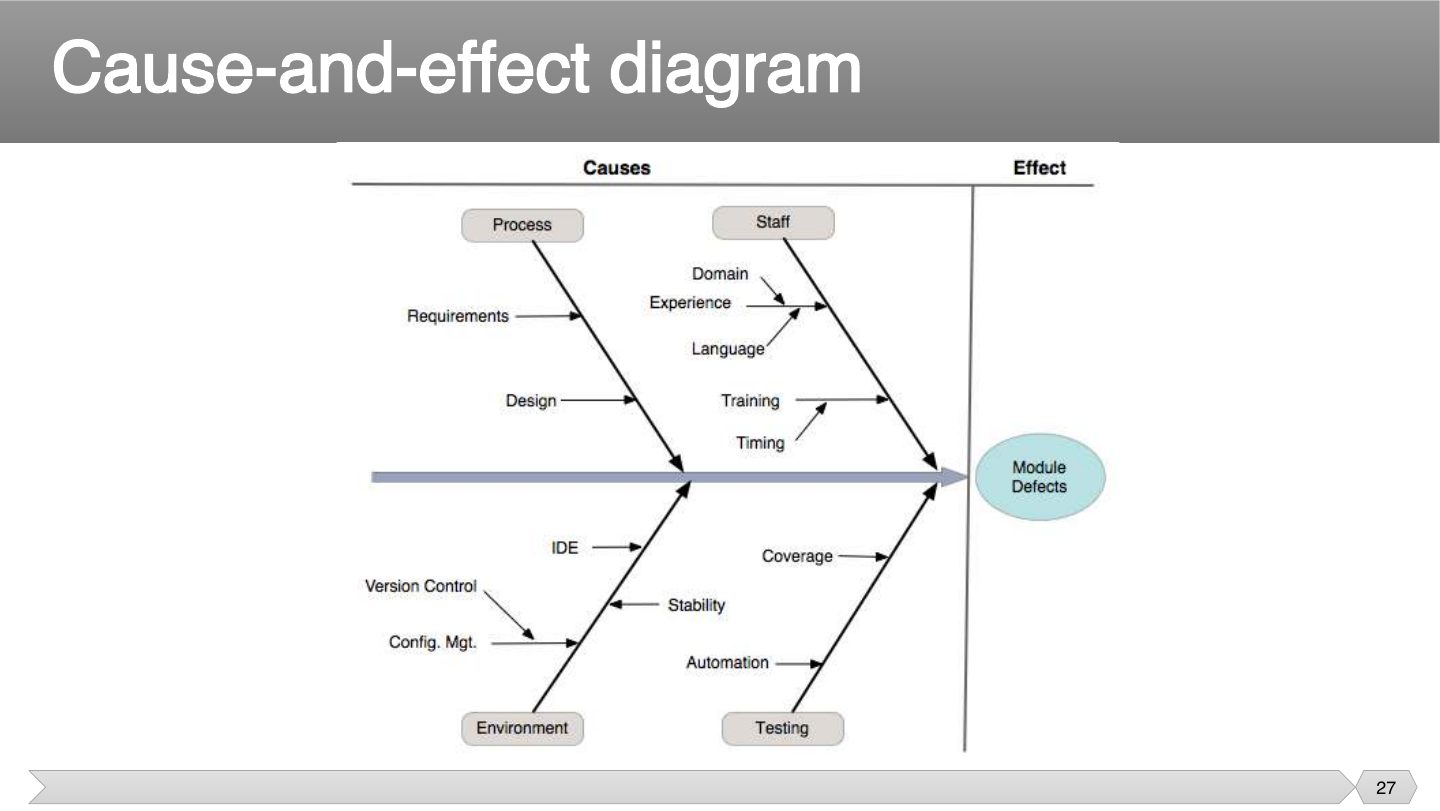
Example effect: module defects. Bones: process, staff, design, environment, testing, requirements.
In the example, what sits at the fish’s “head”?
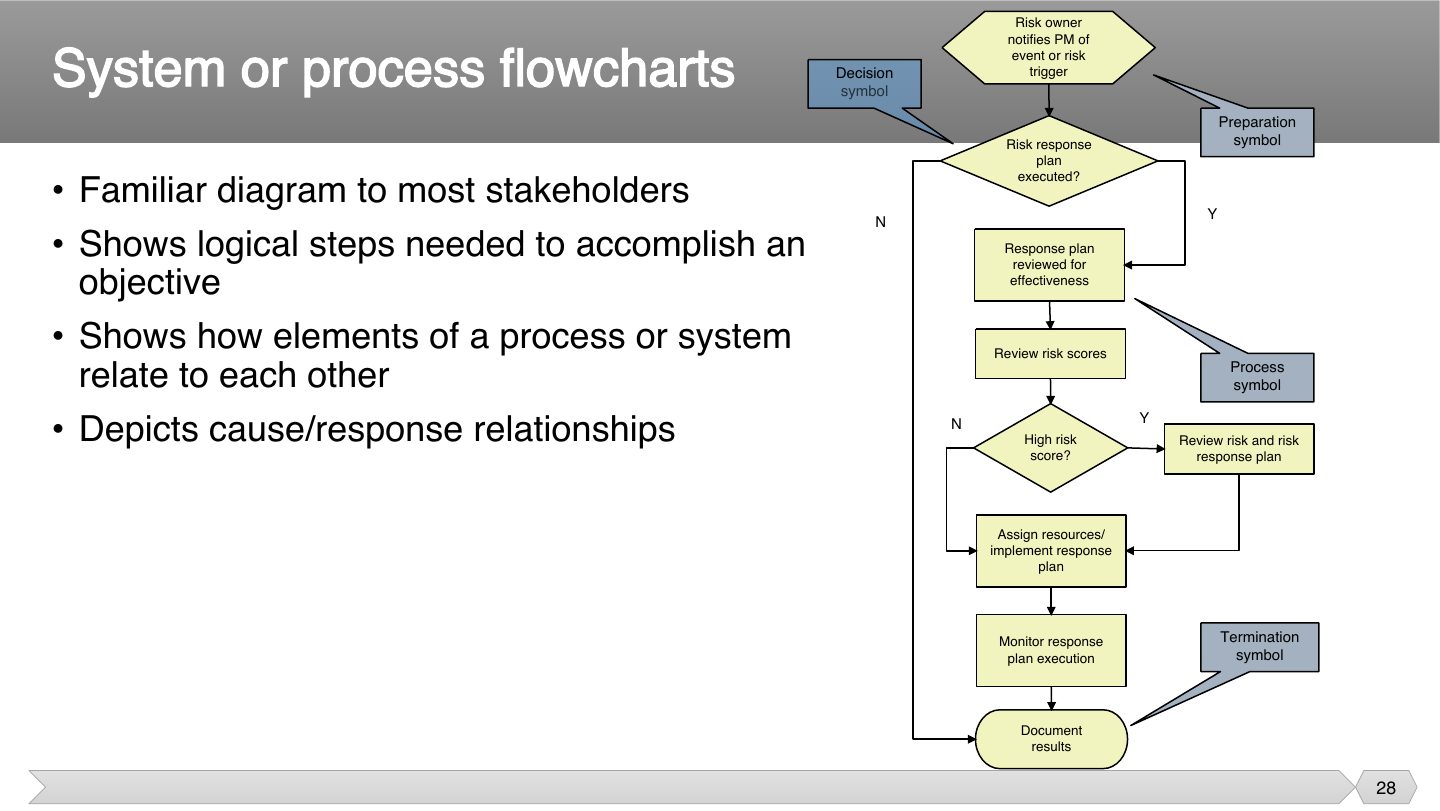
Everybody can follow a flowchart, even those who aren’t technical. This one shows when a risk owner acts, which removes confusion about what happens once a trigger occurs.
What triggers the process in this flowchart?
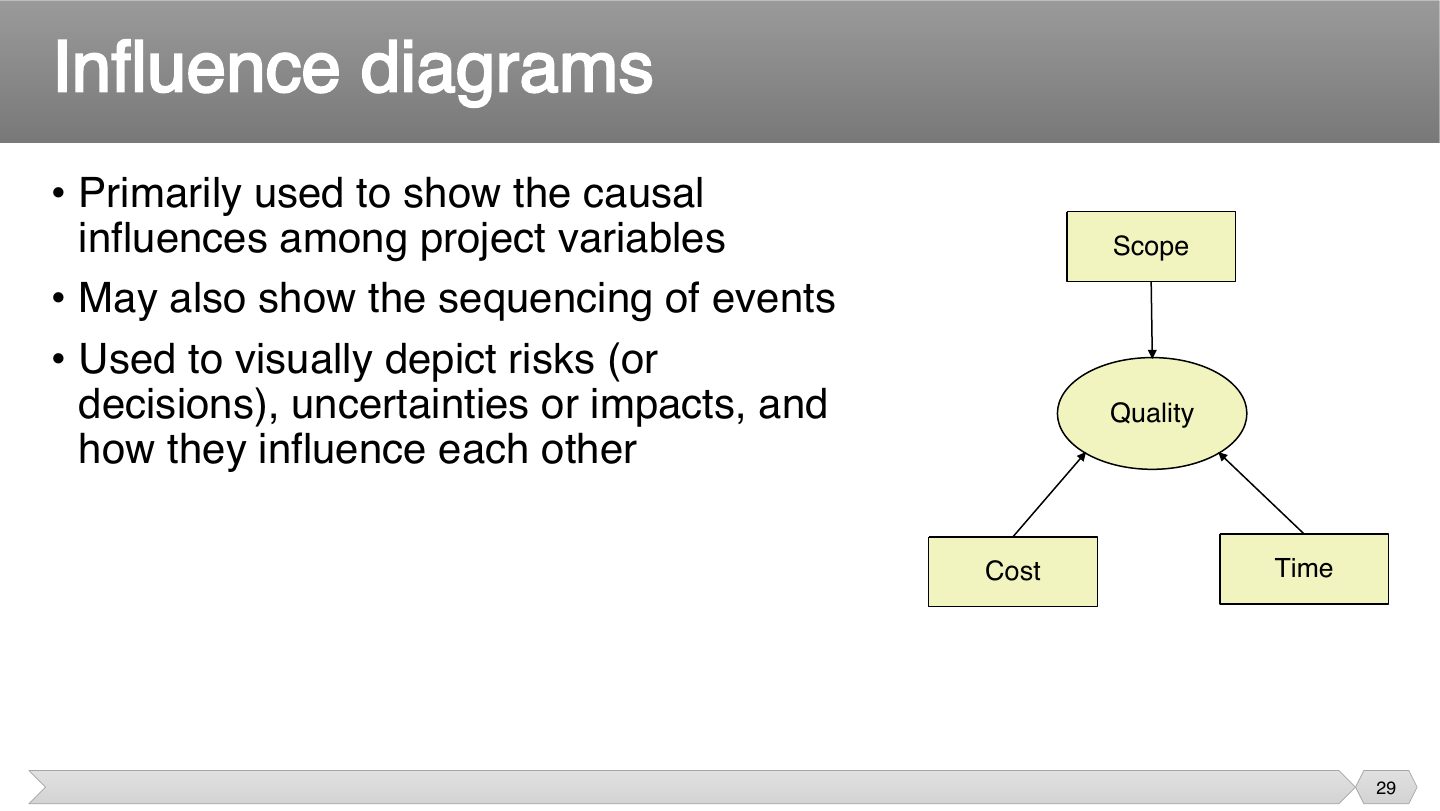
Boxes and arrows show how changing one thing affects others. If scope grows, how does that change quality, cost and time? An influence diagram makes those knock-on effects visible.
What do influence diagrams mainly show?
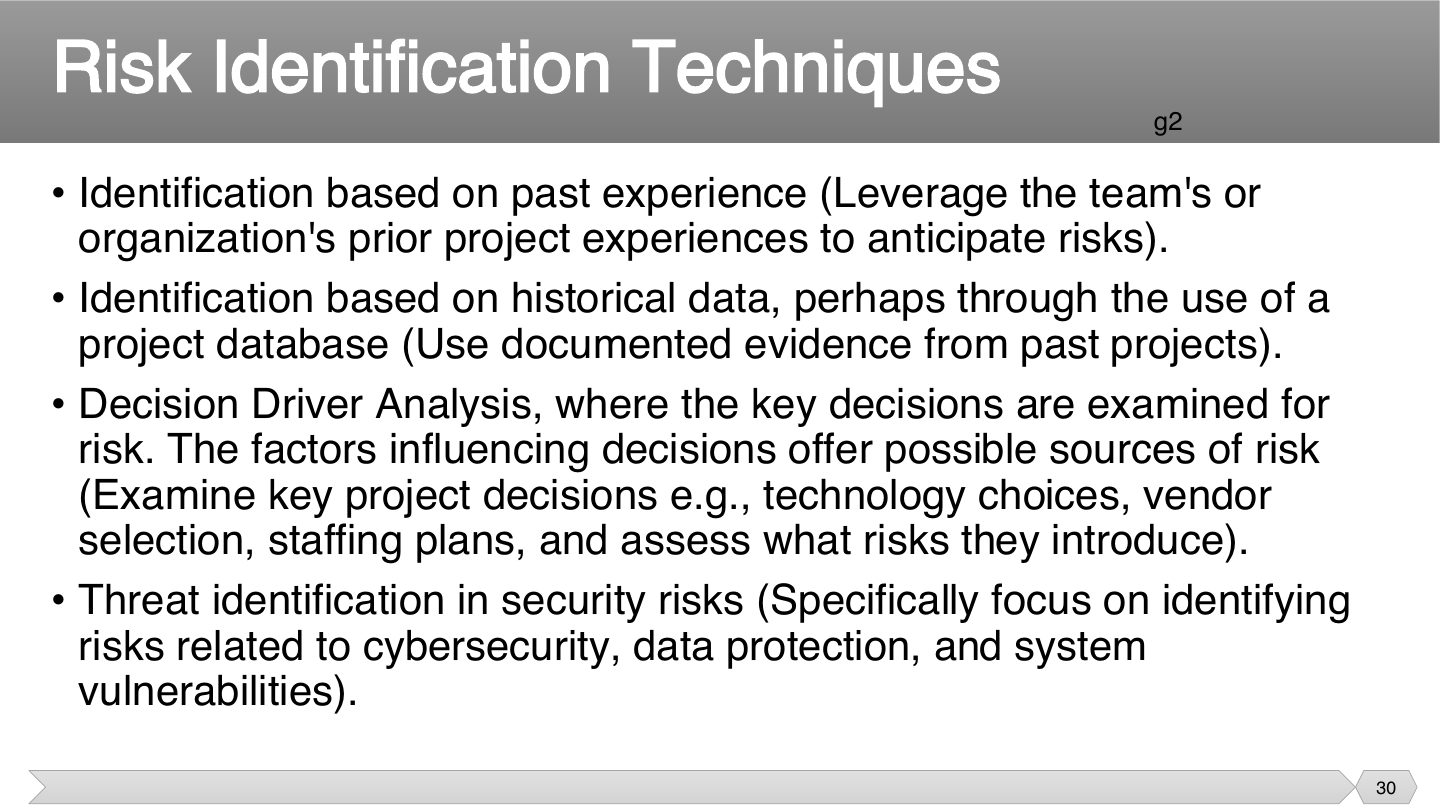
These add to the earlier techniques. Decision driver analysis is the one to note: it asks whether a choice was made for good reasons, because decisions made for politics or fashion are often risky.
Key decisions are examined to see if they were made for sound reasons. Which technique is this?
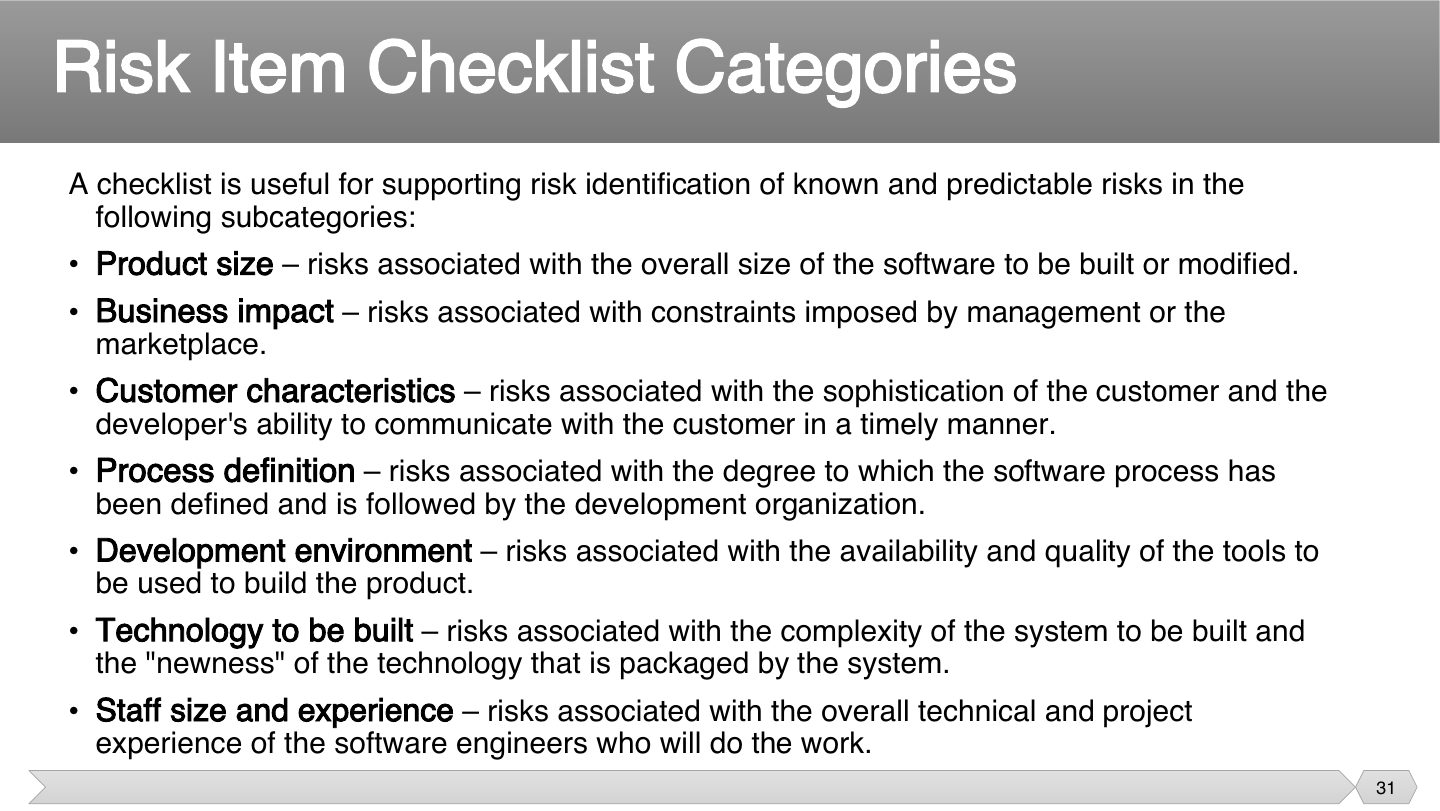
A checklist works best when it’s organized, so that no area gets forgotten. Each group has its own slide with concrete questions you can ask. A long list of questions like this is good for known and predictable risks.
Memory trick “People Buy Cool Phones During Tech Sales”: Product size, Business, Customer, Process, Development env, Technology, Staff.
Which is a risk item checklist category?
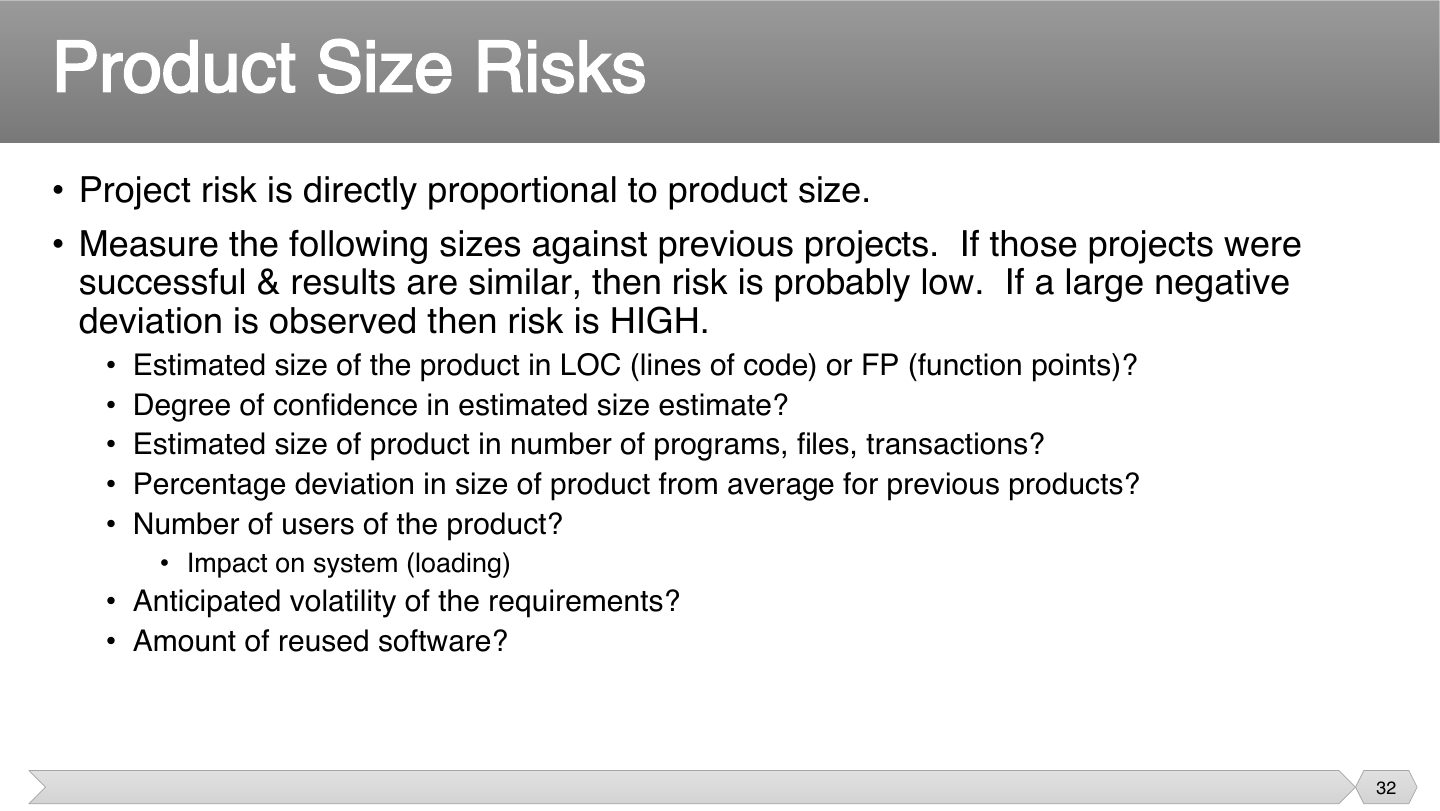
Bigger software has more parts to go wrong and more people to coordinate. Compare with your past projects: if this one is much larger than anything you’ve done, your experience may not apply.
How does project risk relate to product size?
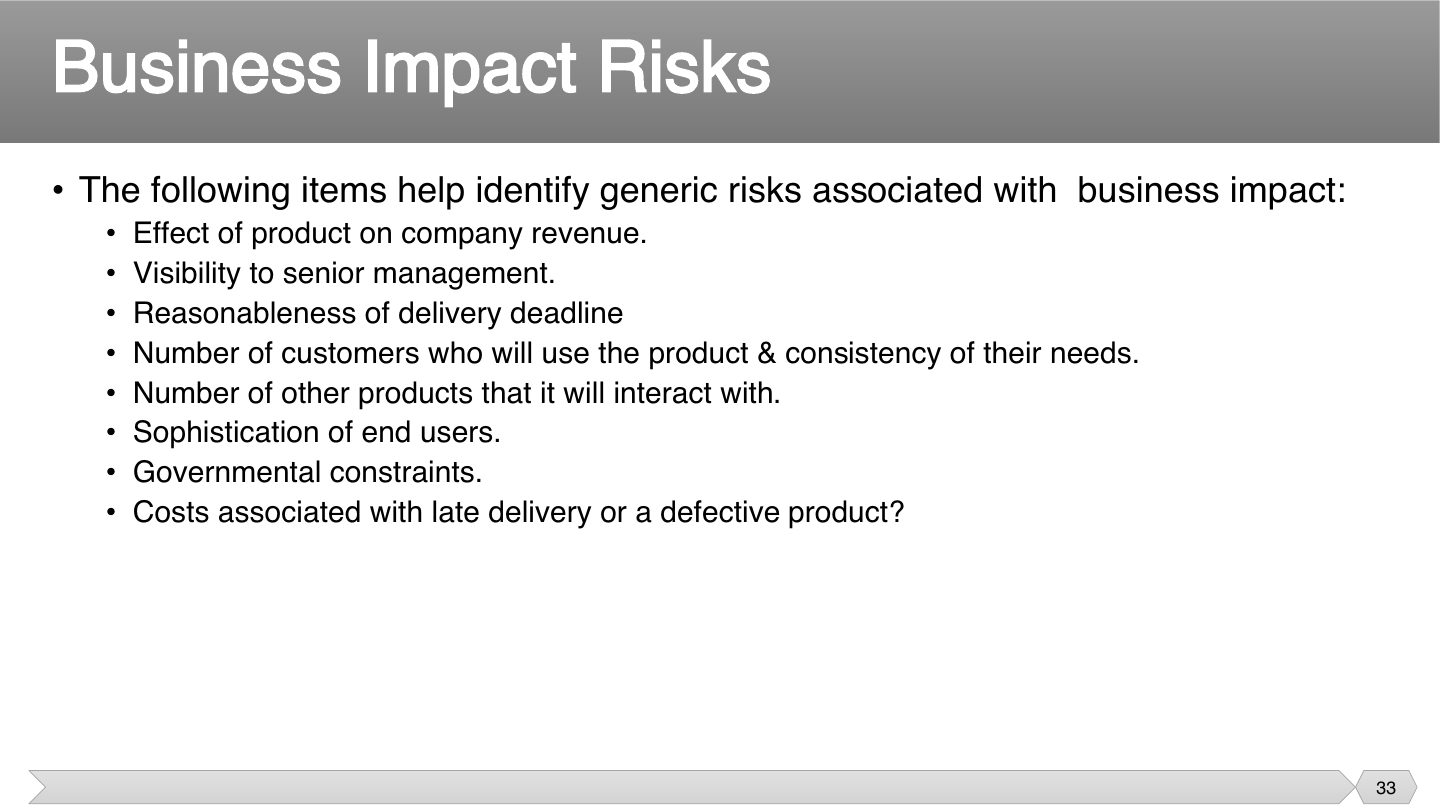
These look outside the code. A product that matters greatly to revenue gets more pressure, while tight deadlines and regulations can limit your options, and those limits are a source of business impact risk.
Which question checks business impact?
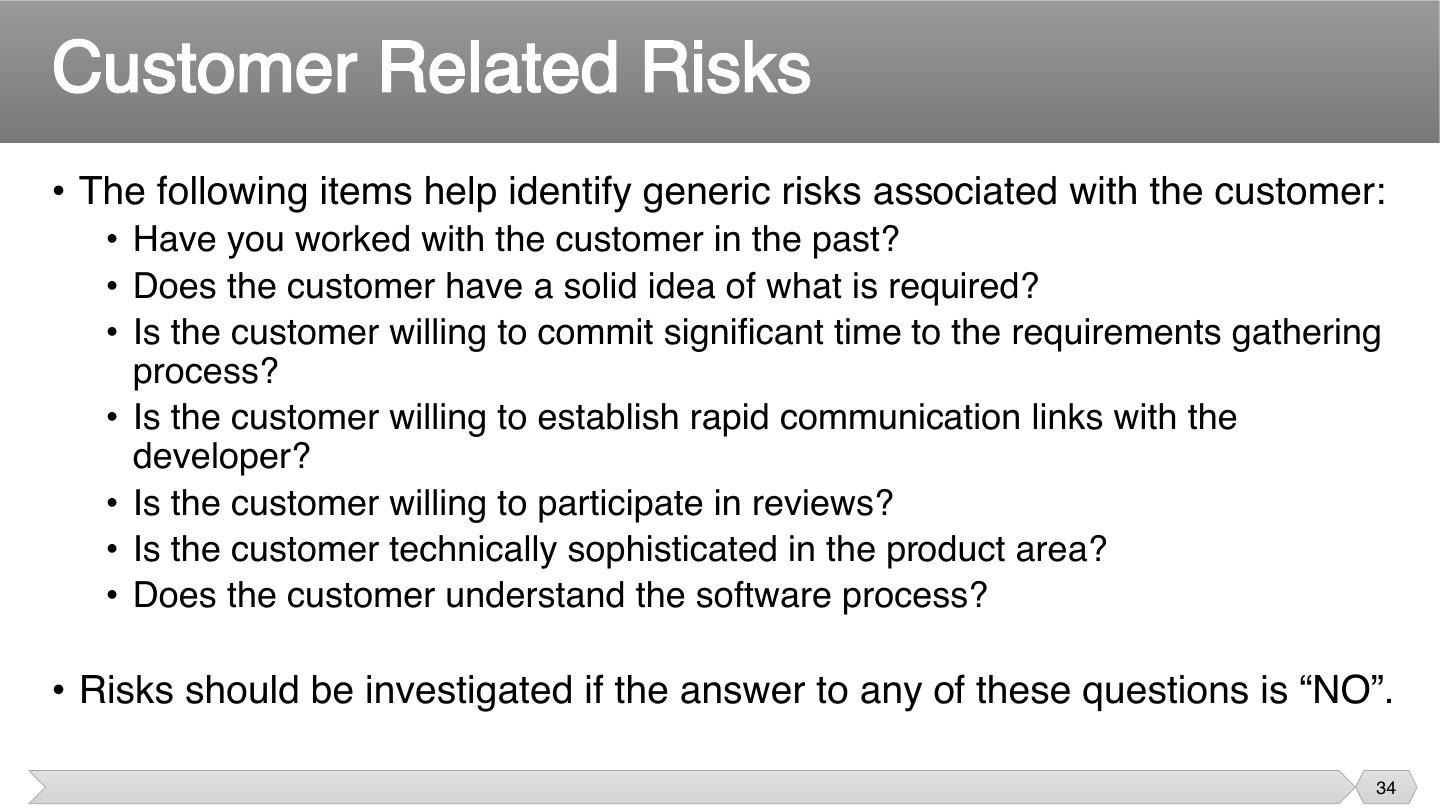
A customer who’s unsure of what they want, or won’t spend time with you, is a real threat to the project. So ask these questions early. Any “NO” means you need to look more closely.
A customer won’t commit time to requirements gathering. What does this indicate?
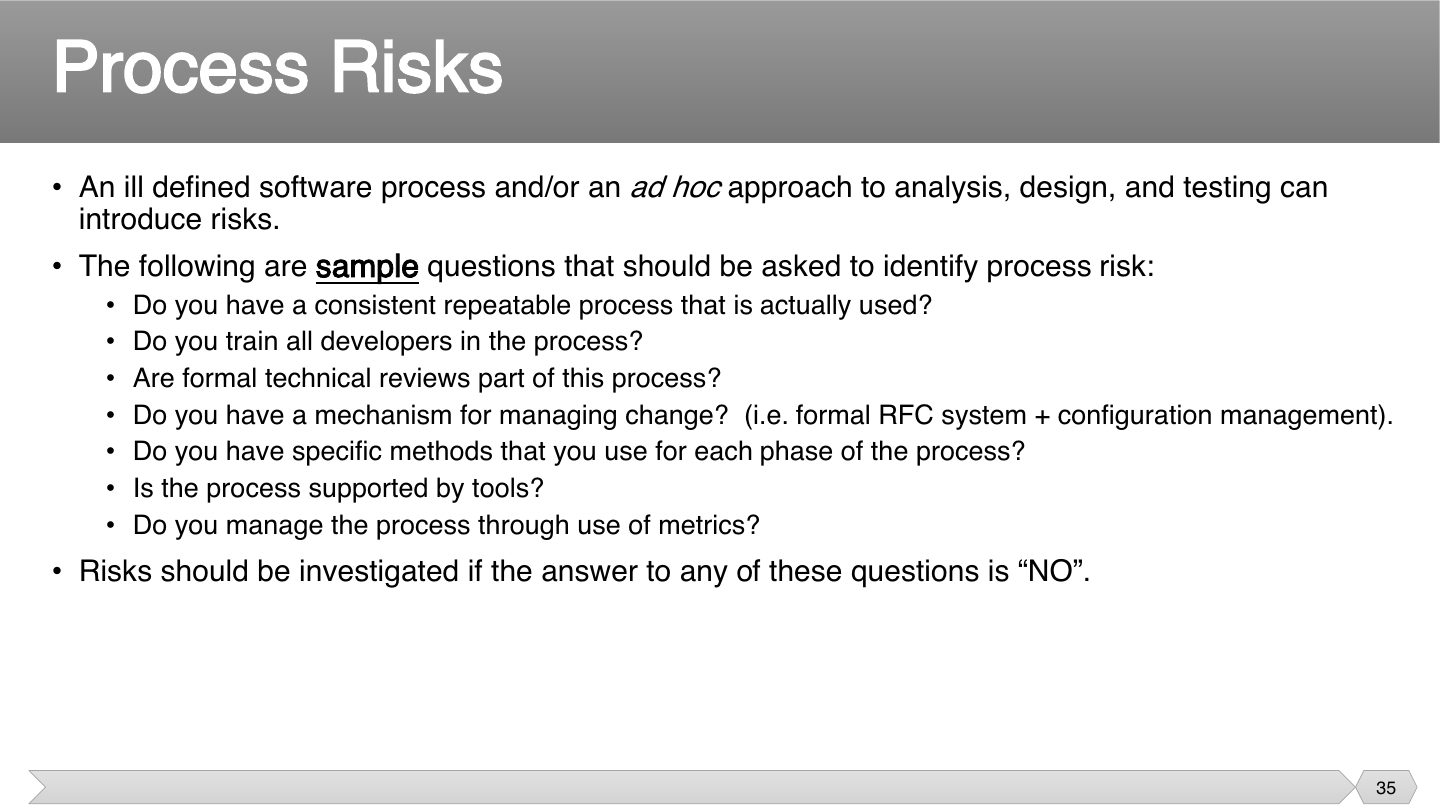
If the process only exists on paper, or people aren’t trained on it, you can’t rely on it. Quality then depends on individual heroics, which is what makes an ad hoc approach risky.
Which indicates a process risk?
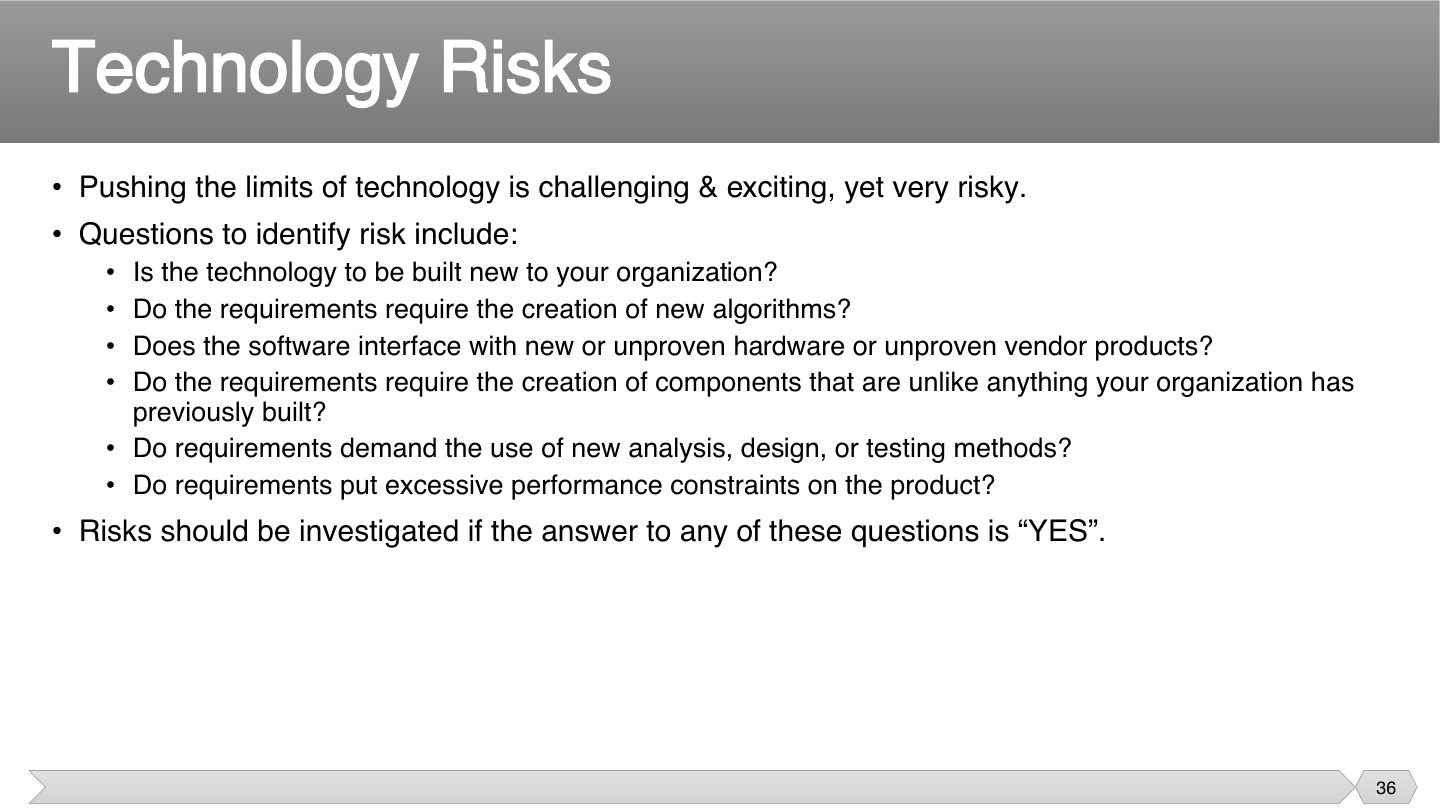
New technology might not do what’s promised, and your team has no experience with it. Note how this checklist flips: for technology, a “YES” is the warning sign.
Trap Technology checklist flips: “YES” means risk. The others: “NO” means risk.
In the technology risk checklist, answering “YES” to questions signals risk.
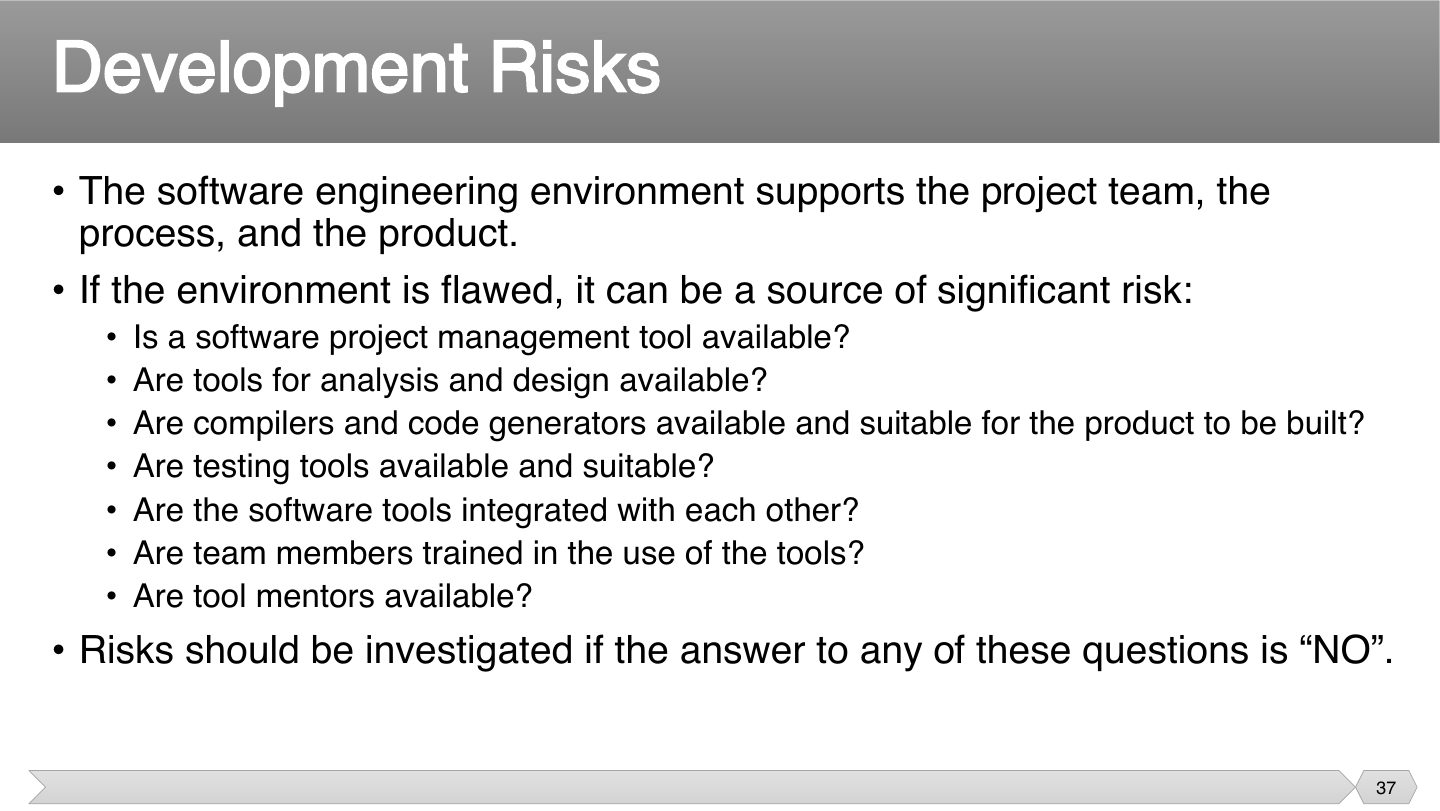
Poor tools slow people down and cause mistakes, and they’re easy to overlook during planning. Here a “NO” is the warning sign, as with most of these checklists.
Compilers and tools aren’t suitable for the product. What kind of risk is this?
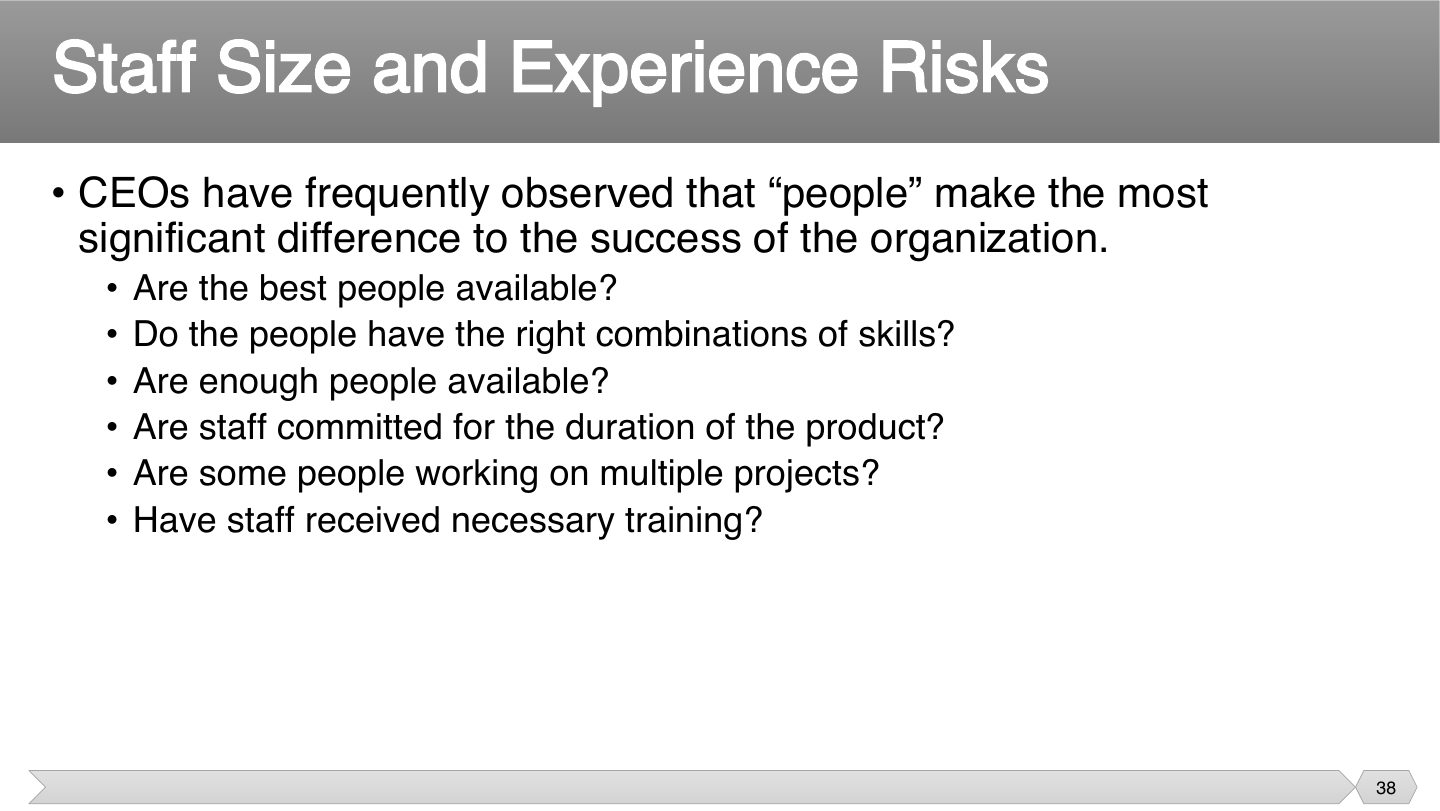
Having the right number of people isn’t enough. Someone split across three projects is really a fraction of a person, which is why committed is one of the questions. People make the biggest difference to success.
A key person is split across several projects. Which risk does this raise?
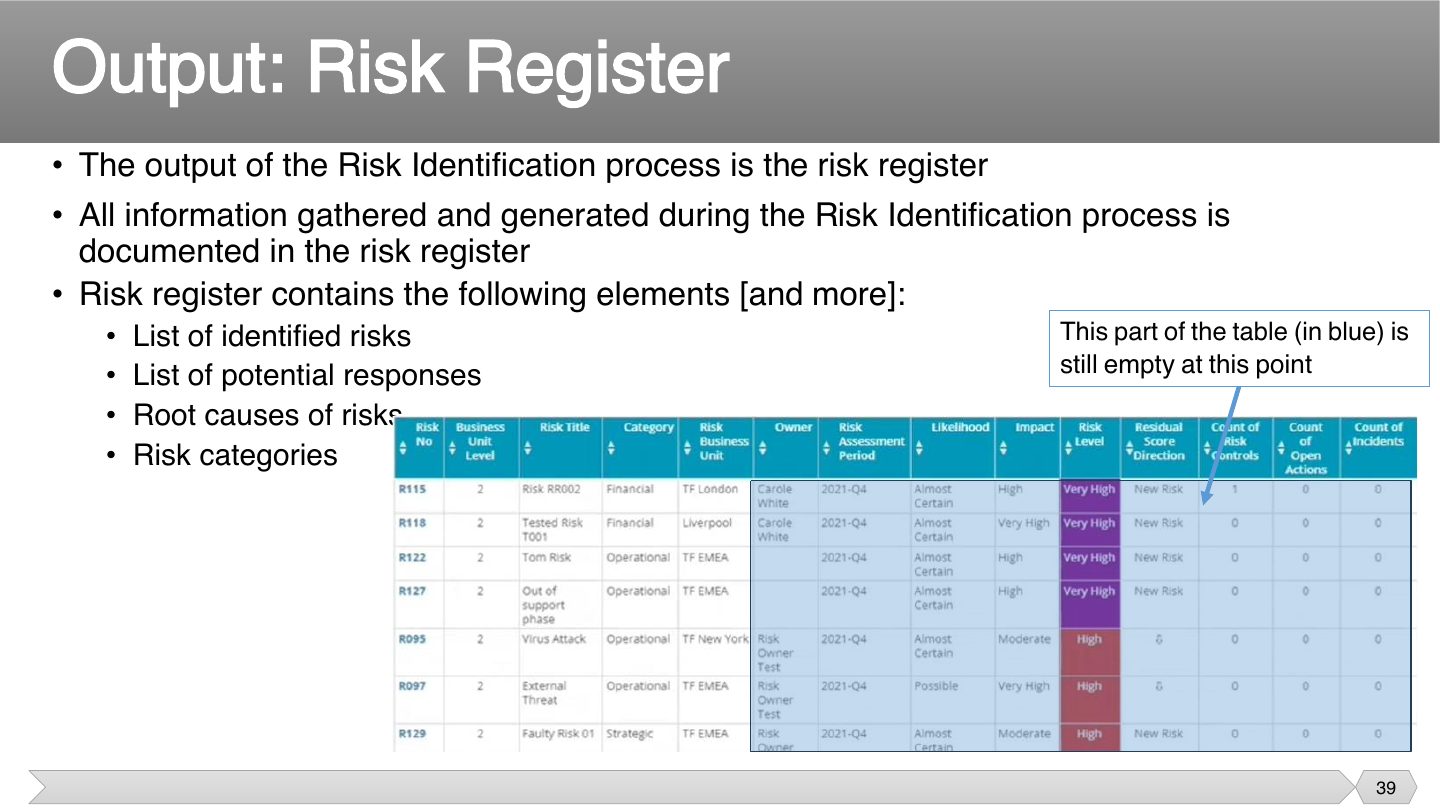
The risk register is one living document, filled in gradually. At this point, you know what the risks are, but you haven’t yet scored them, which is why those columns are empty.
What is the main output of risk identification?
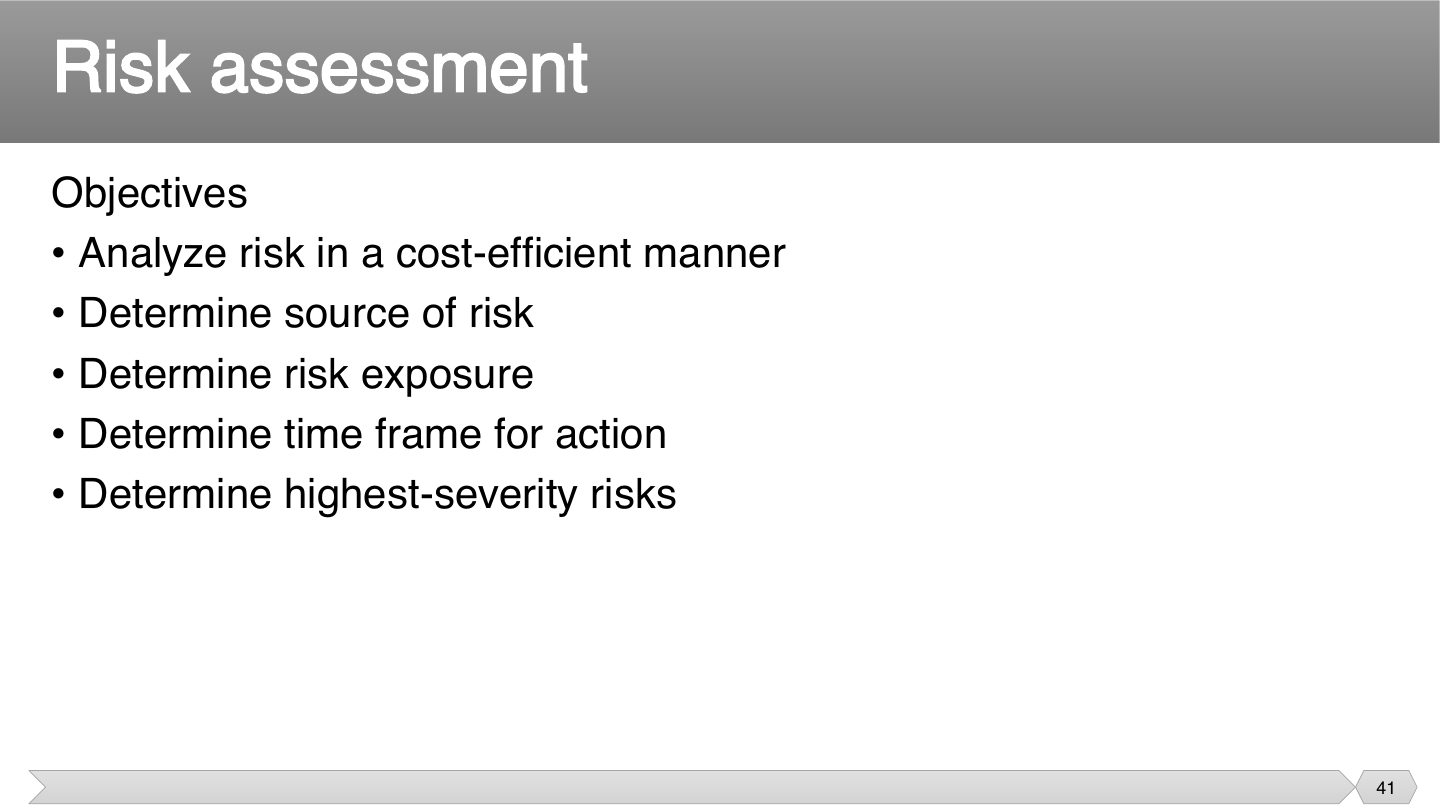
You can’t address every risk, so analysis tells you where to spend effort. Cost-efficient is the catch: don’t spend more analyzing a risk than it could ever cost you.
Which is an objective of risk assessment?
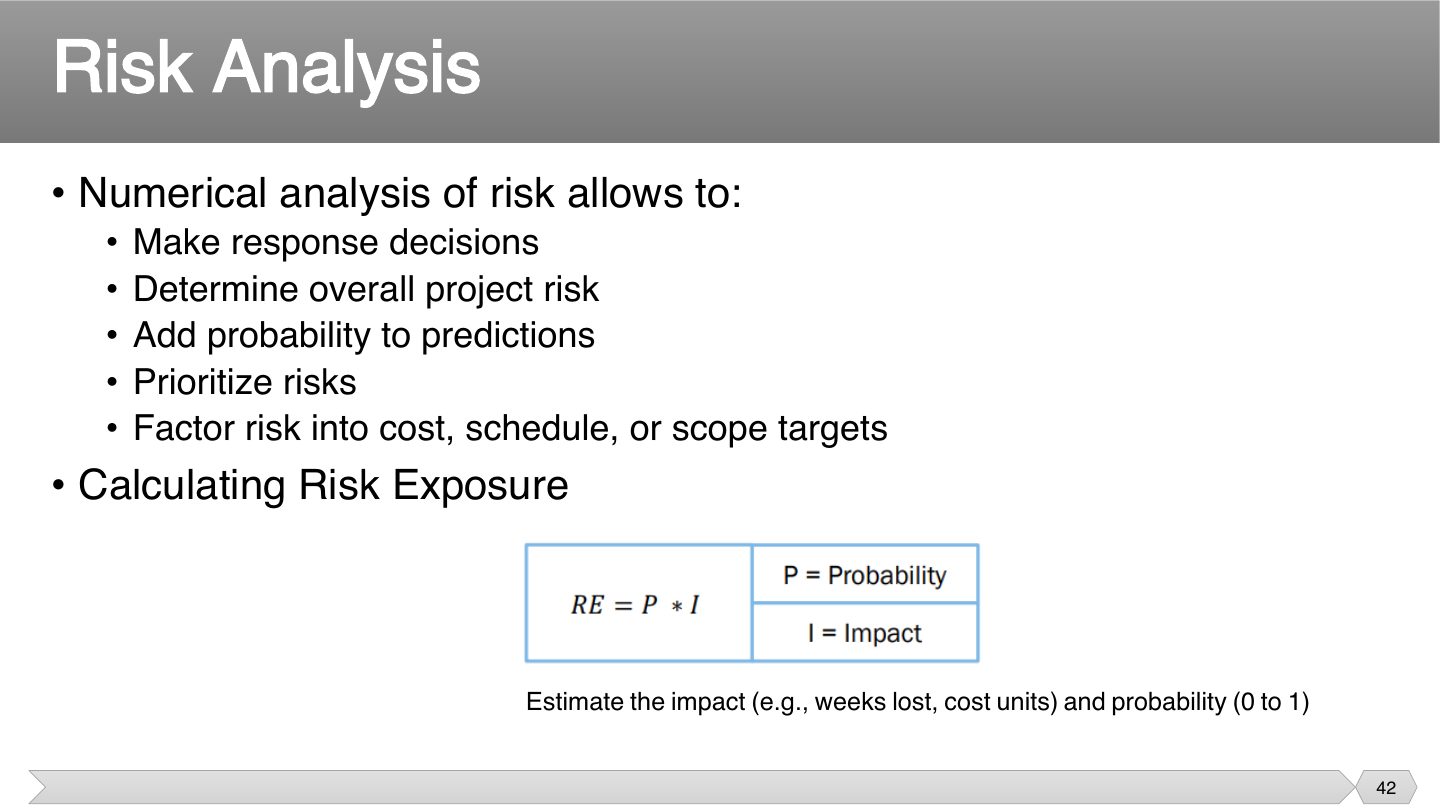
Numbers let you compare very different risks fairly. RE = P × I turns “likely but small” and “unlikely but huge” into figures you can rank.
Related question: Q2.5 · how a risk assessment matrix helps decide which risks need action
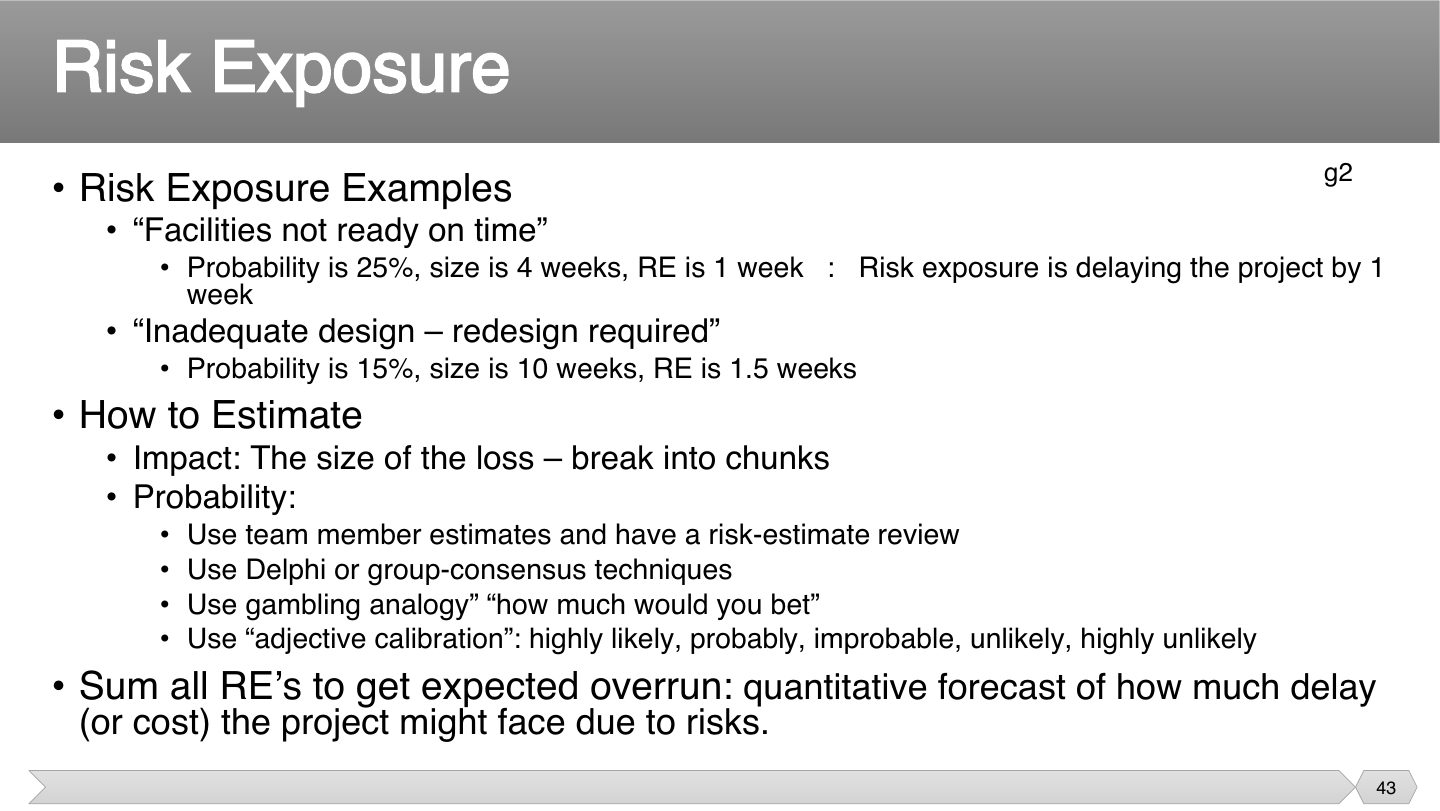
Don’t read 1 week as the actual delay. If it happens, you lose 4 weeks; 1 week is the expected cost, so it tells you how much to protect against.
Add up every exposure, and you get the likely total overrun. That’s useful for setting a reserve, as it’s based on the risks you’ve actually listed.
A risk has 20% probability and would cost 15 days. Its risk exposure is:
Two risks have RE of 1 week and 1.5 weeks. The expected overrun is:
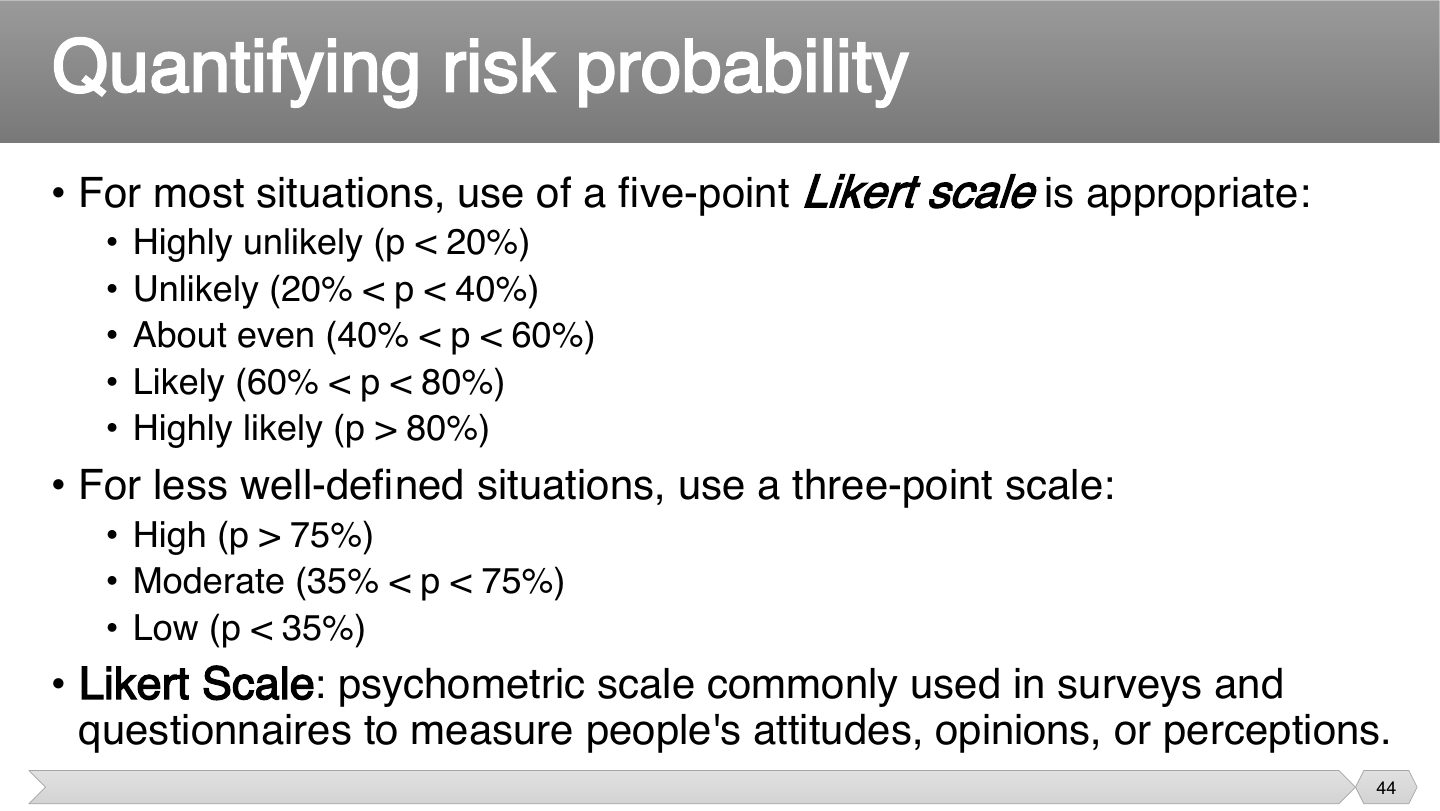
People give very different meanings to “likely”. A Likert scale ties words to ranges, so that a whole team means the same thing when it scores a risk.
If you can’t reasonably tell 20% from 40%, a finer scale gives false precision. So when information is thin, use three points.
On the five-point scale, “Likely” means:
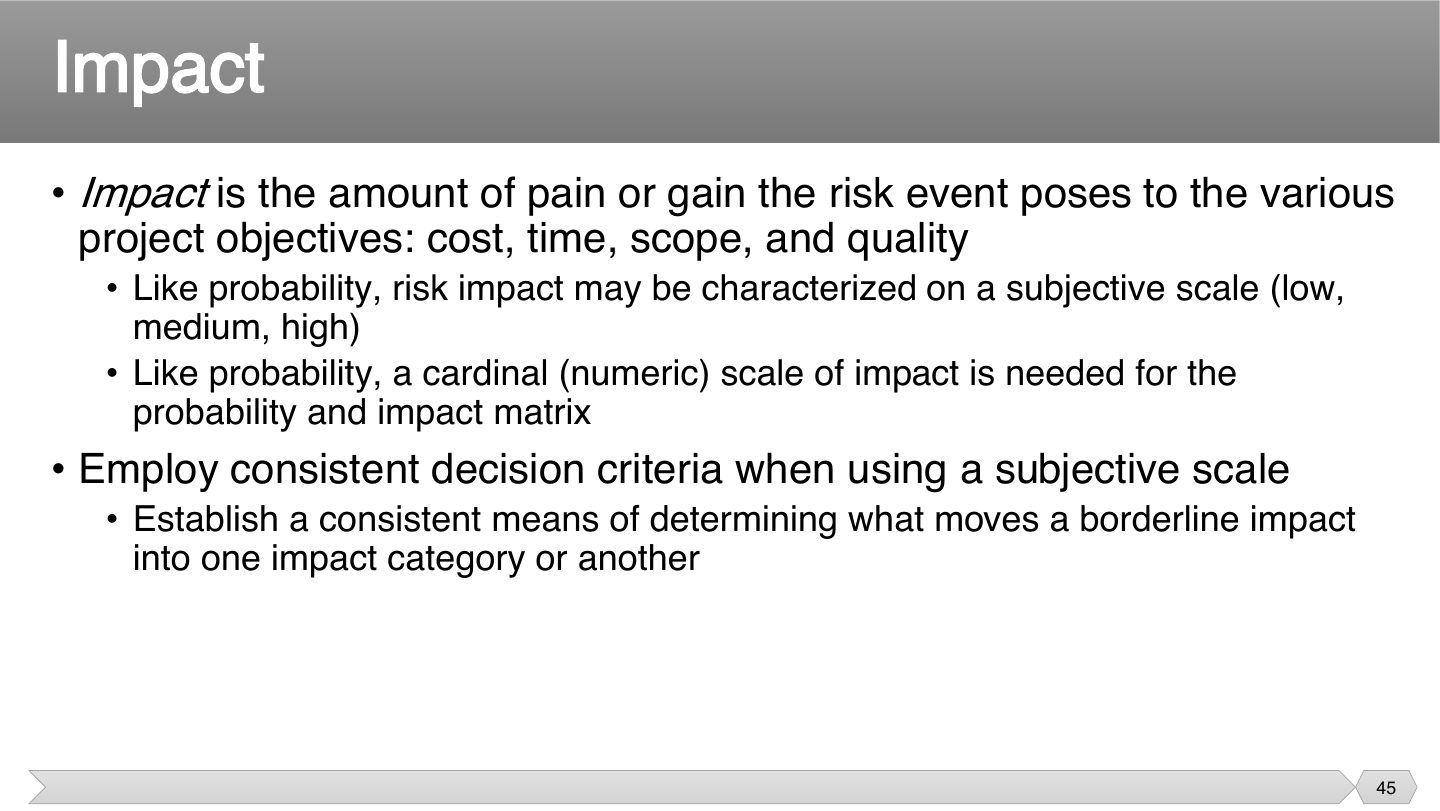
Impact isn’t just money, as a risk may barely affect cost and seriously harm quality. Consistent criteria matter, or two people will score the same risk differently.
Which objectives can impact affect?
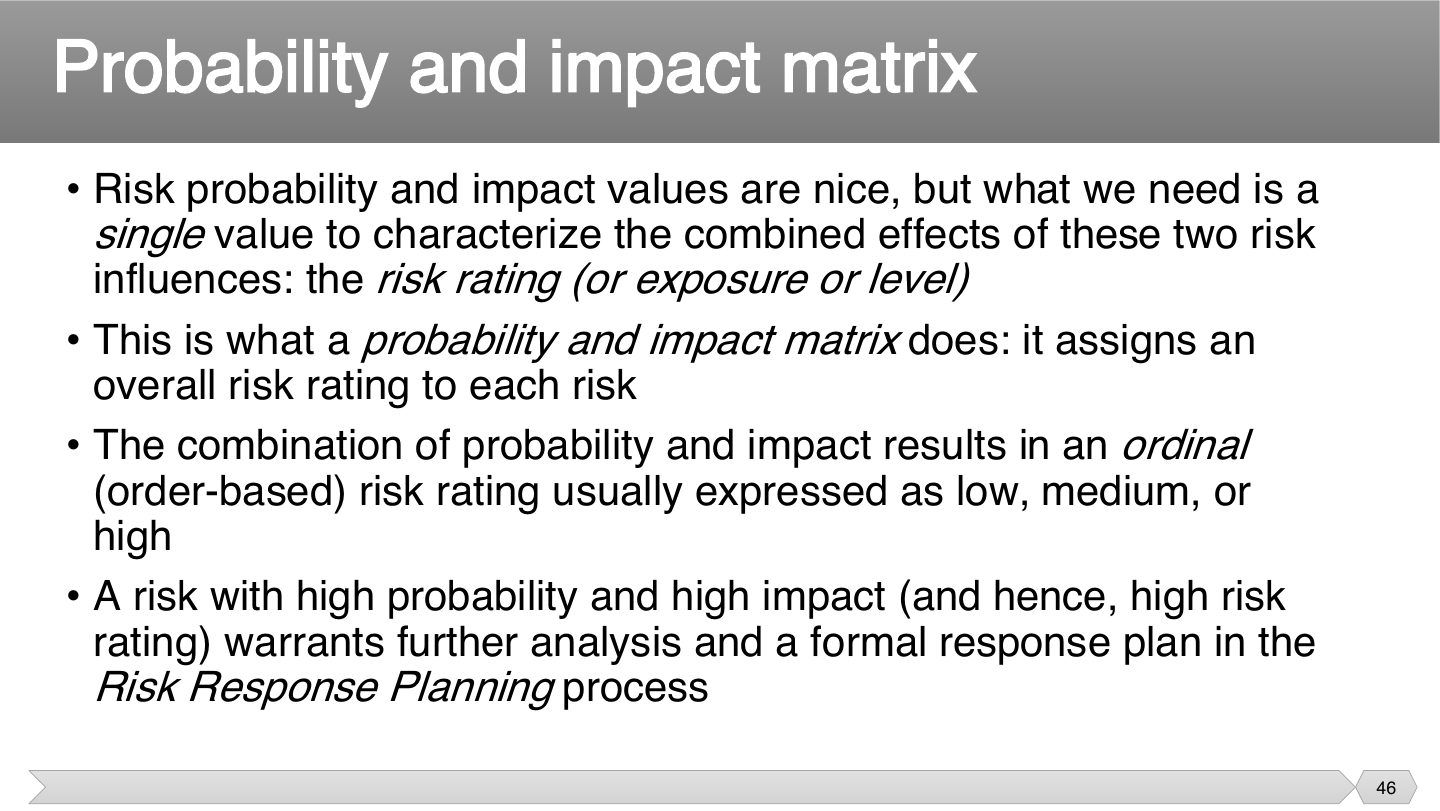
Probability or impact alone can mislead. A likely but trivial risk may matter less than an unlikely disaster. The matrix combines both so you can compare risks on one scale.
If it’s both likely and damaging, hoping for the best isn’t acceptable, so it gets a formal response plan. Low ones may only need watching.
Q2.5 · two risk identification techniques + risk assessment matrix
Q2.4 · two identification techniques; mitigate, prioritize and monitor
How does a risk assessment matrix help decide which risks need immediate action?
It combines each risk’s probability and impact into a single rating (low, medium, high, extreme) on one grid, so risks become comparable. Risks in the high-probability/high-impact cells get formal response plans and owners immediately; medium ones are planned or monitored; low ones go on a watch list. This focuses limited time and money on the few risks that matter most (80/20).
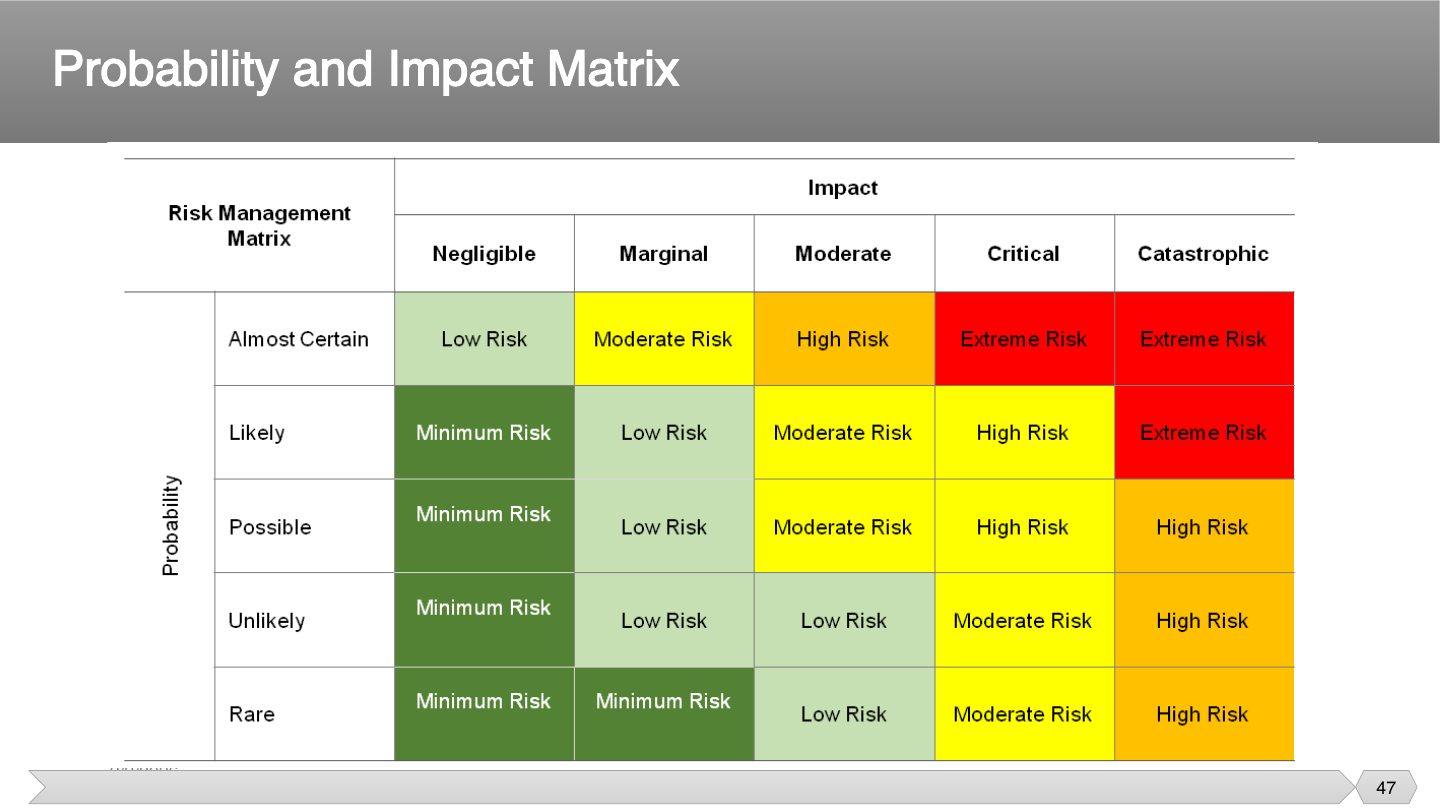
A risk has high probability and high impact in the matrix. What’s its rating?
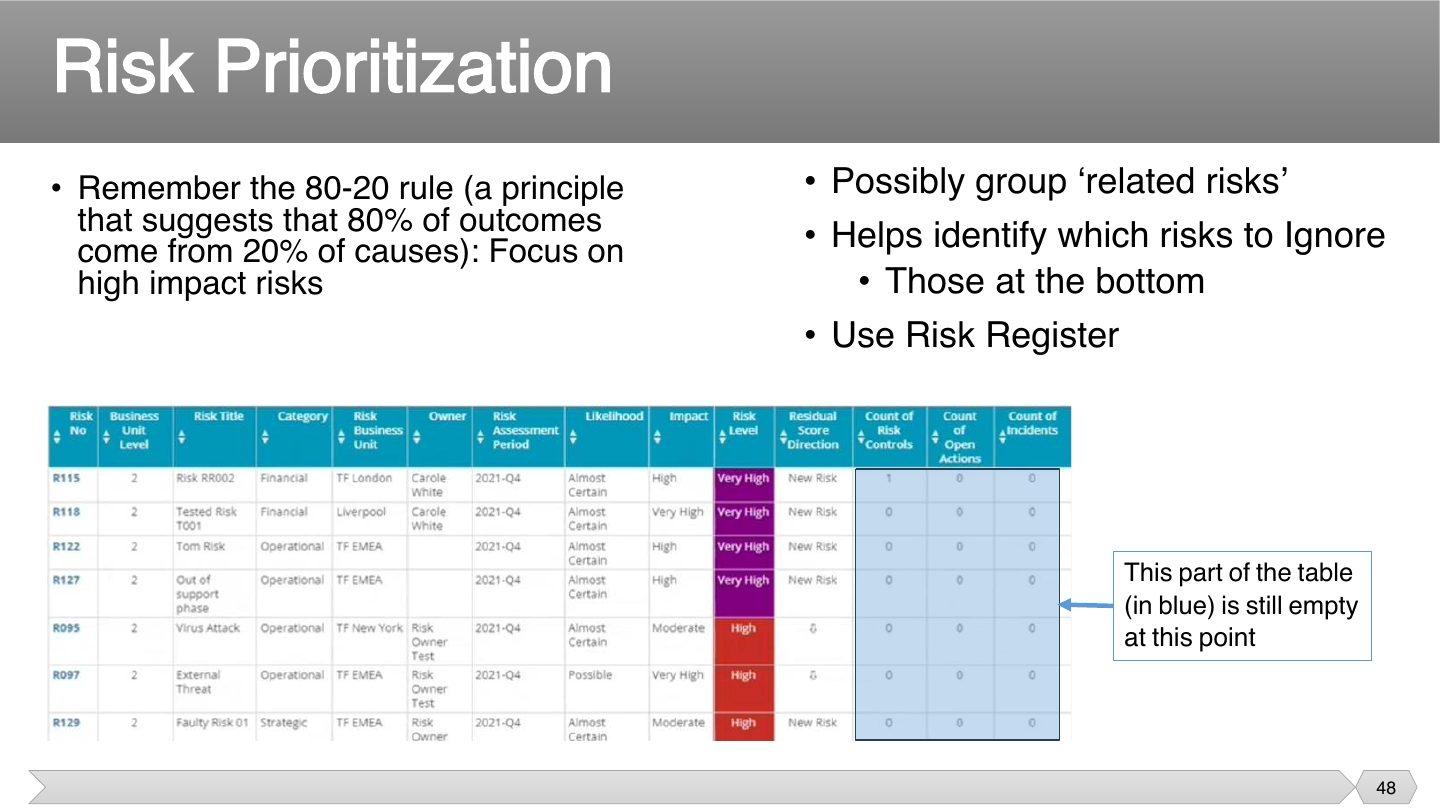
Your time is limited, and a small number of risks usually cause most of the damage. 80-20 gives you permission to ignore the bottom of the list and focus where it counts.
What does the 80-20 rule suggest about risks?
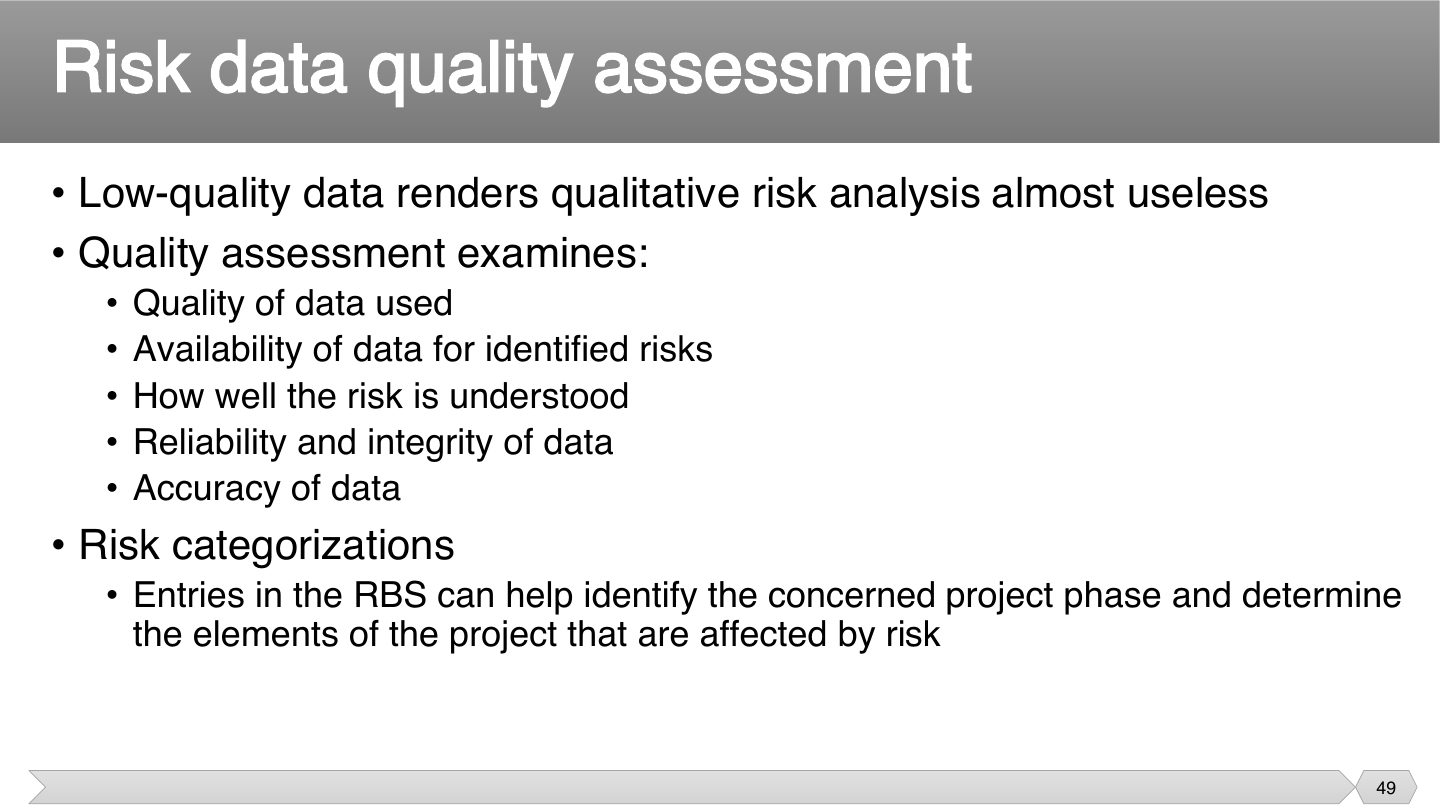
A score based on guesswork looks scientific without being reliable. So before trusting the ranking, ask how good the information behind it is. Otherwise, you may focus on the wrong risks.
What is the effect of low-quality risk data?
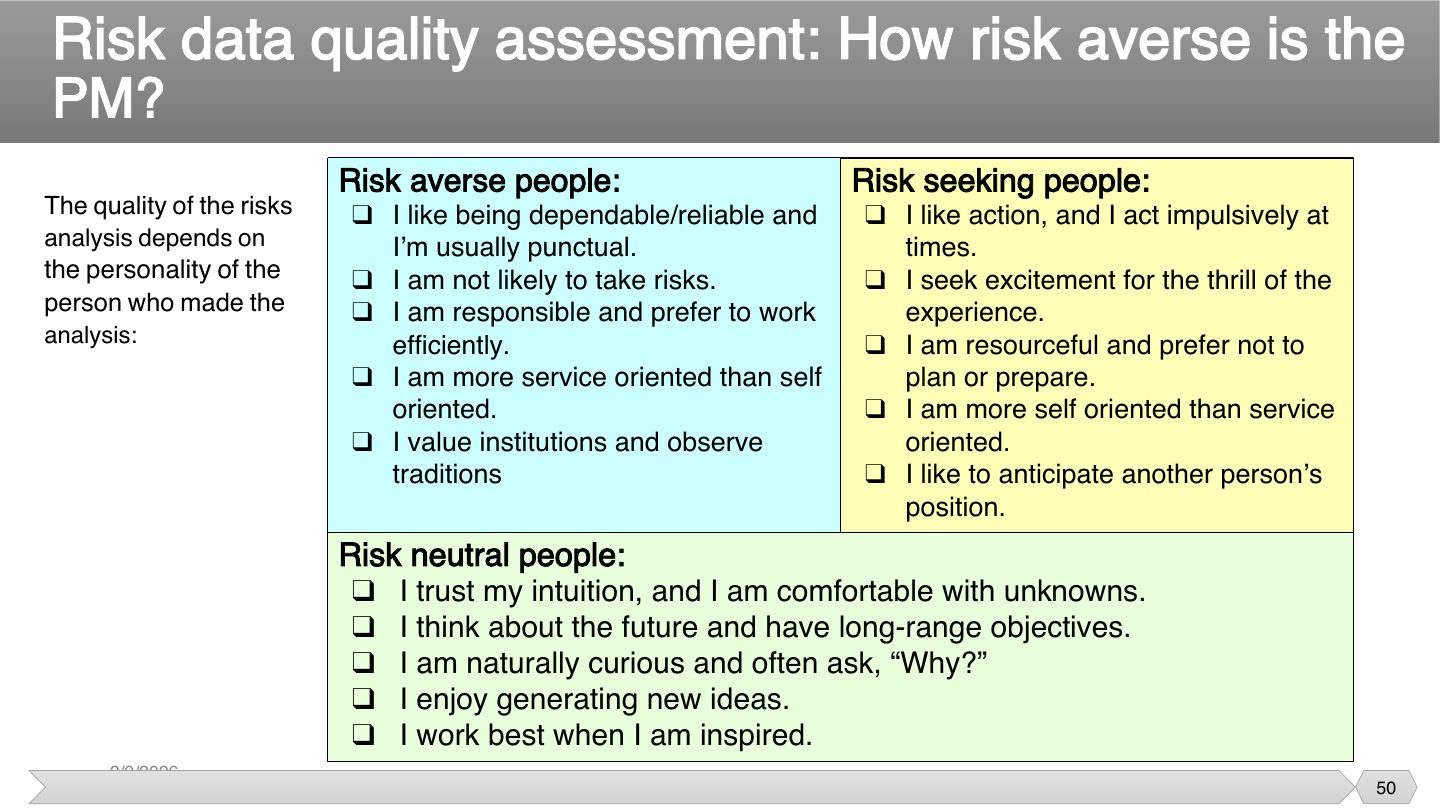
The same risk can look minor to a risk seeker and alarming to someone who’s risk averse. Knowing this bias helps you, so involve several people, rather than relying on one person’s judgment.
Why does the analyst’s personality matter?
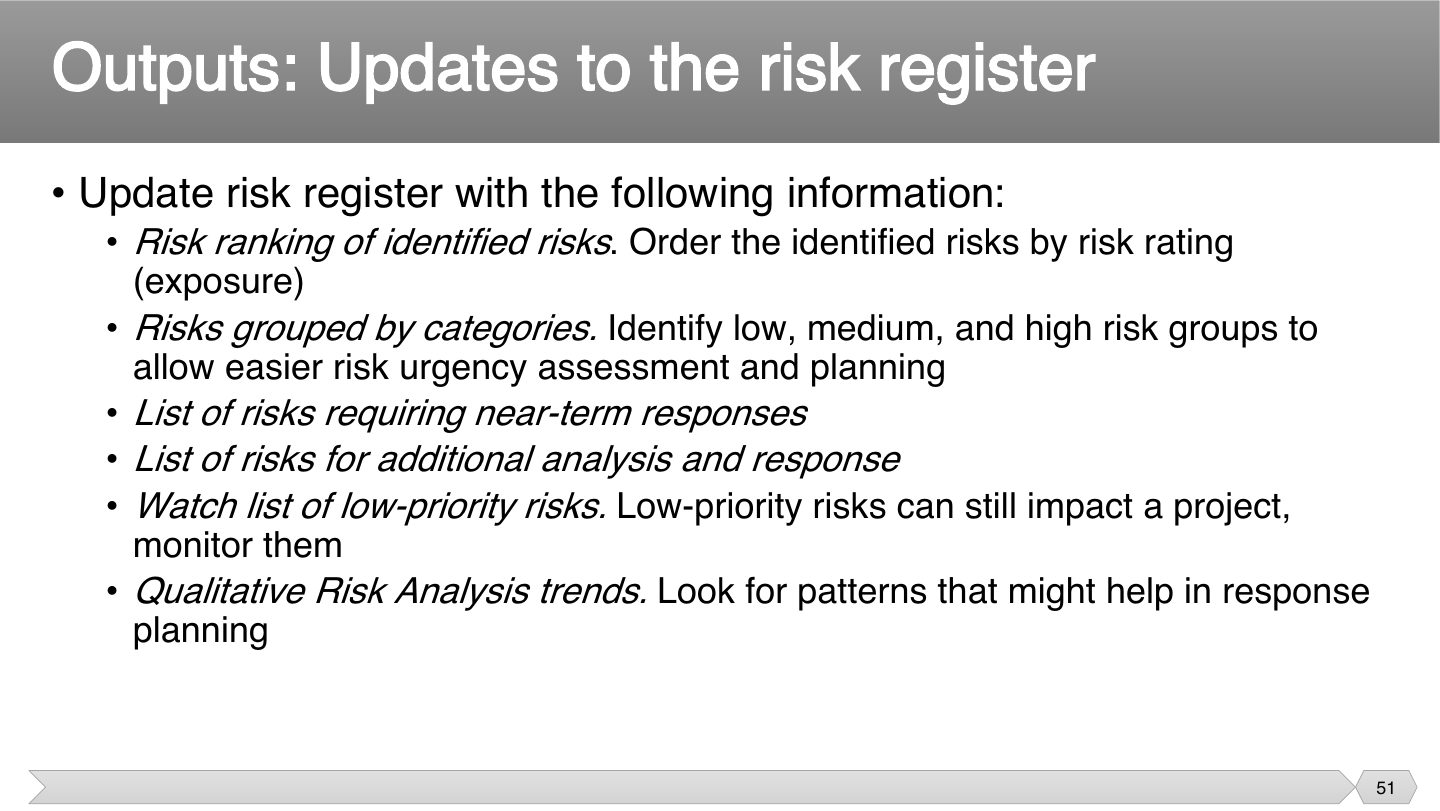
The register grows as you go. A watch list is the clever part: low risks aren’t deleted, just checked now and then, because they can still grow.
Where do low-priority risks go?
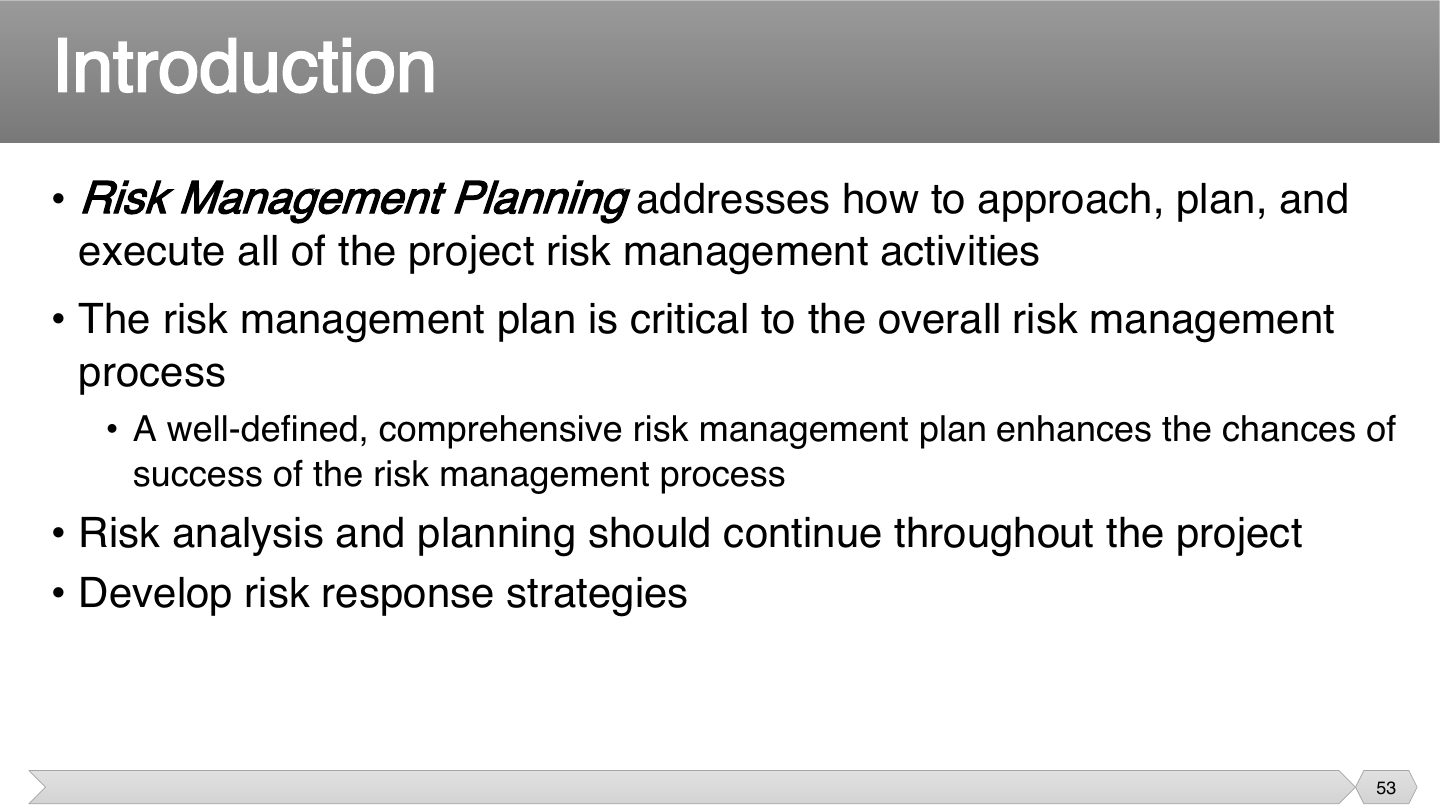
Before handling risks, decide how you’ll handle them: who, how often, with what budget. Without a plan, people treat risk work as optional and it gets dropped under pressure.
What does risk management planning decide?
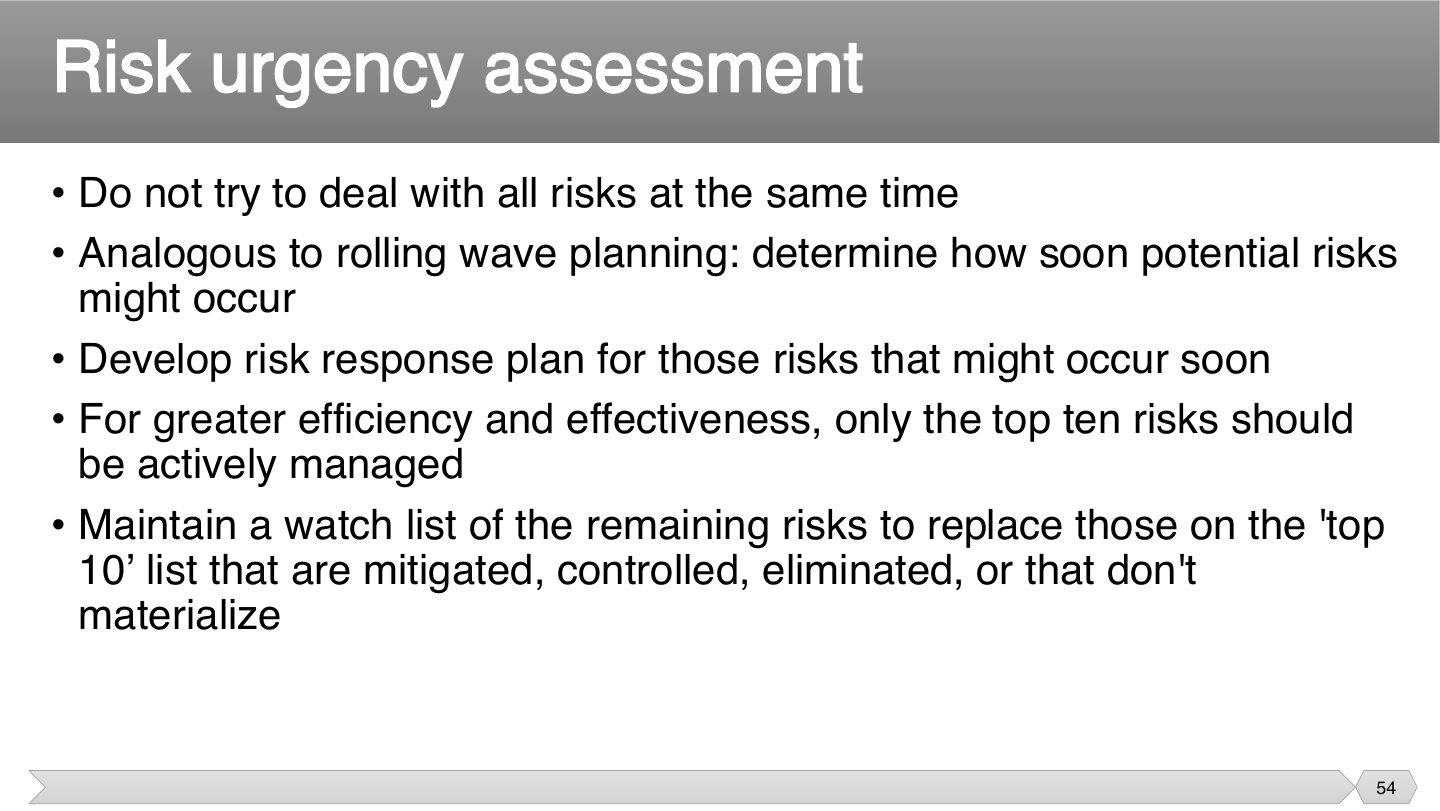
Working on everything at once means not doing any of it well. Handle what could strike soon, keeping others on a watch list, the same idea as rolling wave planning.
According to the slide, how many risks should be actively managed?
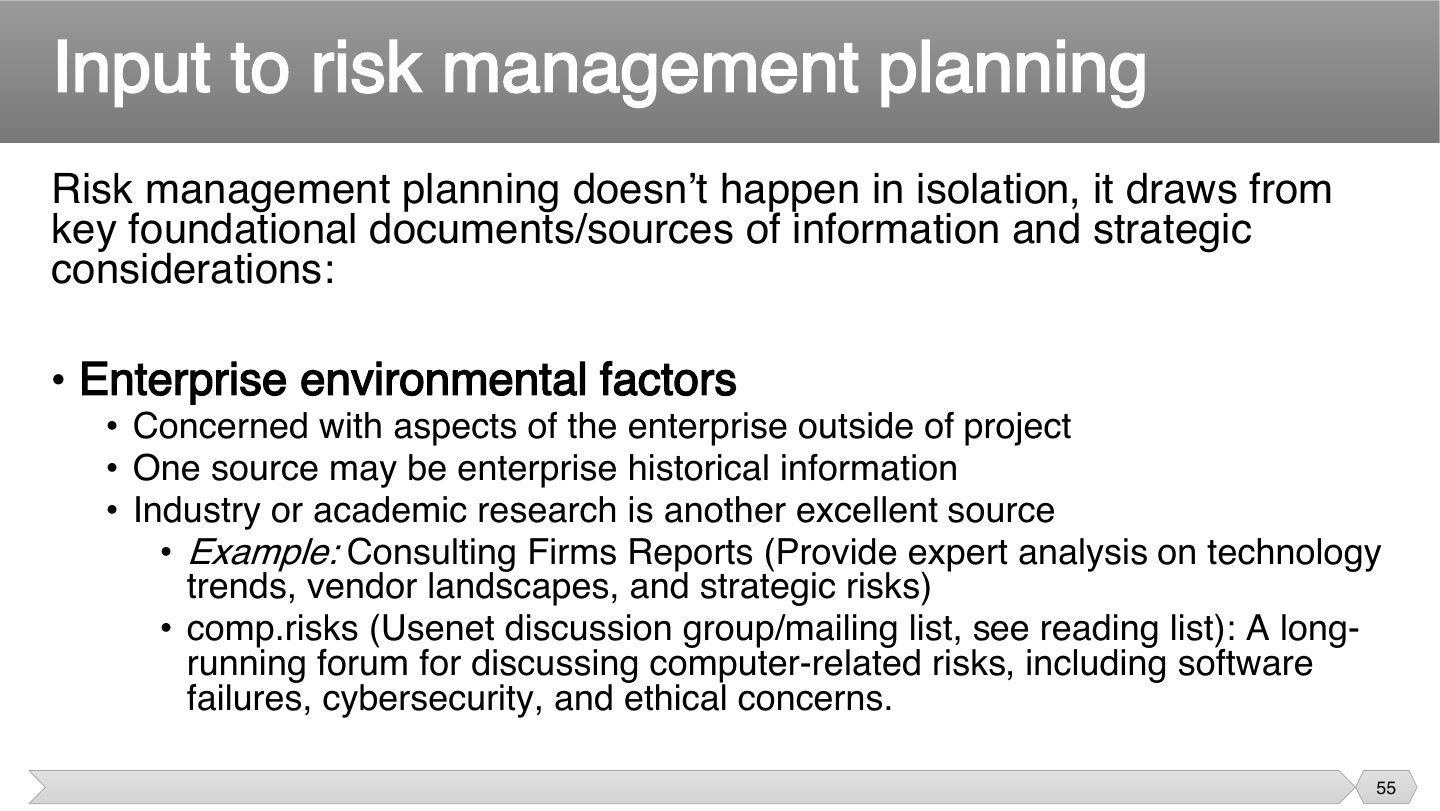
You don’t start from nothing. Past records and research show what’s happened on similar work, which is why historical information counts as an input.
Which is an input to risk management planning?
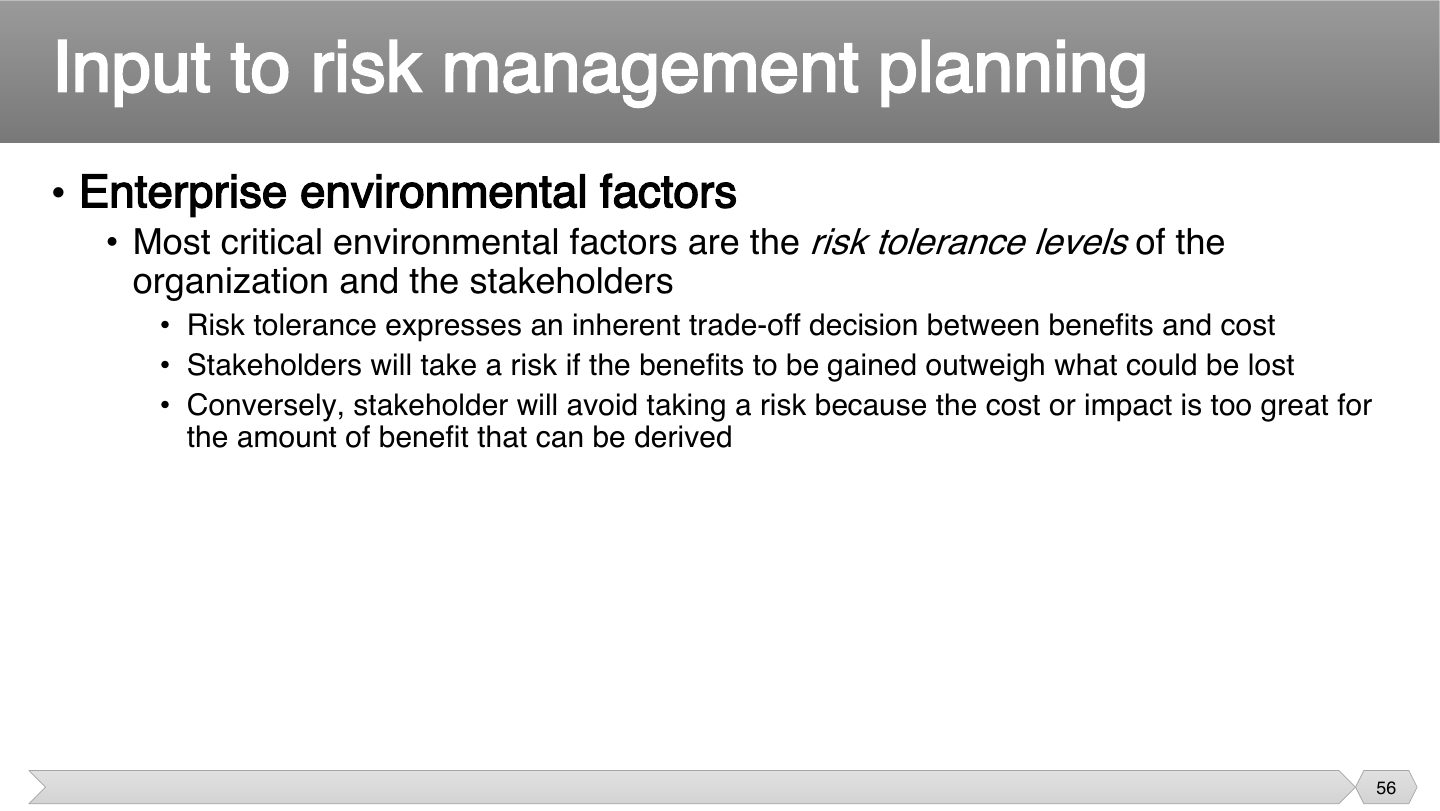
A hospital and a startup tolerate very different risks. Risk tolerance tells you what’s acceptable: people take a risk when what they could gain outweighs what they could lose.
When will a stakeholder take a risk?
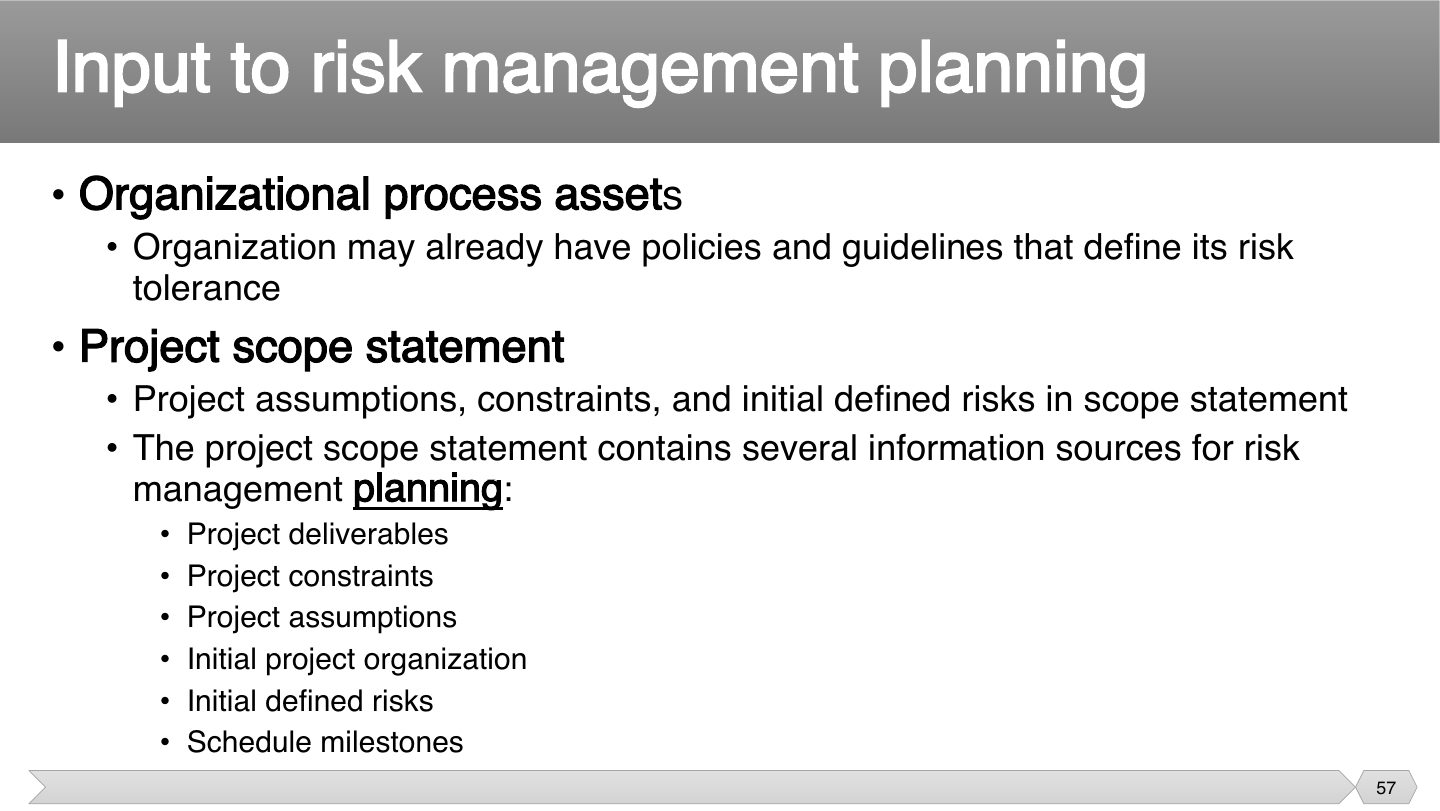
Don’t reinvent the rules if policies already exist. The scope statement is also useful, because its assumptions and constraints point directly at where risks may hide.
What can the project scope statement provide for risk planning?
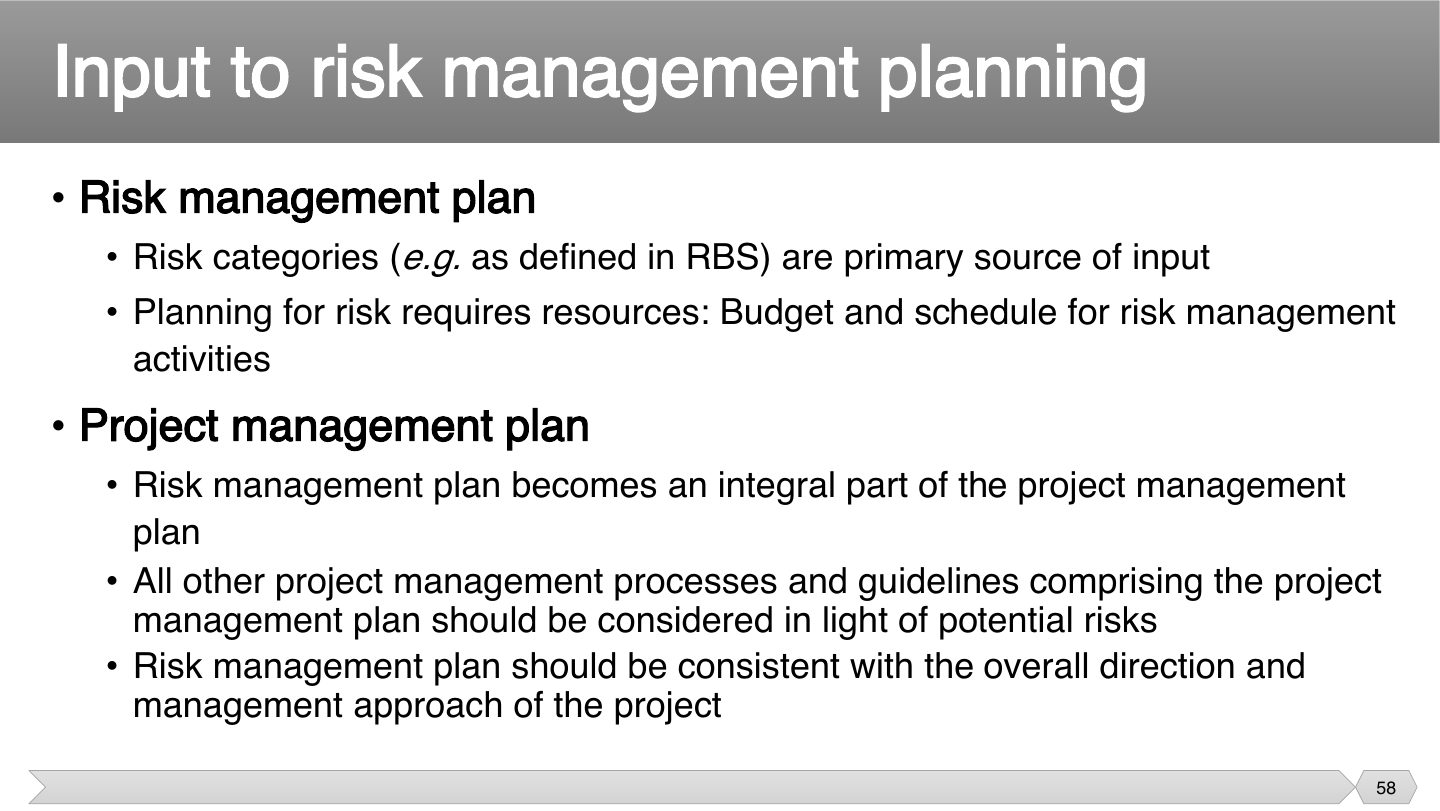
Risk work needs real time and money, so it has to be planned like other work. Making the risk management plan part of the main plan means risks get considered in everything else.
The risk management plan becomes part of the project management plan.
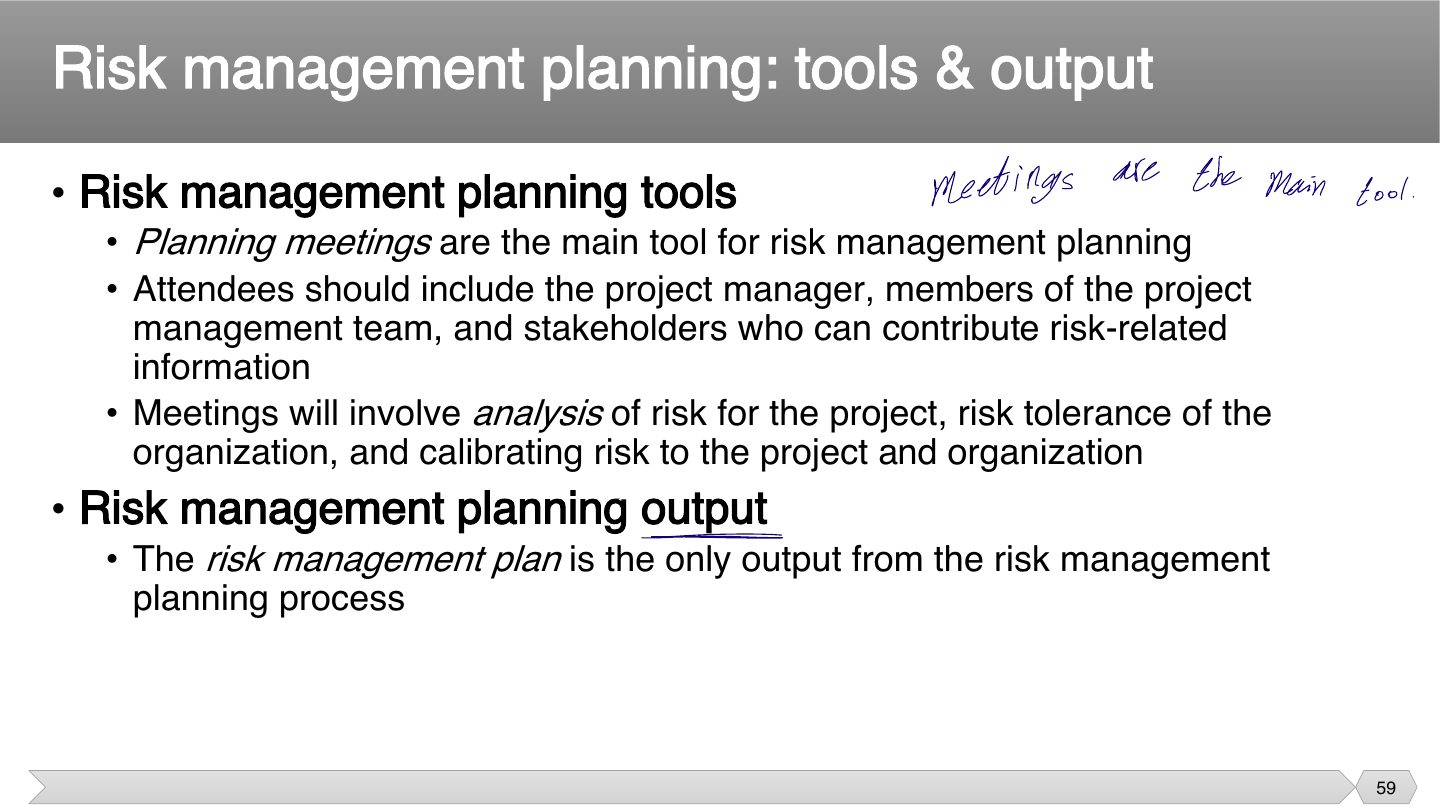
Risk knowledge is spread around, so bring those who hold it together. That’s why meetings are the main tool, and the plan they produce is the single output.
Instructor Next to the heading: “Meetings are the main tool.”
Trap Identification outputs the risk REGISTER; planning outputs the risk management PLAN.
The only output of risk management planning is:
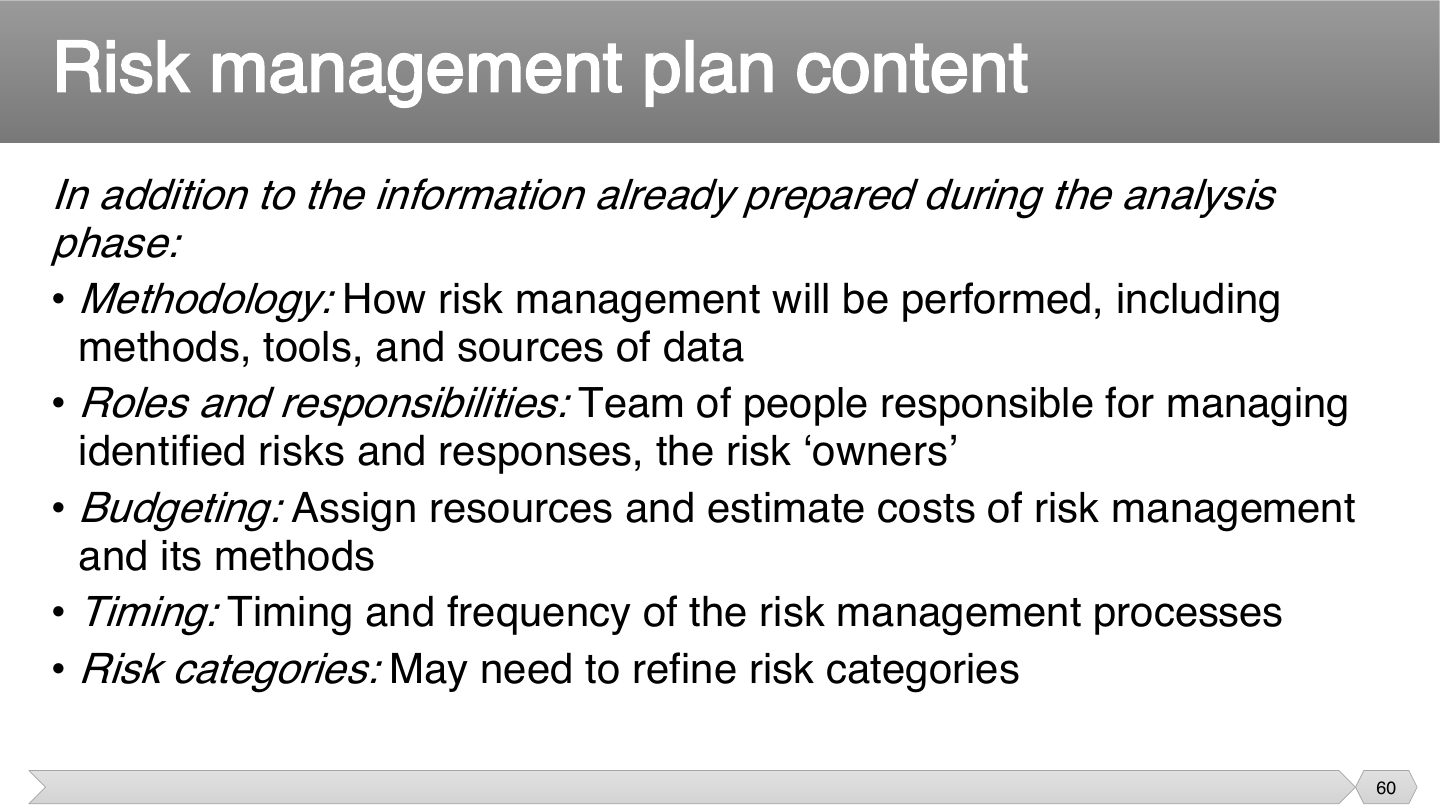
This sets how the work happens, and who does it. Naming risk owners is the key part, because a risk that belongs to everyone tends to be handled by no one.
Who are risk “owners”?
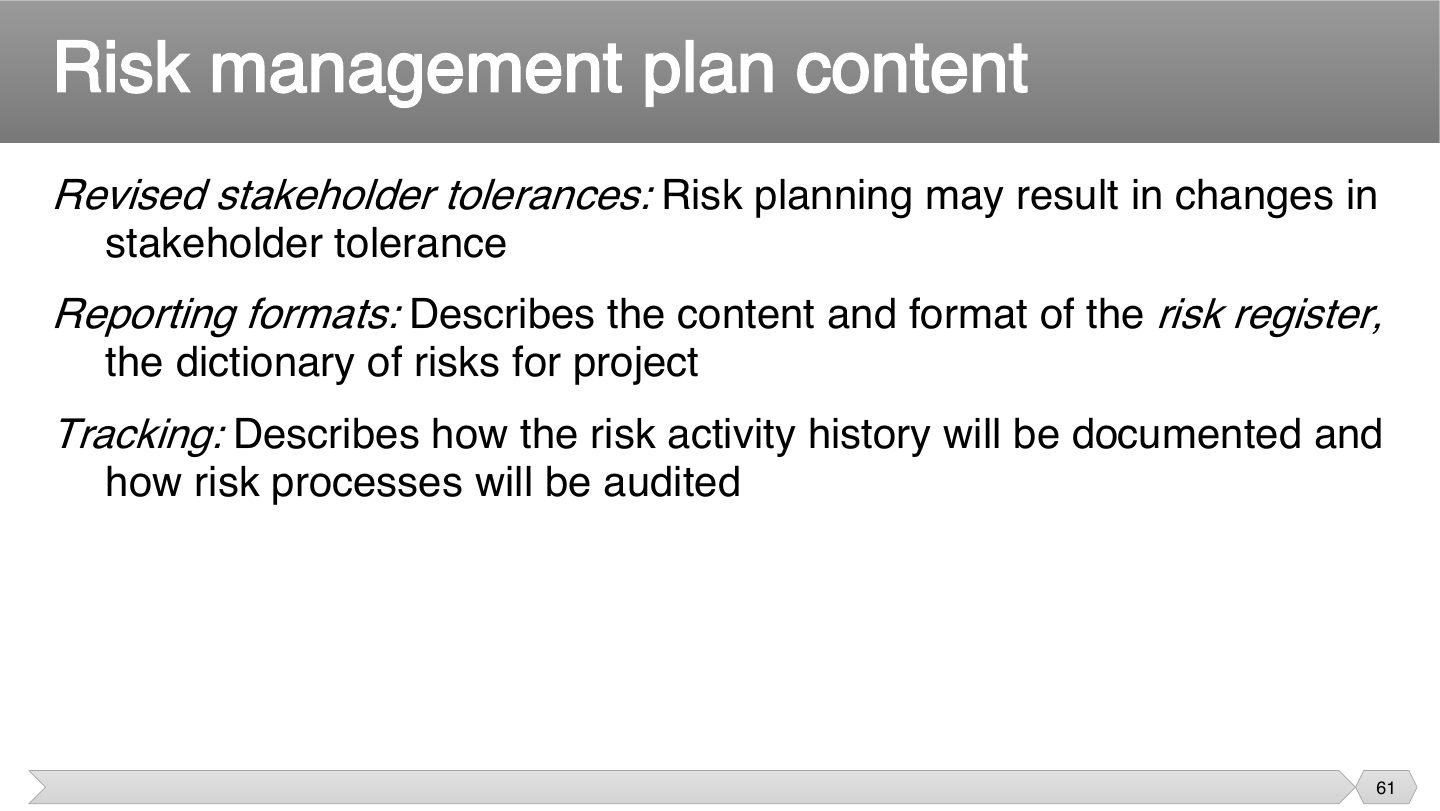
Formats and tracking may look like bureaucracy, but they let people compare risks over time. Tracking also lets an audit show whether the process is being followed.
What does “Tracking” describe in the plan?
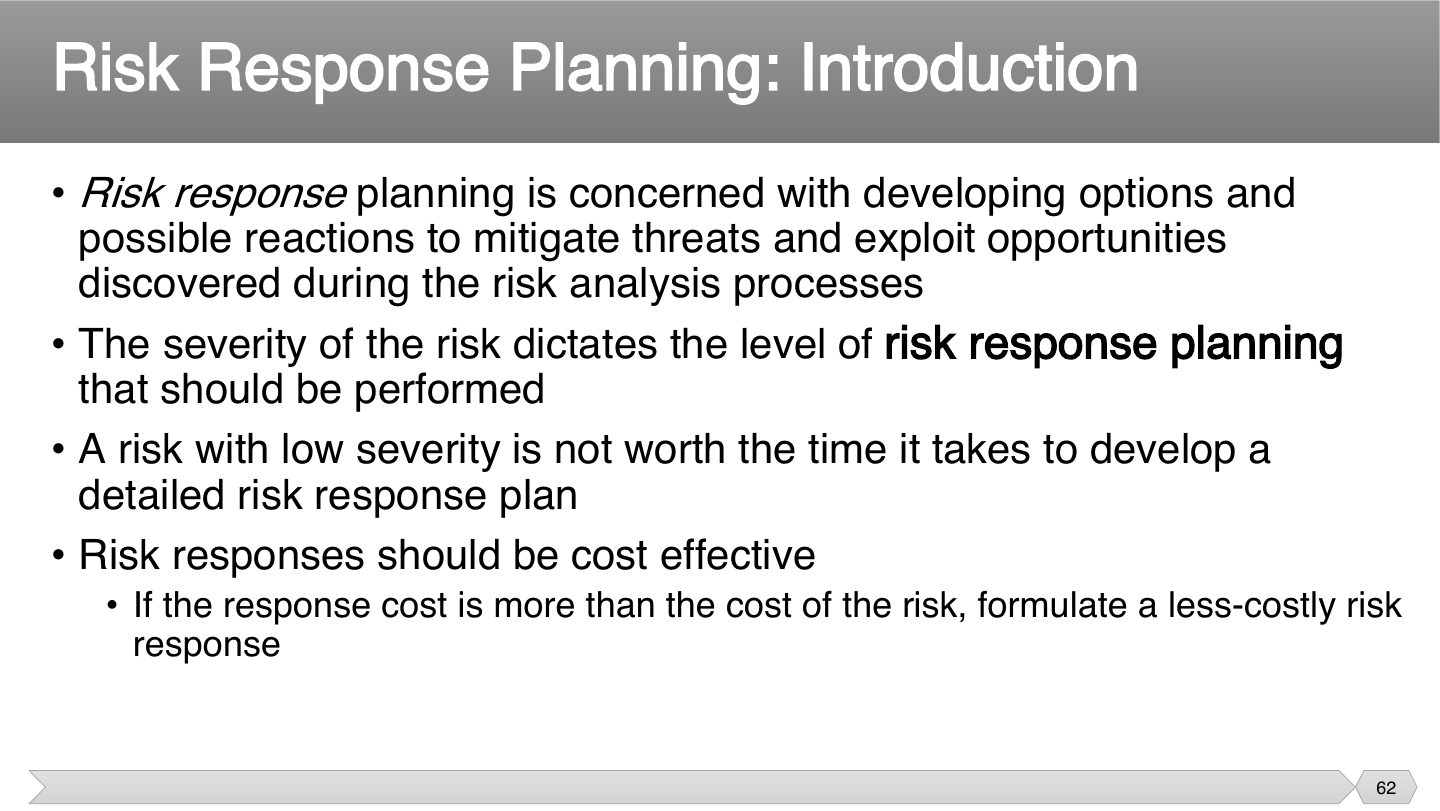
Spending $10,000 to prevent a $1,000 problem makes no sense. So match the effort to the severity, and for low risks a simple note may be enough.
A response costs more than the risk itself. What should you do?
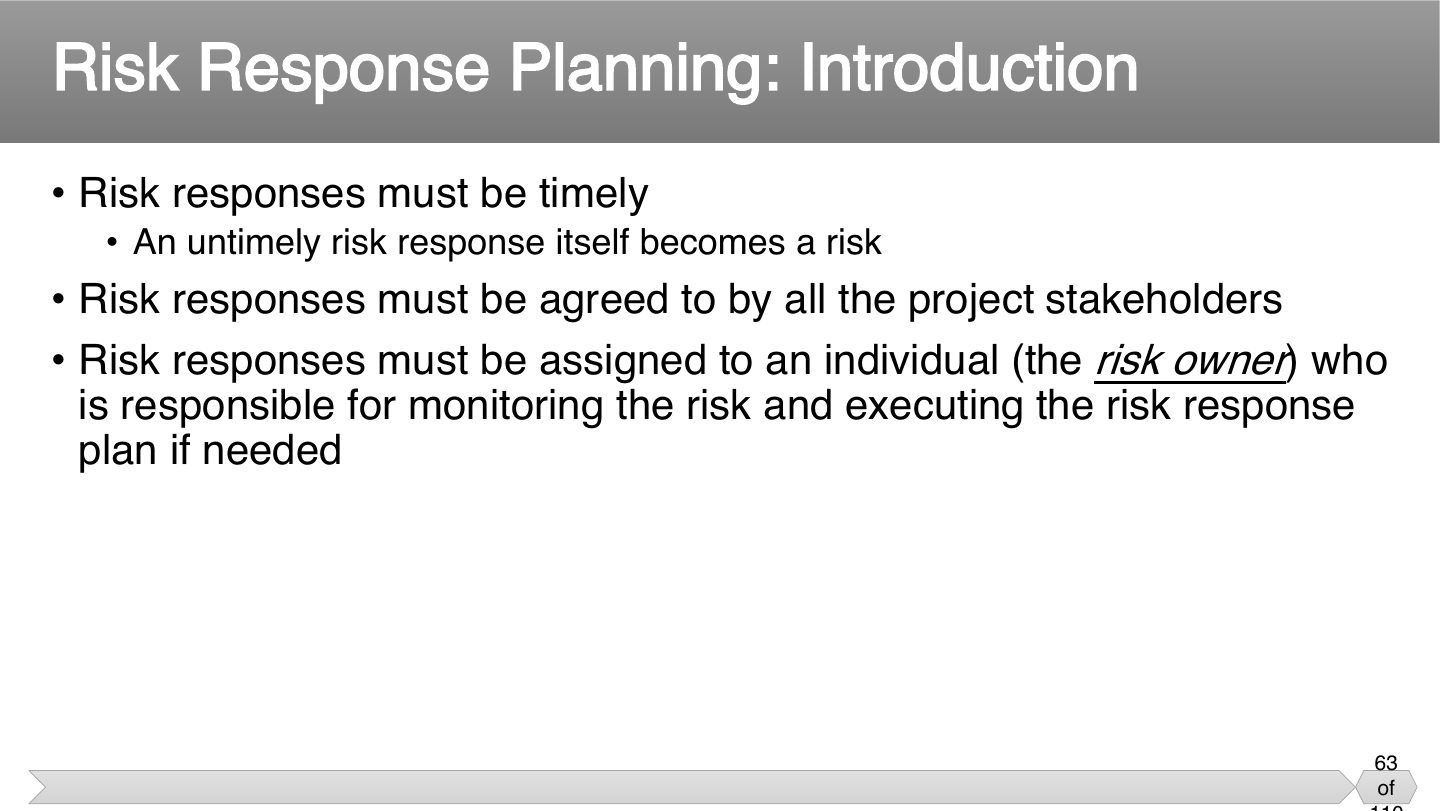
A response that arrives too late doesn’t help, and it may create new problems. It needs agreement, because others bear its cost, and one owner, so someone is clearly responsible for acting.
Seen again Ch 1, slide 68: Good risk responses: appropriate, cost-effective, realistic, agreed, owned
Who should be responsible for monitoring a risk and executing its response?
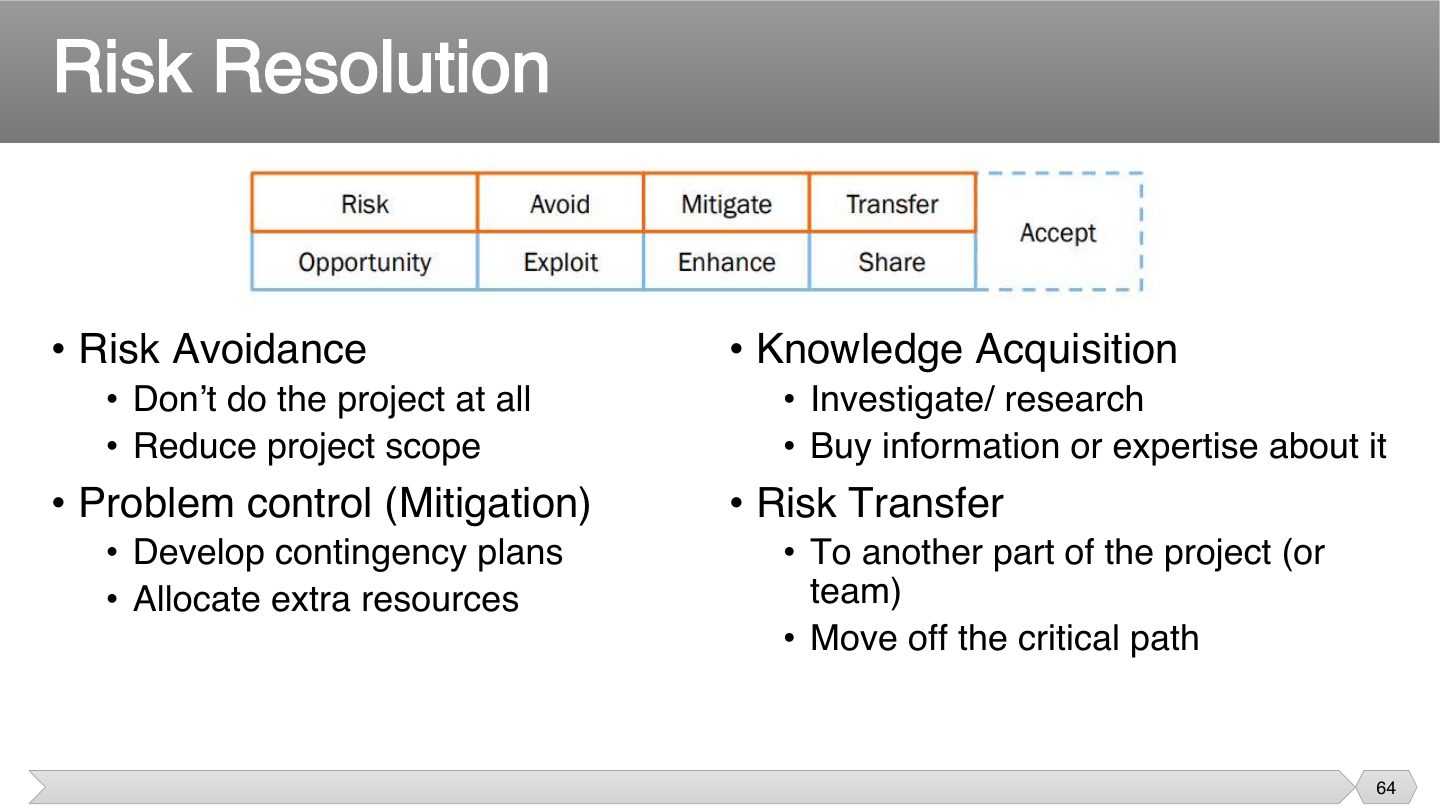
Threats and opportunities are mirror images, which makes them easier to remember. You remove a threat and guarantee an opportunity, shrink one and grow the other, hand off one and share the other.
Memory trick Threat/opportunity mirror: Avoid–Exploit, Mitigate–Enhance, Transfer–Share, Accept–Accept.
Which pair is correct for threats and opportunities?
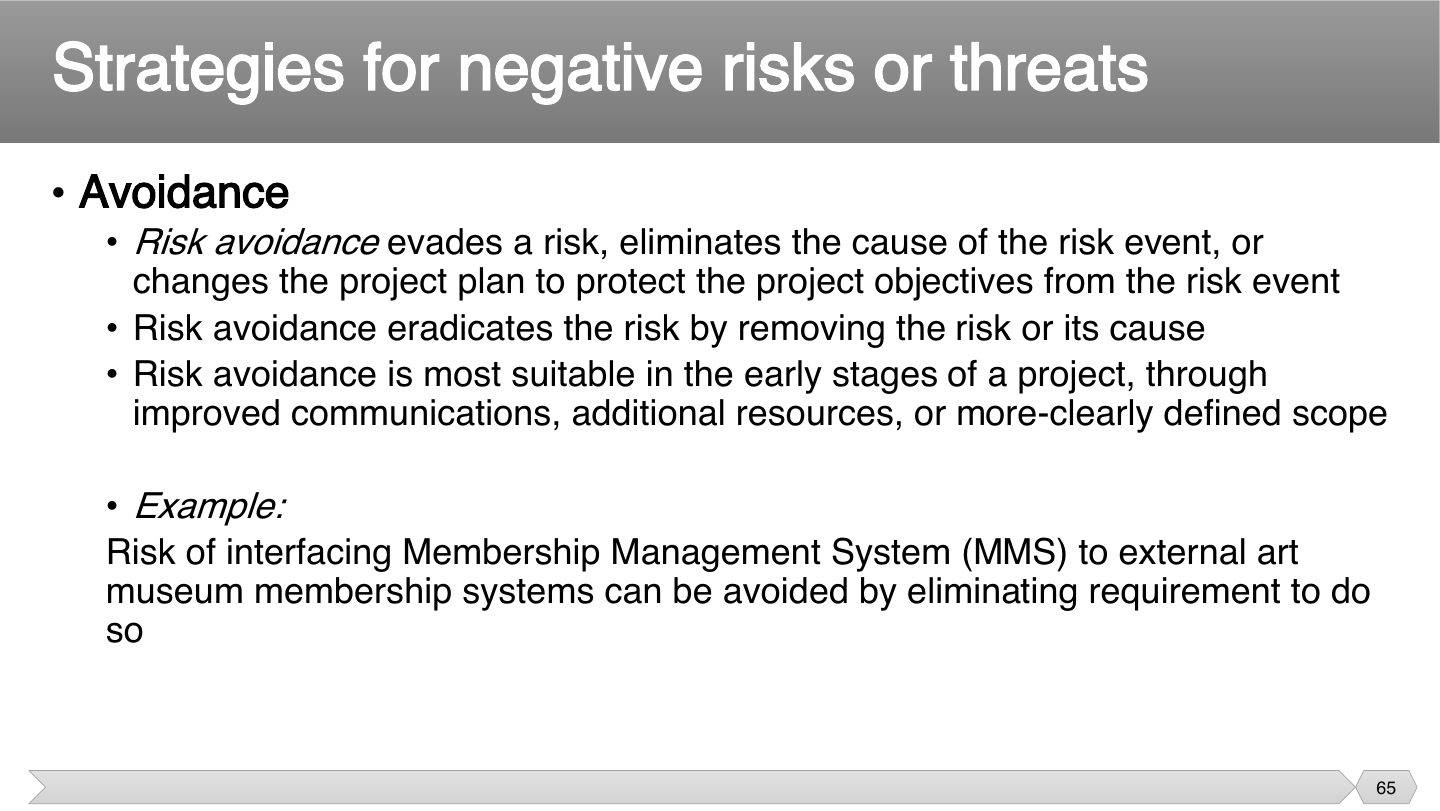
If you remove the cause, the risk disappears. That’s why avoidance is the strongest response, but it can mean dropping something valuable. It’s cheapest early on, before work depends on that part.
Removing a risky integration may also remove a feature you wanted. So weigh what you’d lose, rather than treating avoidance as free.
Q2.5 · two risk identification techniques + risk assessment matrix
Q2.4 · two identification techniques; mitigate, prioritize and monitor
Dropping a risky external-system integration requirement is which strategy?
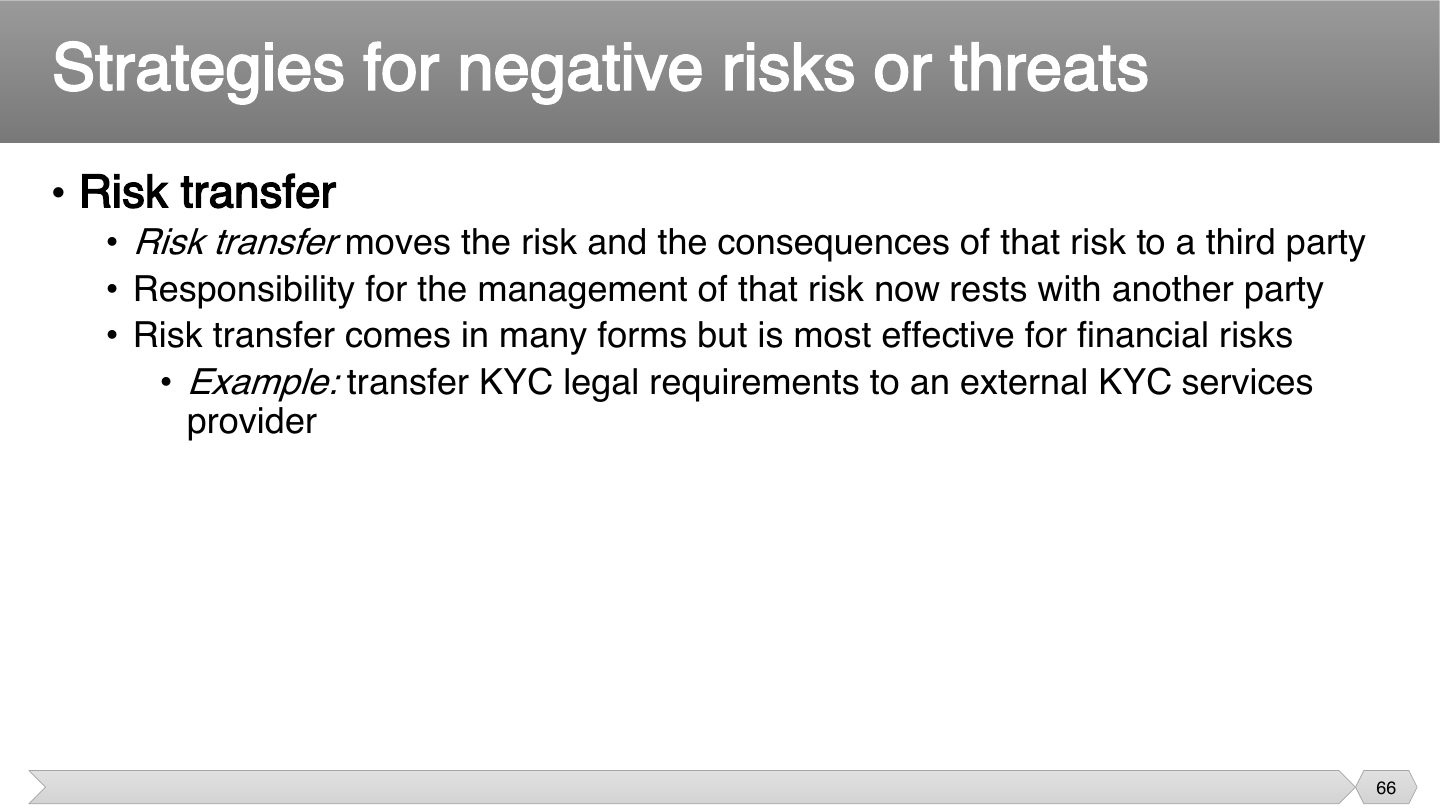
The risk still exists, but someone else pays if it happens. Transfer works best for money, as insurance can pay for damage, but it can’t give back your lost reputation.
Risk transfer is most effective for which risks?
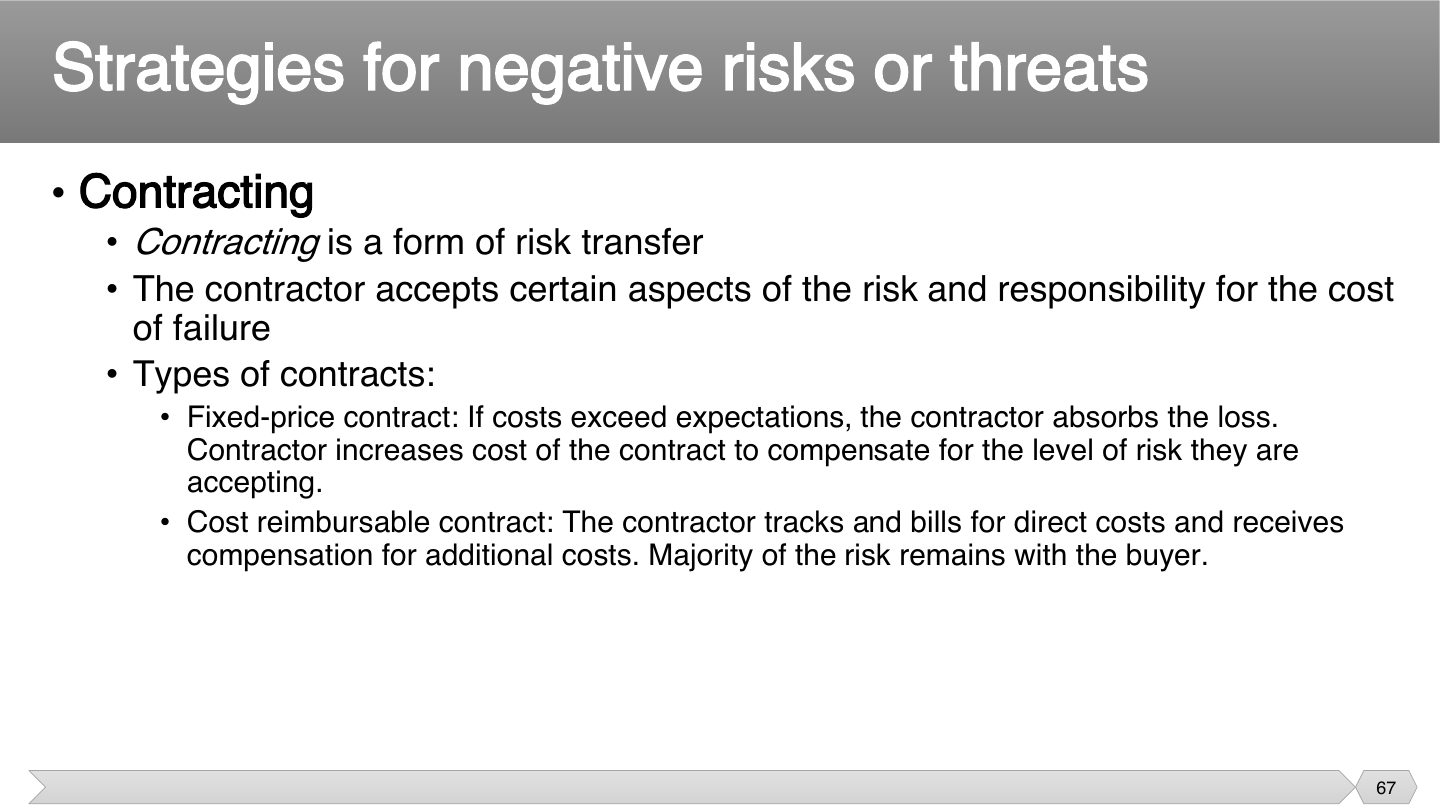
With a fixed price, the seller pays for any overrun, so expect them to raise their price to cover that risk.
Here you pay whatever the work costs. That’s suitable when you can’t define the work well enough for a fair fixed price, but you carry the risk of overruns.
Trap Fixed price → risk on the SELLER. Cost reimbursable → risk on the BUYER.
Under a cost-reimbursable contract, most of the risk stays with:
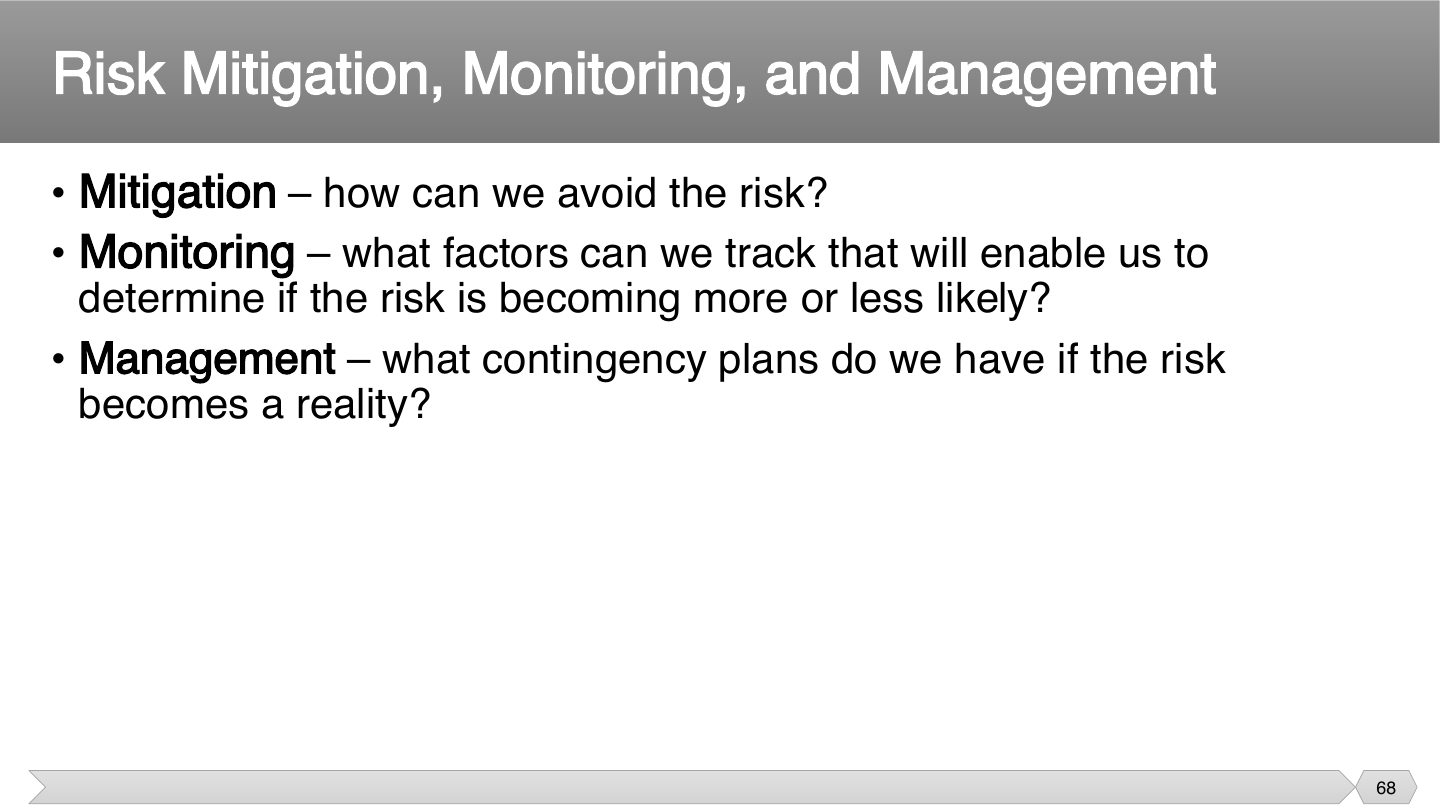
Mitigation tries to stop it, monitoring watches for warning signs, and management is your plan if it happens anyway. Together, RMMM answers before, during and after.
In RMMM, what does Monitoring ask?
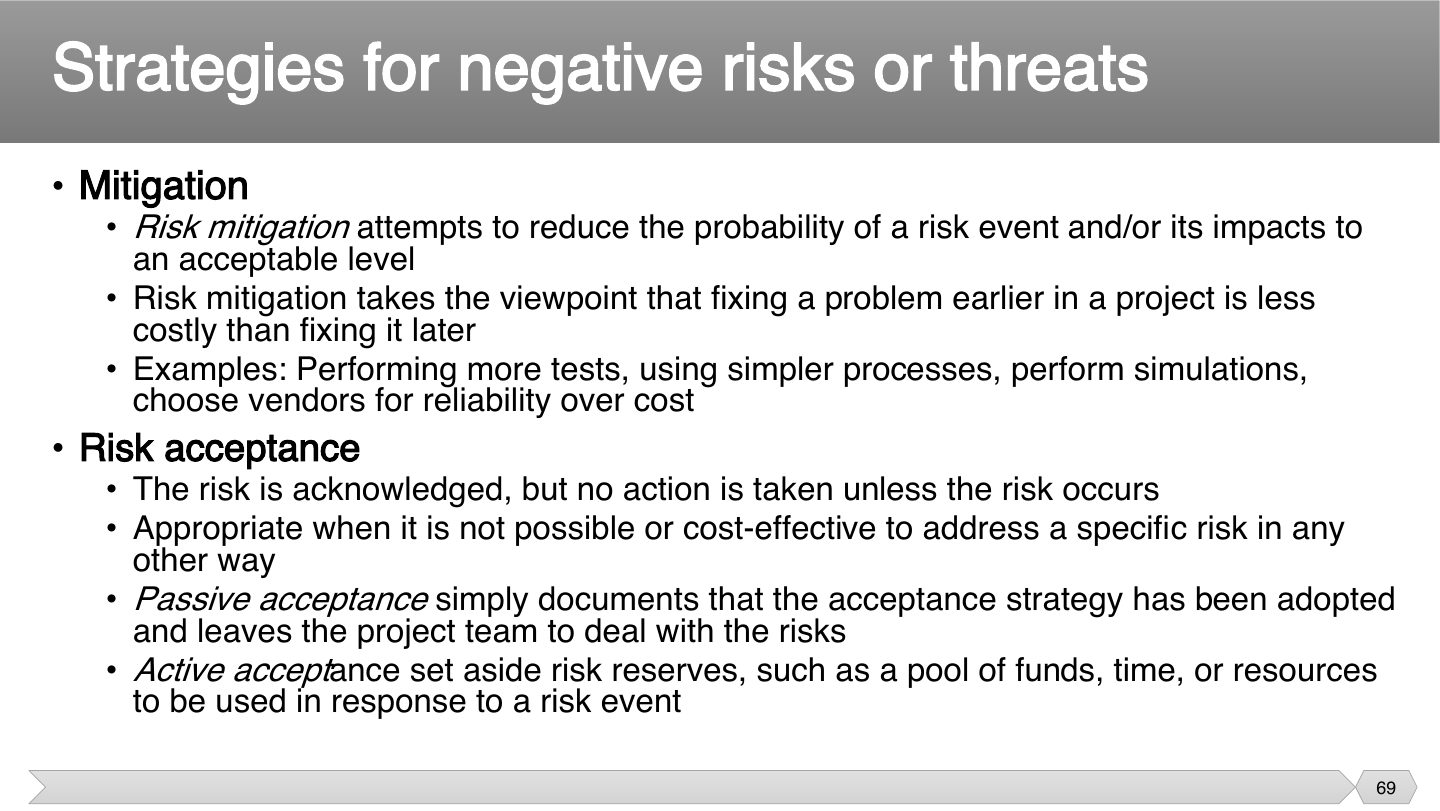
You accept that the risk might still happen, but you make it less likely or less painful. Finding a problem through tests now is much cheaper than after release, which is why mitigation pays off.
Sometimes a risk can’t reasonably be reduced. Passive acceptance means you’ll deal with it if it comes, while active acceptance sets money or time aside just in case.
Running extra performance tests to lower the chance of a slow release is:
Active acceptance means setting aside reserves of funds, time or resources.
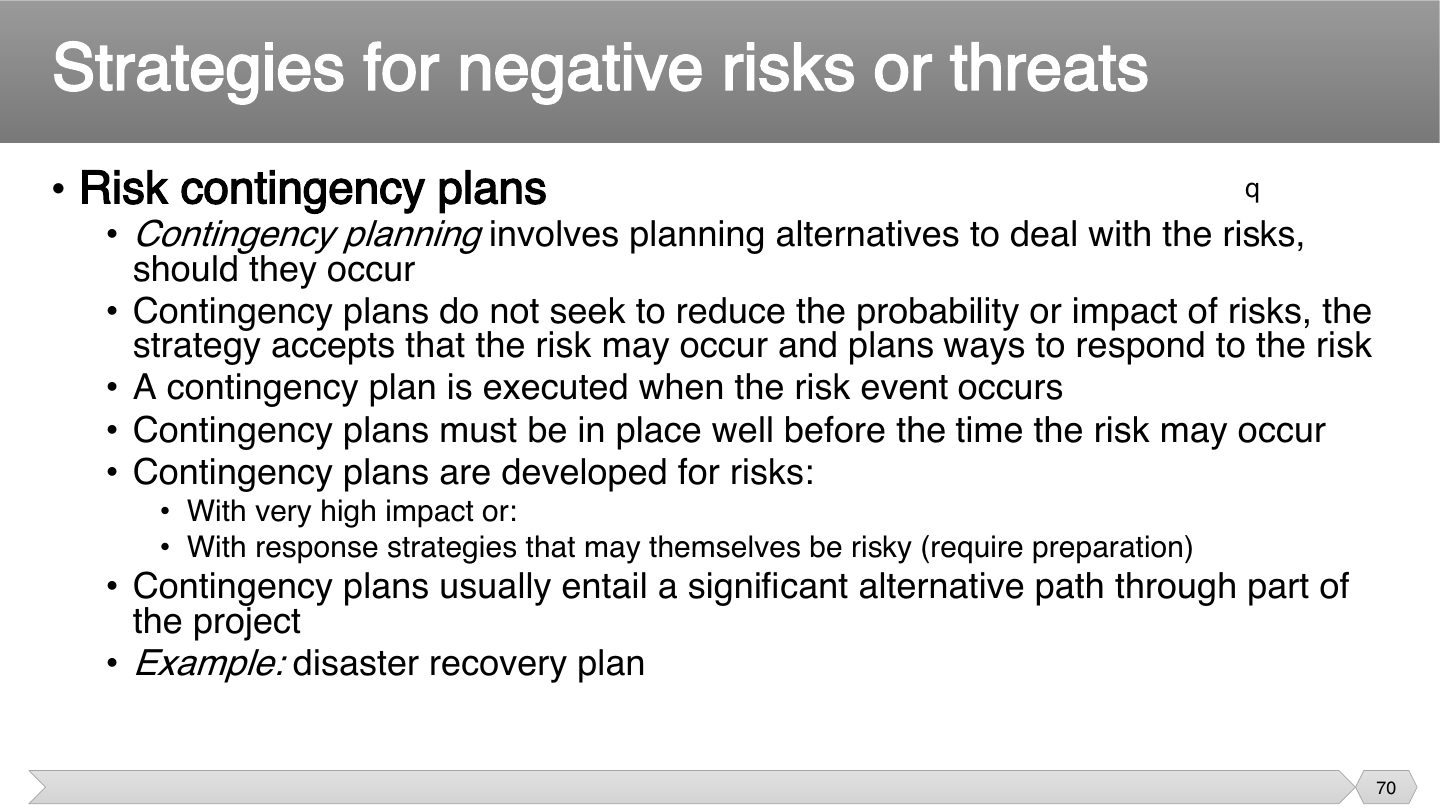
Don’t confuse this with mitigation. A contingency plan doesn’t make the event any less likely. It’s just what you’ll do if it happens, which saves panic later.
A data center may still fail, but a disaster recovery plan gets you running again. That’s a clear example of planning for after the event.
What does a contingency plan do?
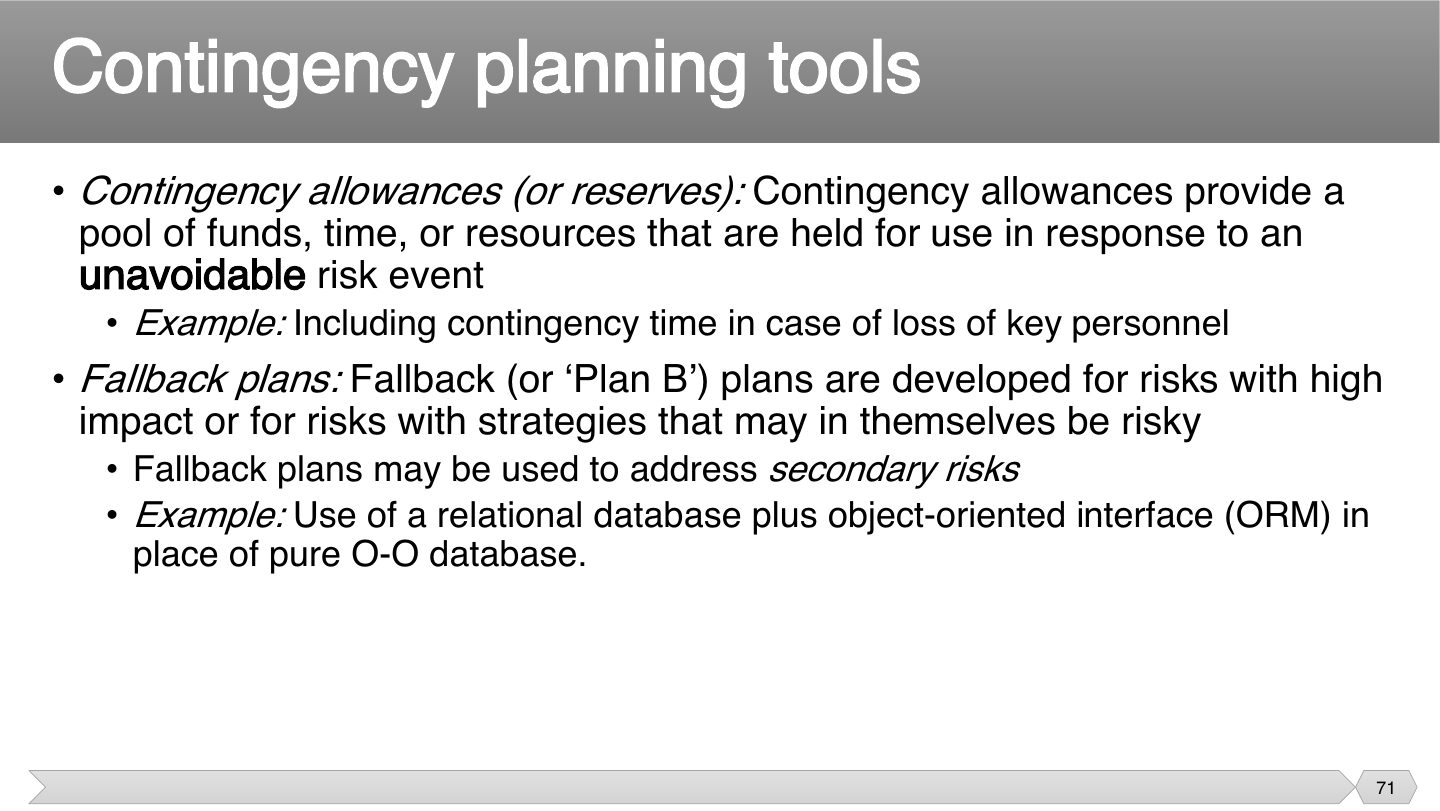
This is the time or money kept back to pay for a problem when it happens. A contingency allowance means you don’t have to find extra resources in a crisis.
What if your response doesn’t work? A fallback plan is your Plan B, so it’s kept for serious risks where failure of the first plan would really hurt.
What is a fallback plan?
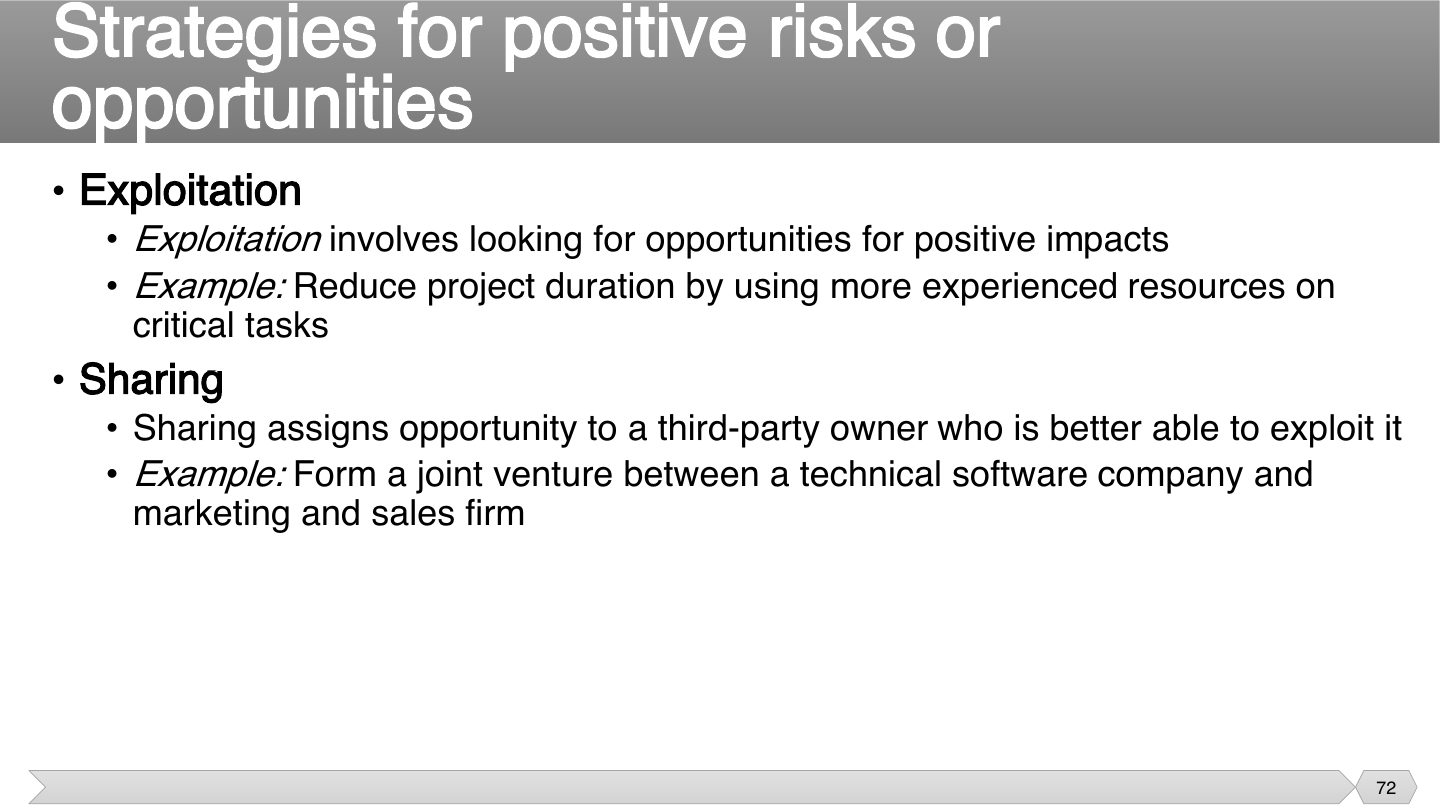
With a threat you hope it won’t happen, and with an opportunity you want it to. Exploitation makes it more certain by acting, while sharing brings in a partner who’s better placed to capture it.
Seen again Ch 1.2, slide 104: Five opportunity strategies
A company partners with a sales firm that can better capture an opportunity. Which strategy is this?
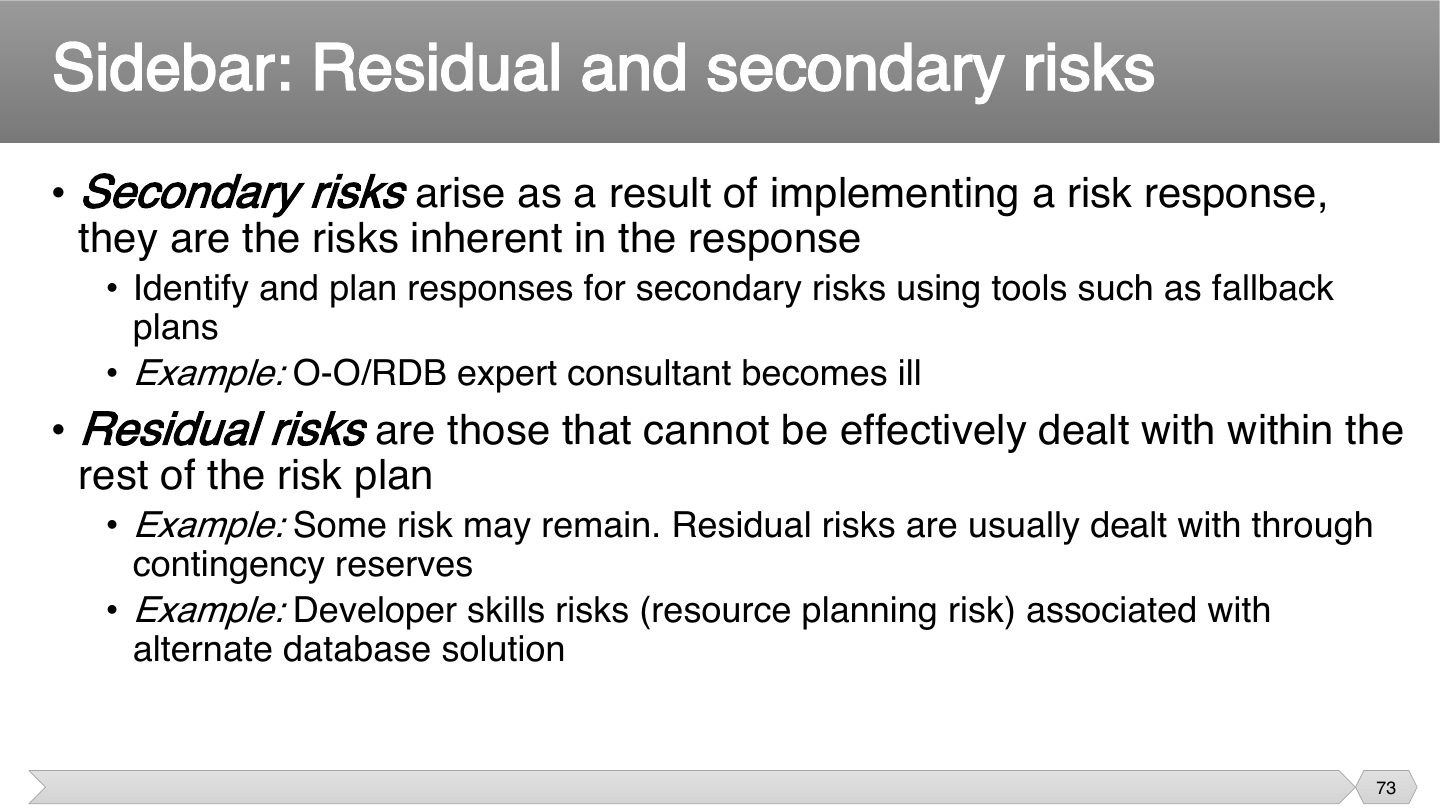
Your fix can create its own problems: hiring an expert adds the risk that they fall ill. These are secondary risks, and they need responses too.
Even after responding, some risk usually remains. Residual risk is what’s left, so you decide whether it’s acceptable and keep a reserve to cover it.
After hiring an expert consultant as a risk response, the consultant falls ill. This is a:
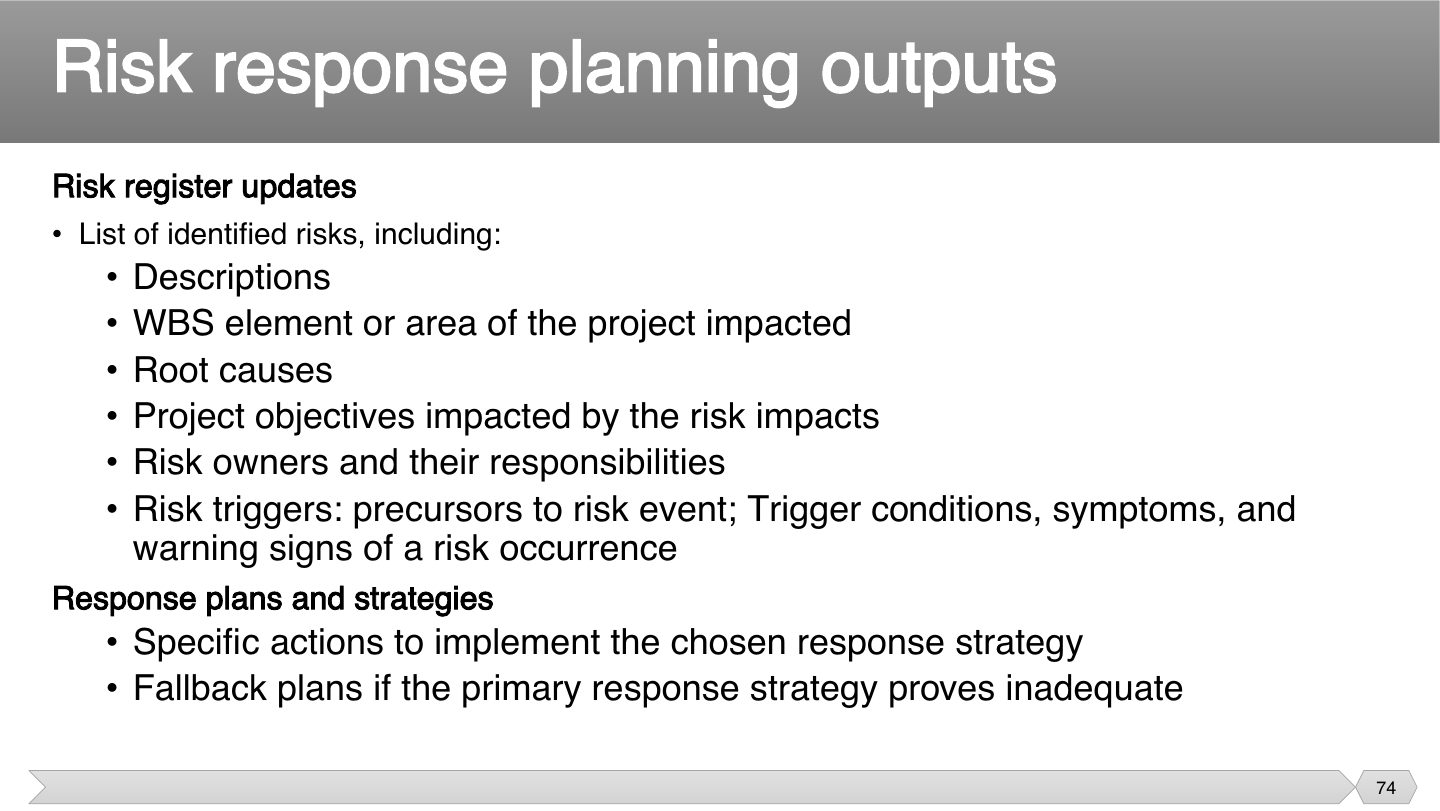
A trigger tells the risk owner when to act, like a warning sign. Without one, people may not notice a risk is happening until it’s too late.
What is a risk trigger?
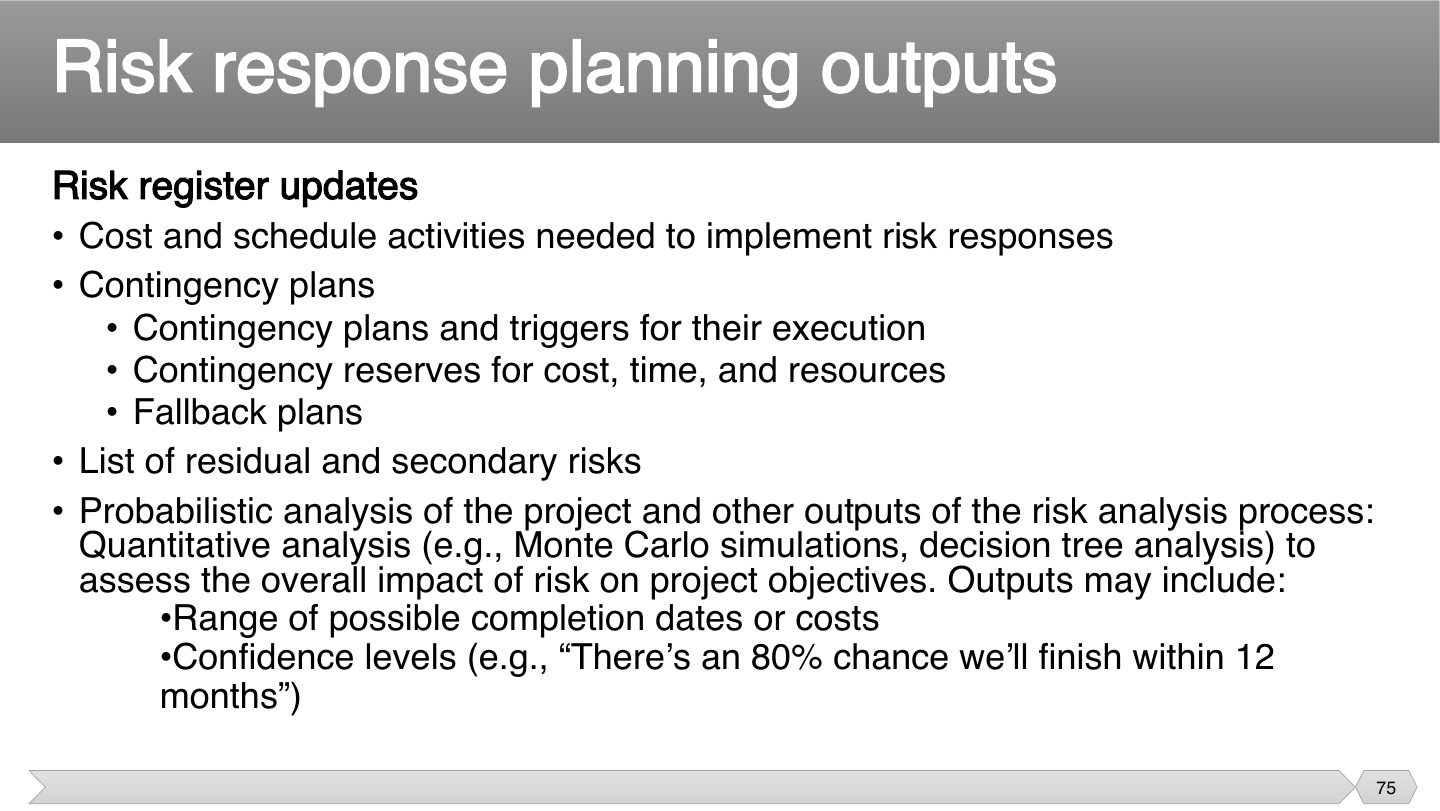
Responses cost time and money, and those must go into the plan, or they’ll be a surprise later. Monte Carlo analysis then simulates the project many times, showing the likely range of results.
Where do secondary and residual risks get listed?
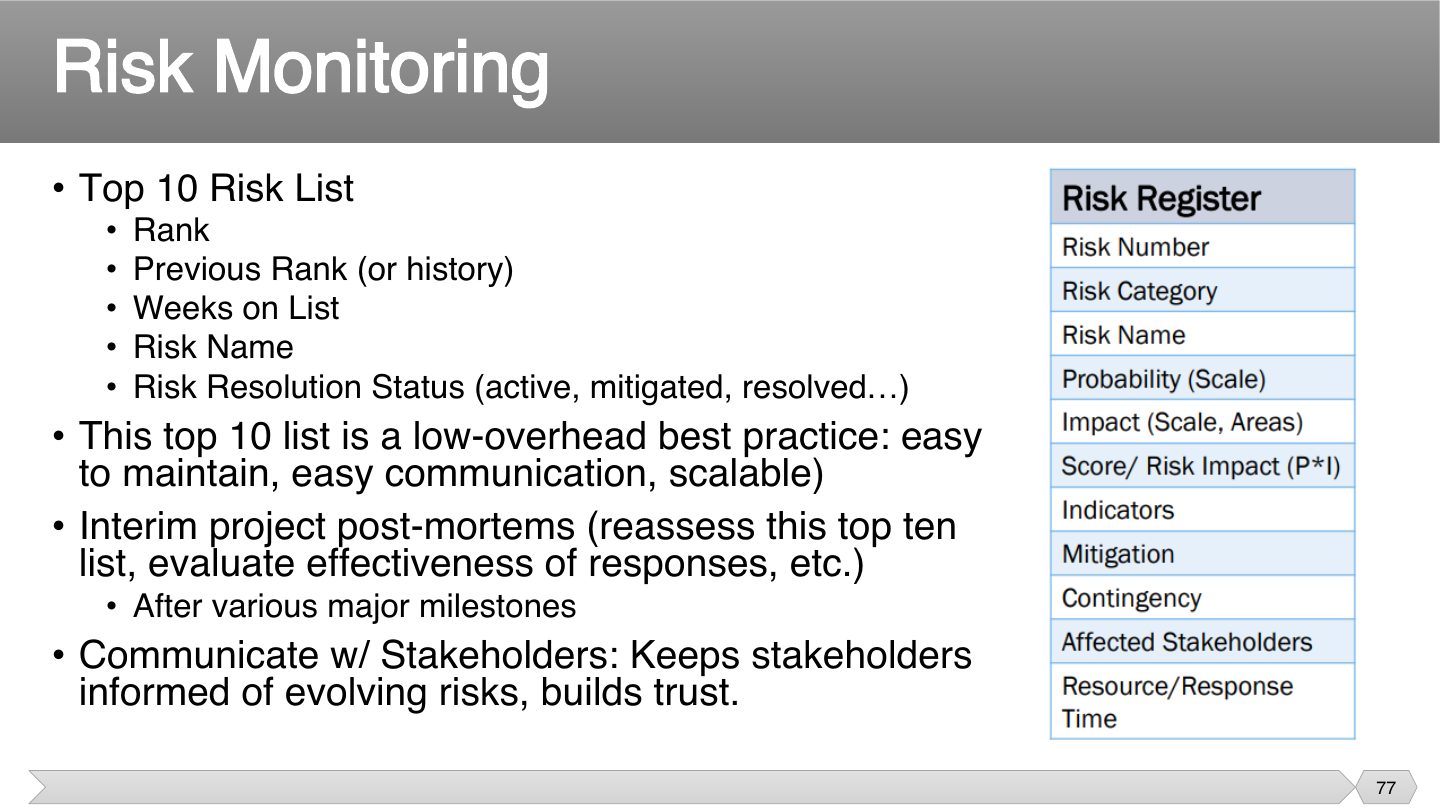
Lengthy risk reports get ignored. A short list that’s easy to update gets read and acted on, while weeks on list shows which risks are stuck.
Q2.5 · two risk identification techniques + risk assessment matrix
Q2.4 · two identification techniques; mitigate, prioritize and monitor
List two software risk identification techniques and explain how you would mitigate, prioritize and monitor the risks (Final 251).
Identification: (1) brainstorming with a diverse team, and the Delphi technique where experts answer anonymously to avoid groupthink; (2) checklist analysis built from past projects and the lowest level of the RBS (also: root-cause/5-whys, assumptions analysis, interviews, SWOT). Prioritize: estimate probability and impact, compute risk exposure RE = P × I, and place each risk in the probability-impact matrix; actively manage only the top-10 high risks. Mitigate: choose a strategy per threat: avoid (remove the cause), transfer (contract or insurance), mitigate (more testing, simpler design), or accept with a contingency reserve; give every risk an owner. Monitor: keep a top-10 risk list and the risk register updated, review risks in weekly meetings and status reports, watch triggers, and hold reassessments and audits at milestones.
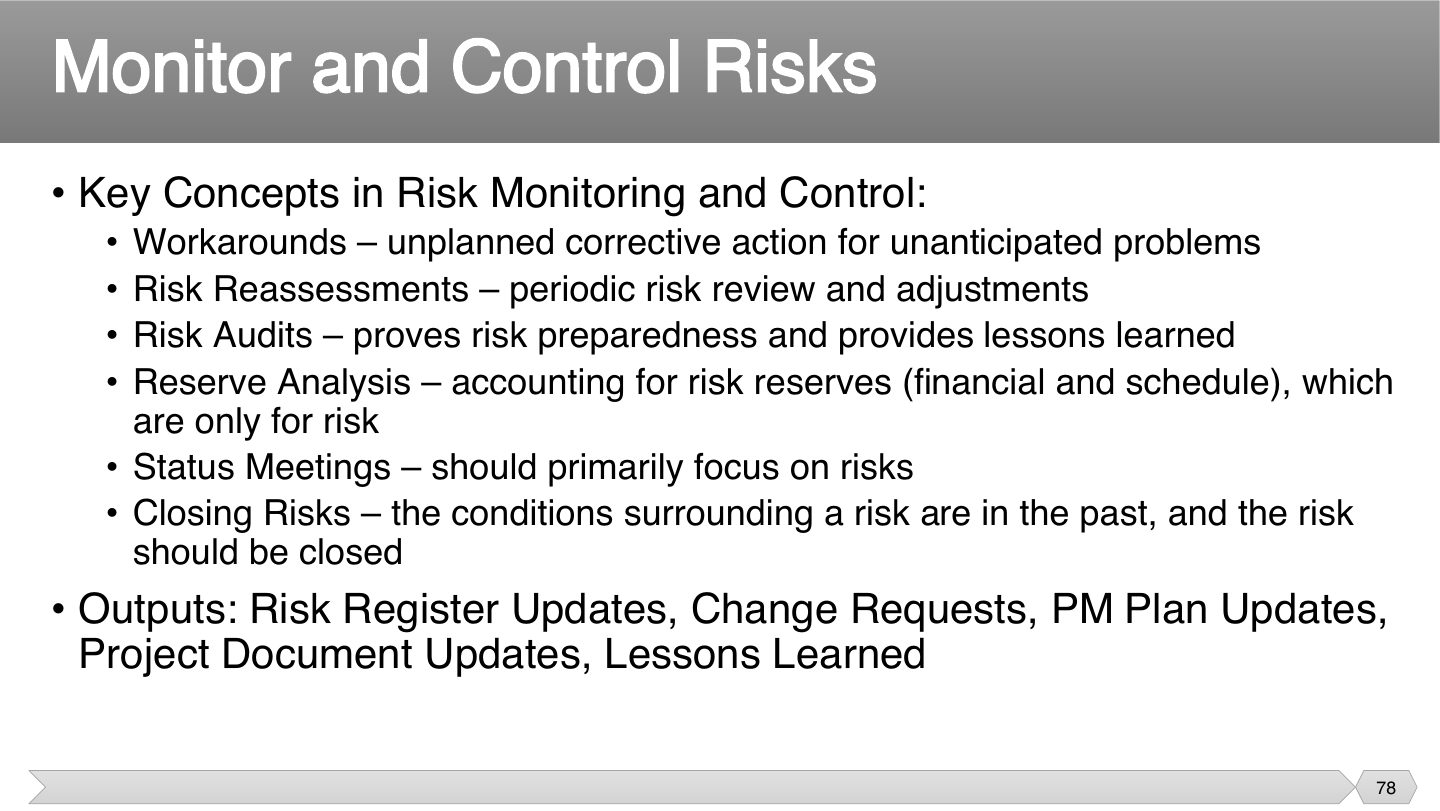
A contingency plan is prepared in advance. A workaround isn’t, because the problem wasn’t foreseen. If you need many of these, your risk identification may have been weak.
An unplanned corrective action for an unanticipated problem is a:
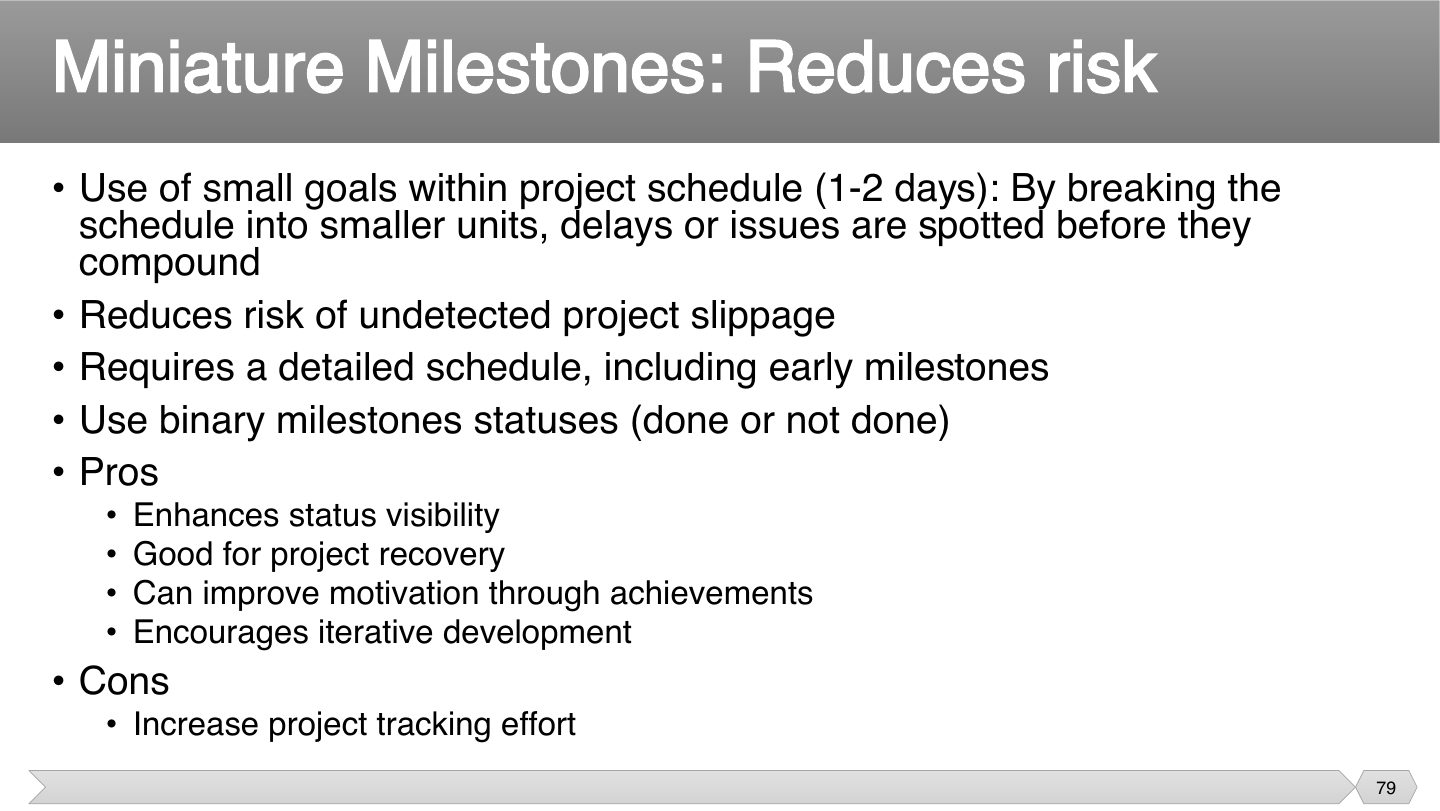
A task that’s “80% done” for weeks hides slippage. A binary milestone is done or not done, and when they’re only 1–2 days apart, a delay can’t hide for long.
Why use binary milestone statuses?
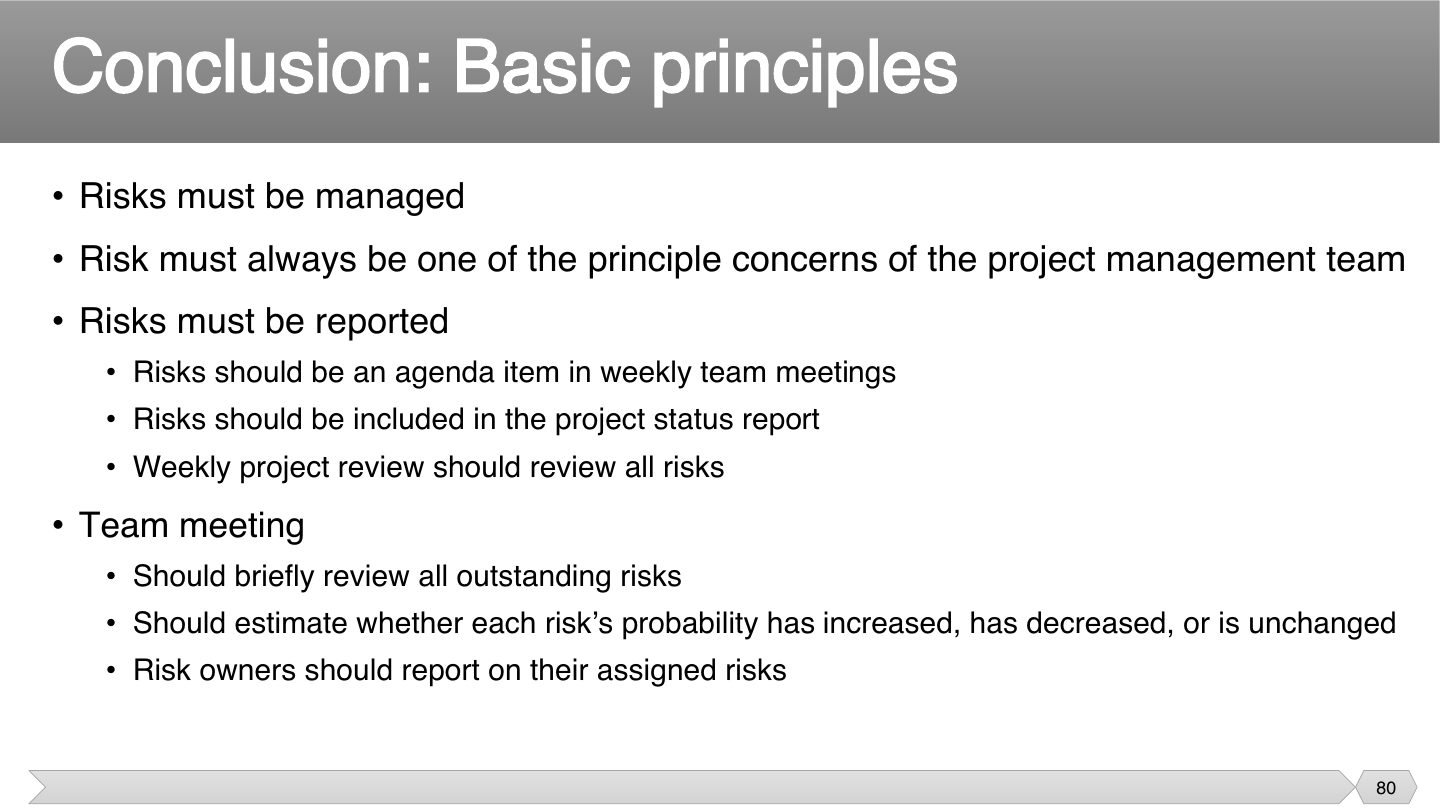
If risks only come up when something goes wrong, nobody’s managing them. Making them a regular agenda item keeps them visible while they can still be dealt with.
Where should risks appear regularly?
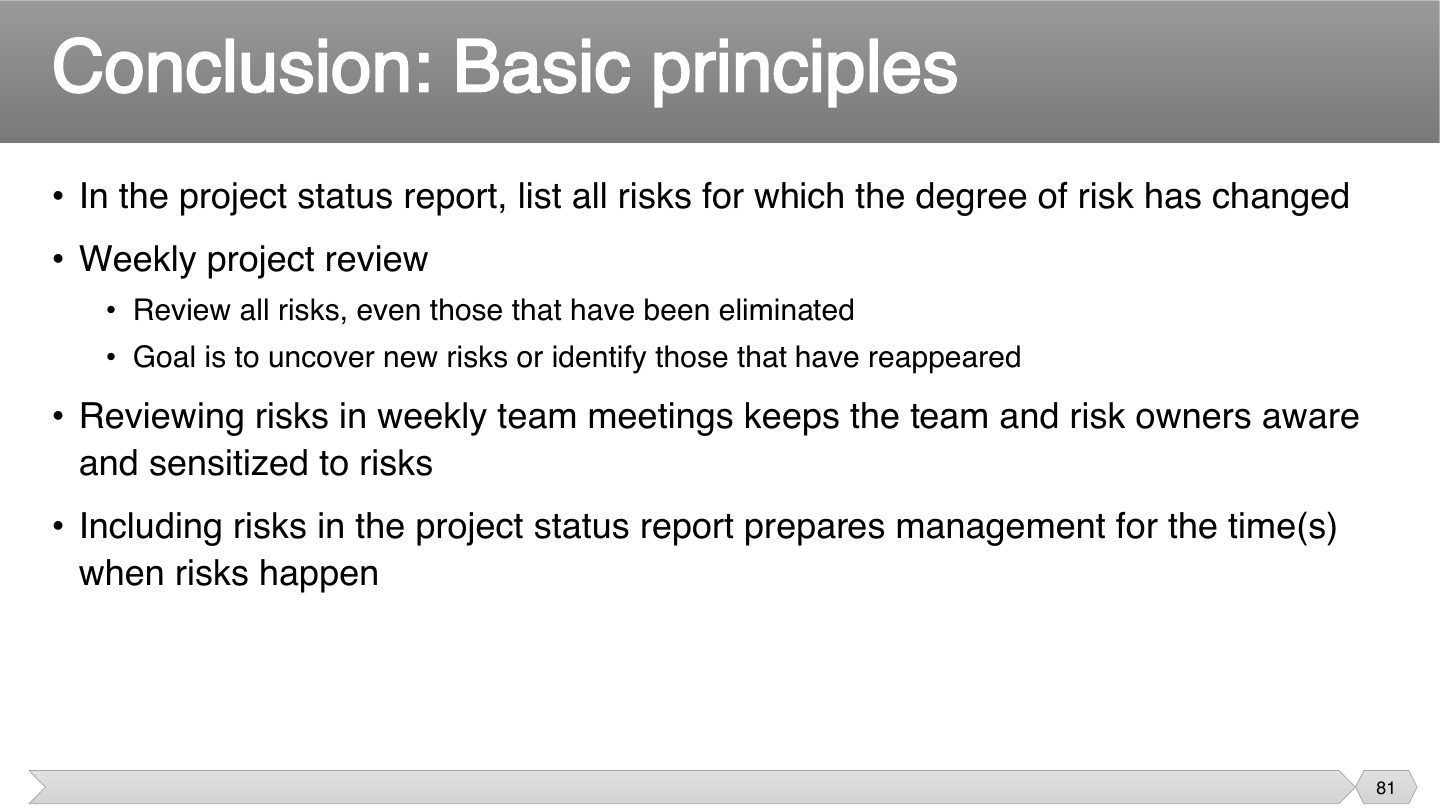
A risk you marked as solved can come back when things change. That’s why even eliminated risks get another look: the goal is to catch what’s new or returned.
Why review risks that were already eliminated?