Related question: Q3 · multiplexing several departments onto one link
Physical Layer: Signals, Impairments and Delay
Analog vs. digital, frequency and period, bit rate and bit interval, the three impairments (attenuation, distortion, noise), and the four delays: propagation, transmission, queuing and processing. This is the calculation-heavy deck: every formula here appears in Tutorial 3 (the solved Physical Layer Activity), and the worked answers are linked on each slide.
How to read this page
Every original slide is shown unchanged. Yellow marks on a slide point to a numbered note: hover or tap a mark to jump to its note, and hover a note to see its marks. Questions tagged Past exam appeared on a real paper; Prediction questions are likely angles, not confirmed. Pick an answer to each question: a wrong pick tells you why it is wrong, so you can try again.
All 35 slides
- 1 Physical Layer
- 2 Chapter 2: Outline
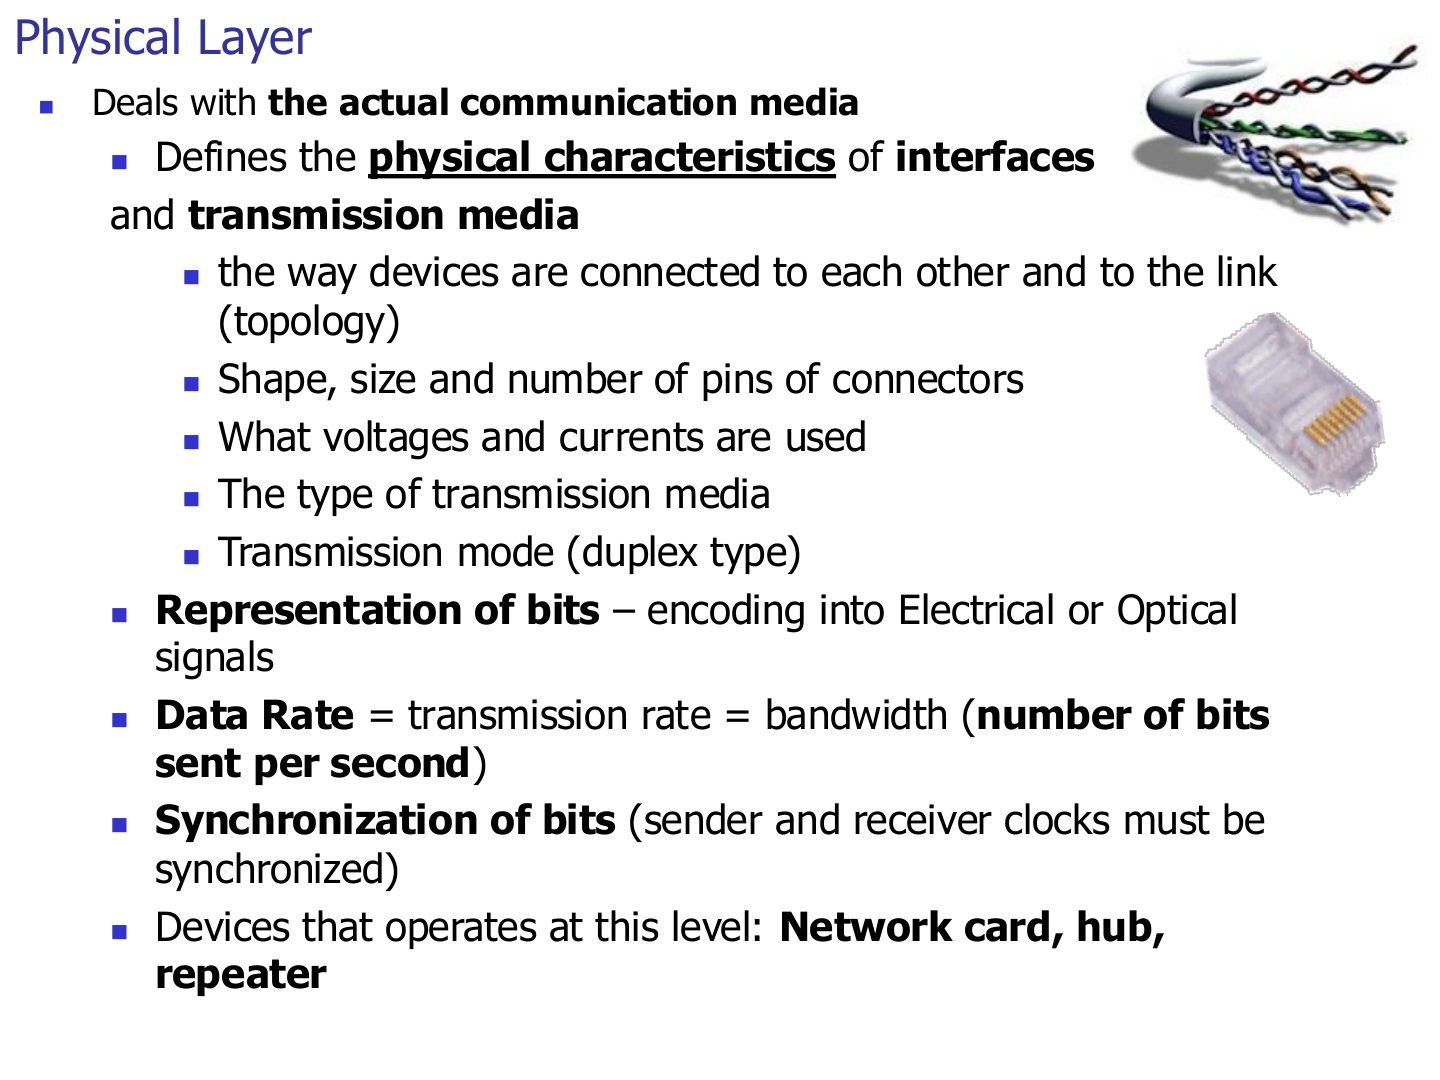
- 3 Physical Layer
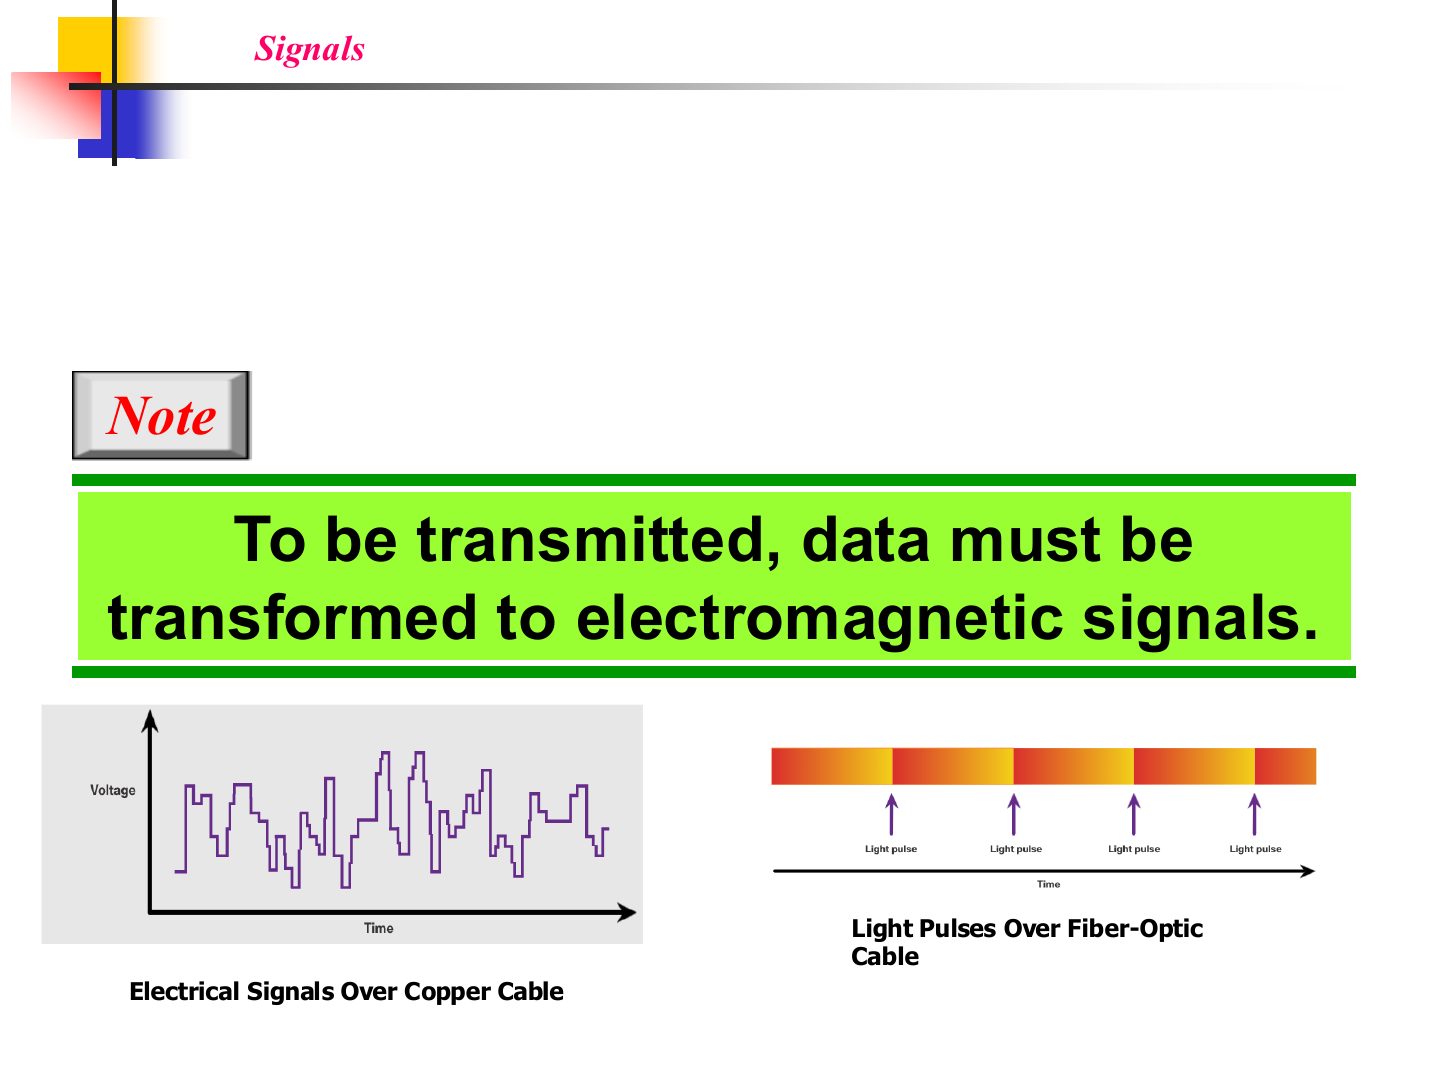
- 4 Signals: data must become electromagnetic signals
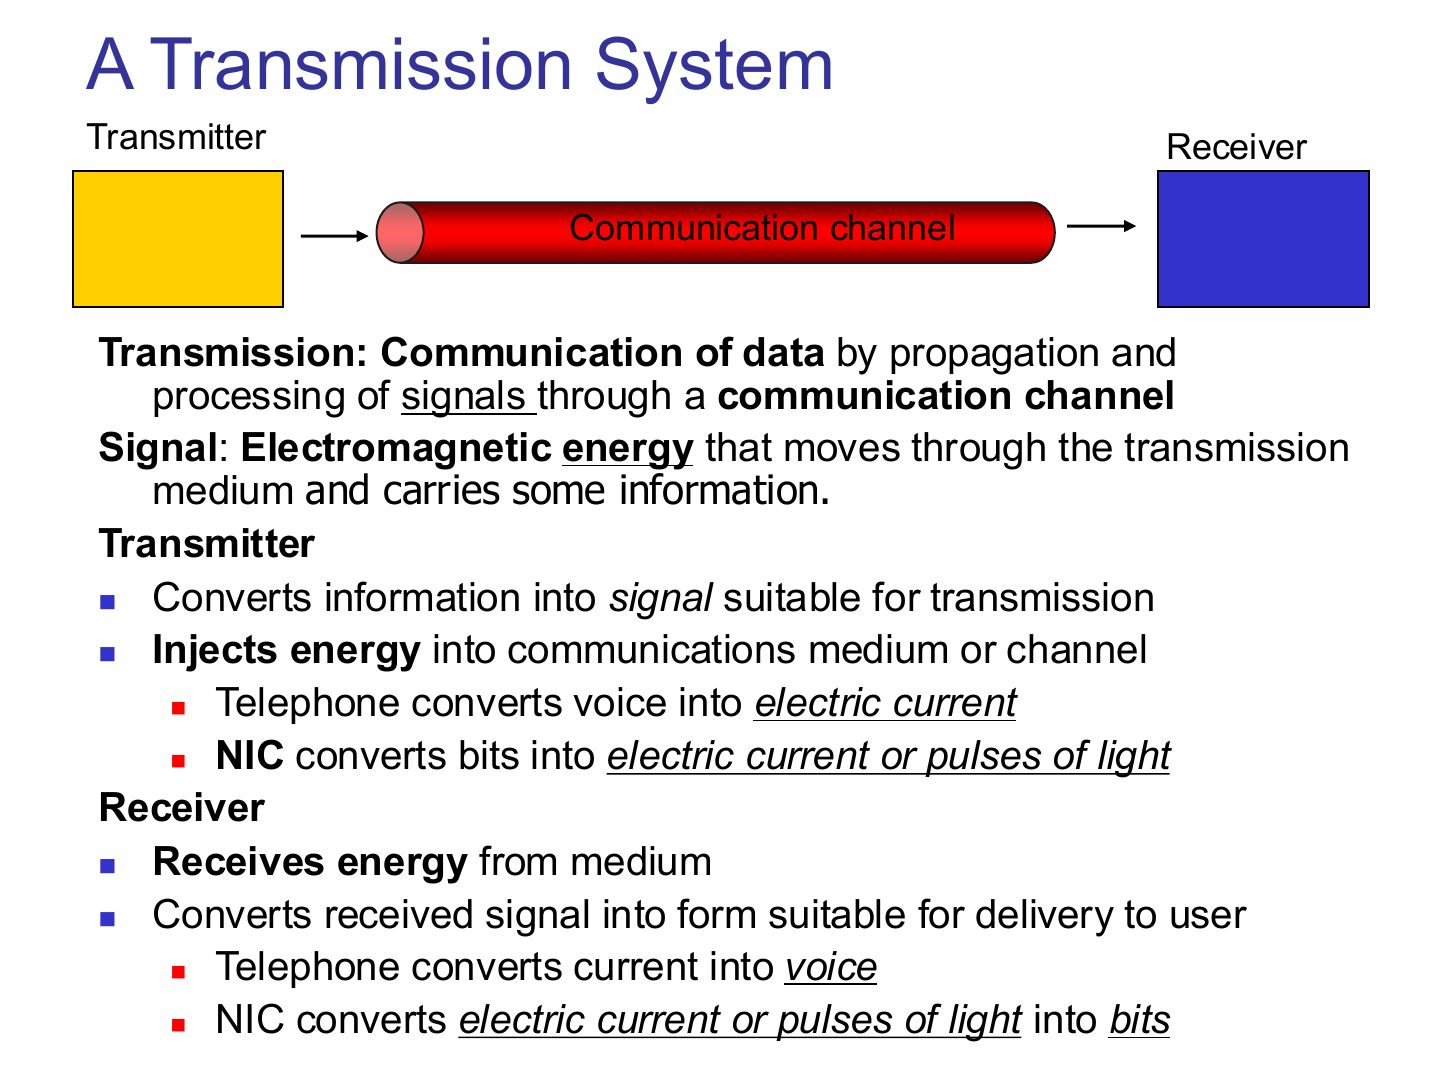
- 5 A Transmission System
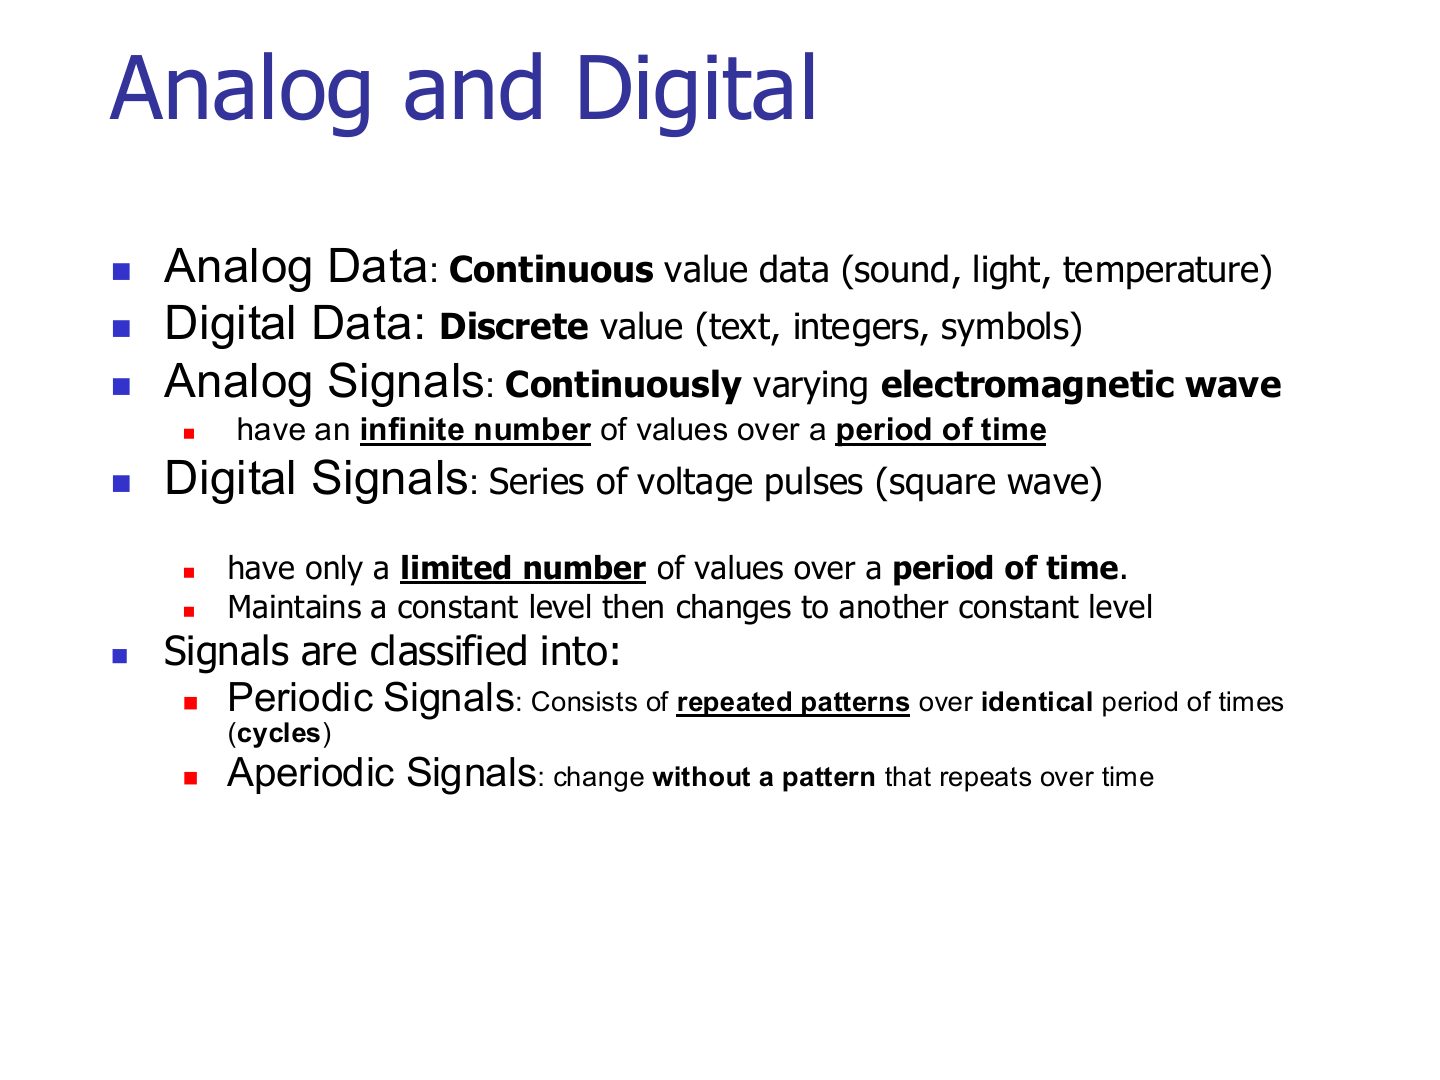
- 6 Analog and Digital
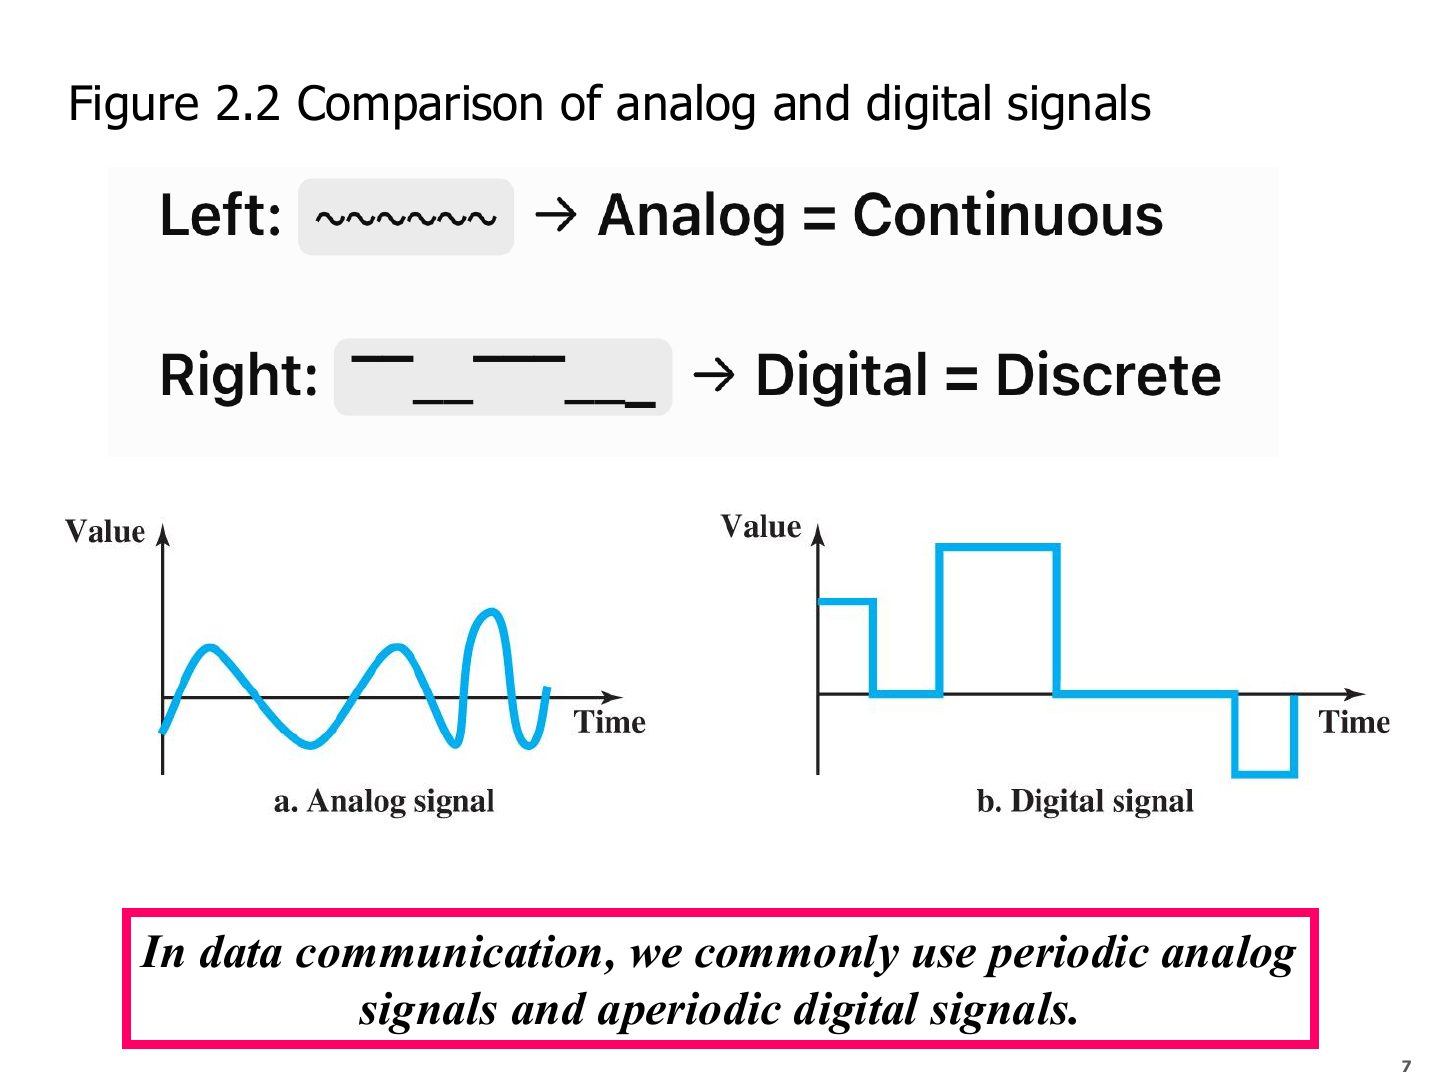
- 7 Comparison of analog and digital signals (Figure 2.2)
- 8 Note: periodic analog, aperiodic digital
- 9 Note: frequency
- 10 Note: frequency and period
- 11 Example
- 12 Example
- 13 Simple and composite signals
- 14 Digital Signals
- 15 Two digital signals, one with two and one with four bit-levels
- 16 Bit rate and bit interval
- 17 Example: bit interval
- 18 Advantages of Digital Transmission
- 19 Signal corruption
- 20 Transmission Impairments
- 21 Attenuation
- 22 Distortion
- 23 Noise
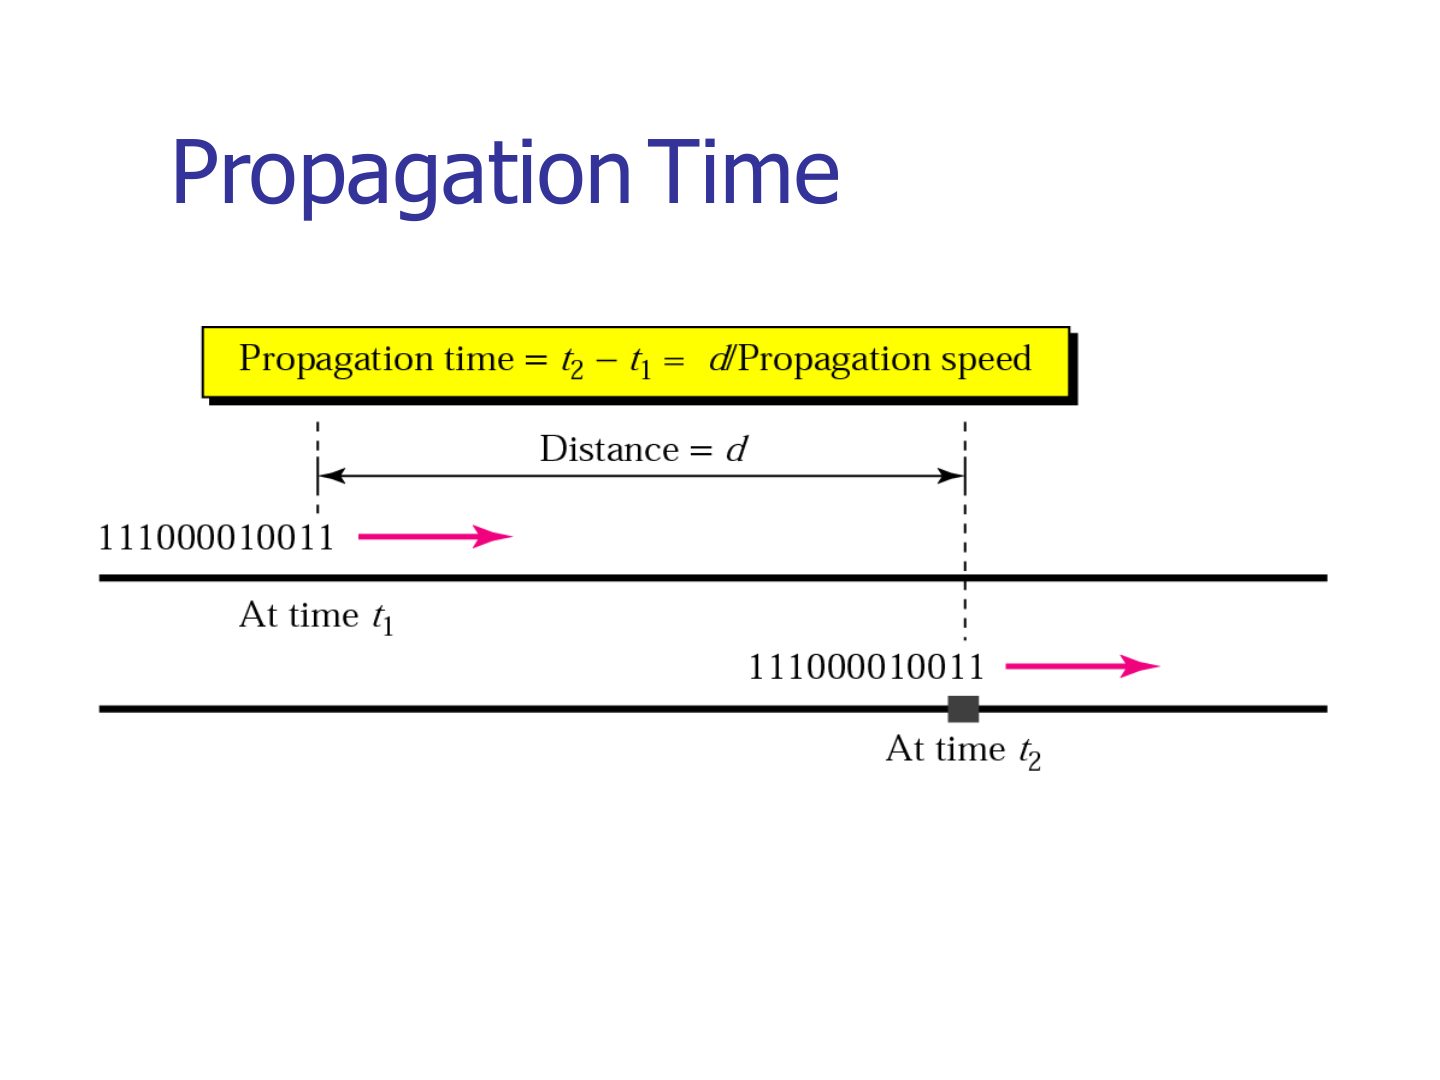
- 24 Performance: propagation time and speed
- 25 Propagation Time
- 26 Other Physical layer definitions – Transmission Time
- 27 Example
- 28 Example (continued)
- 29 Example
- 30 Example (continued)
- 31 Example: a satellite link
- 32 Bandwidth-delay product (Figure 2.7)
- 33 Filling the link with bits for case 1
- 34 Filling the link with bits in case 2
- 35 Other Physical layer definitions - Wavelength
Physical Layer
Notes
Signals → analog vs. digital → frequency, period, bit rate → impairments → delays → bandwidth-delay product.
Calculation deck: practise every example with units (ms, µs, Mbps vs. MB).
Tip Formula sheet: f = 1/T · bit interval = 1/bit rate · propagation = distance / speed · transmission = size in bits / bandwidth · BDP = bandwidth × delay · wavelength = speed / f.
Chapter 2: Outline
Notes
This part covers 2.1 signals and 2.2 impairment, plus the delay definitions. Media (2.6) is in Part 2.
Exam angle
Physical Layer
Notes
Same list as Ch 1 Part 2: interfaces, media, connectors, voltages, duplex mode.
Plus: encoding bits into signals, the data rate, and keeping sender and receiver clocks in sync.
Seen again Ch 1 Part 2, slide 26: First look at the physical layer
Signals: data must become electromagnetic signals
Notes
Data can’t travel as-is: it must be turned into an electromagnetic signal (voltage on copper, light in fiber, radio in air).
Exam angle
To be transmitted, data must be transformed to electromagnetic signals.
A Transmission System
Analog and Digital
Notes
Trap Analog/digital is about the VALUES; periodic/aperiodic is about the PATTERN over time. They are separate classifications.
Exam angle
A signal that can have an infinite number of values in a range is:
A periodic signal repeats its pattern over identical periods called cycles.
Comparison of analog and digital signals (Figure 2.2)
Notes
Rule from the slide: data communication uses PERIODIC ANALOG and APERIODIC DIGITAL signals.
Exam angle
In data communication we commonly use:
Note: periodic analog, aperiodic digital
Notes
Repeated on purpose: periodic analog + aperiodic digital is a classic MCQ.
Note: frequency
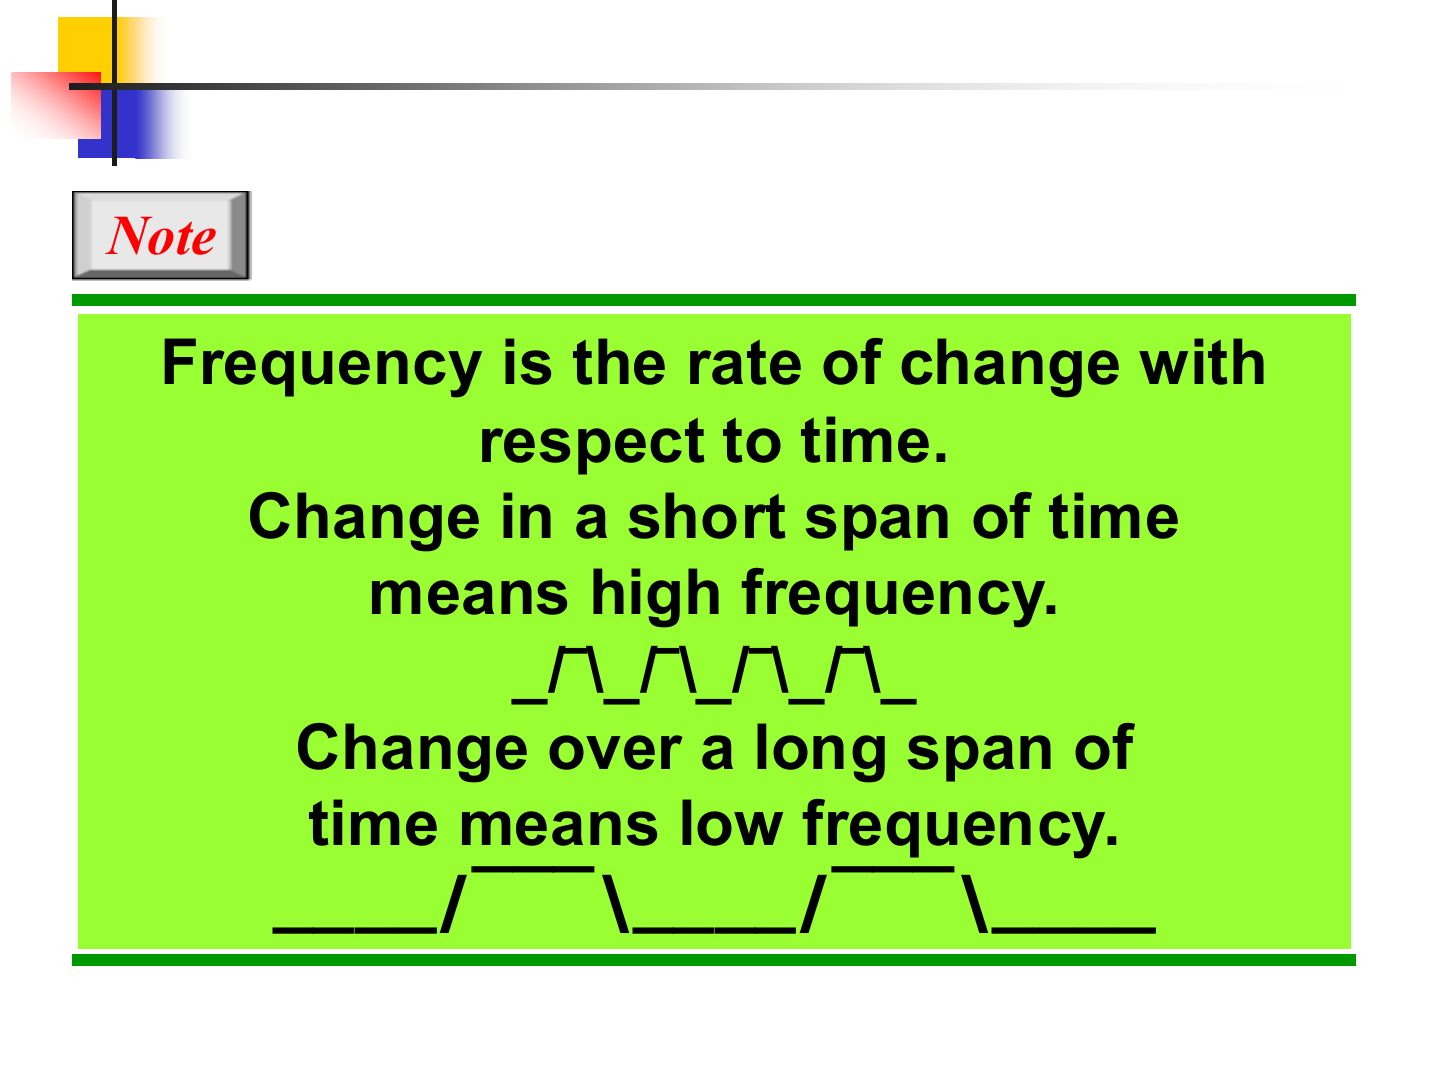
Notes
A signal that never changes has frequency 0.
Note: frequency and period
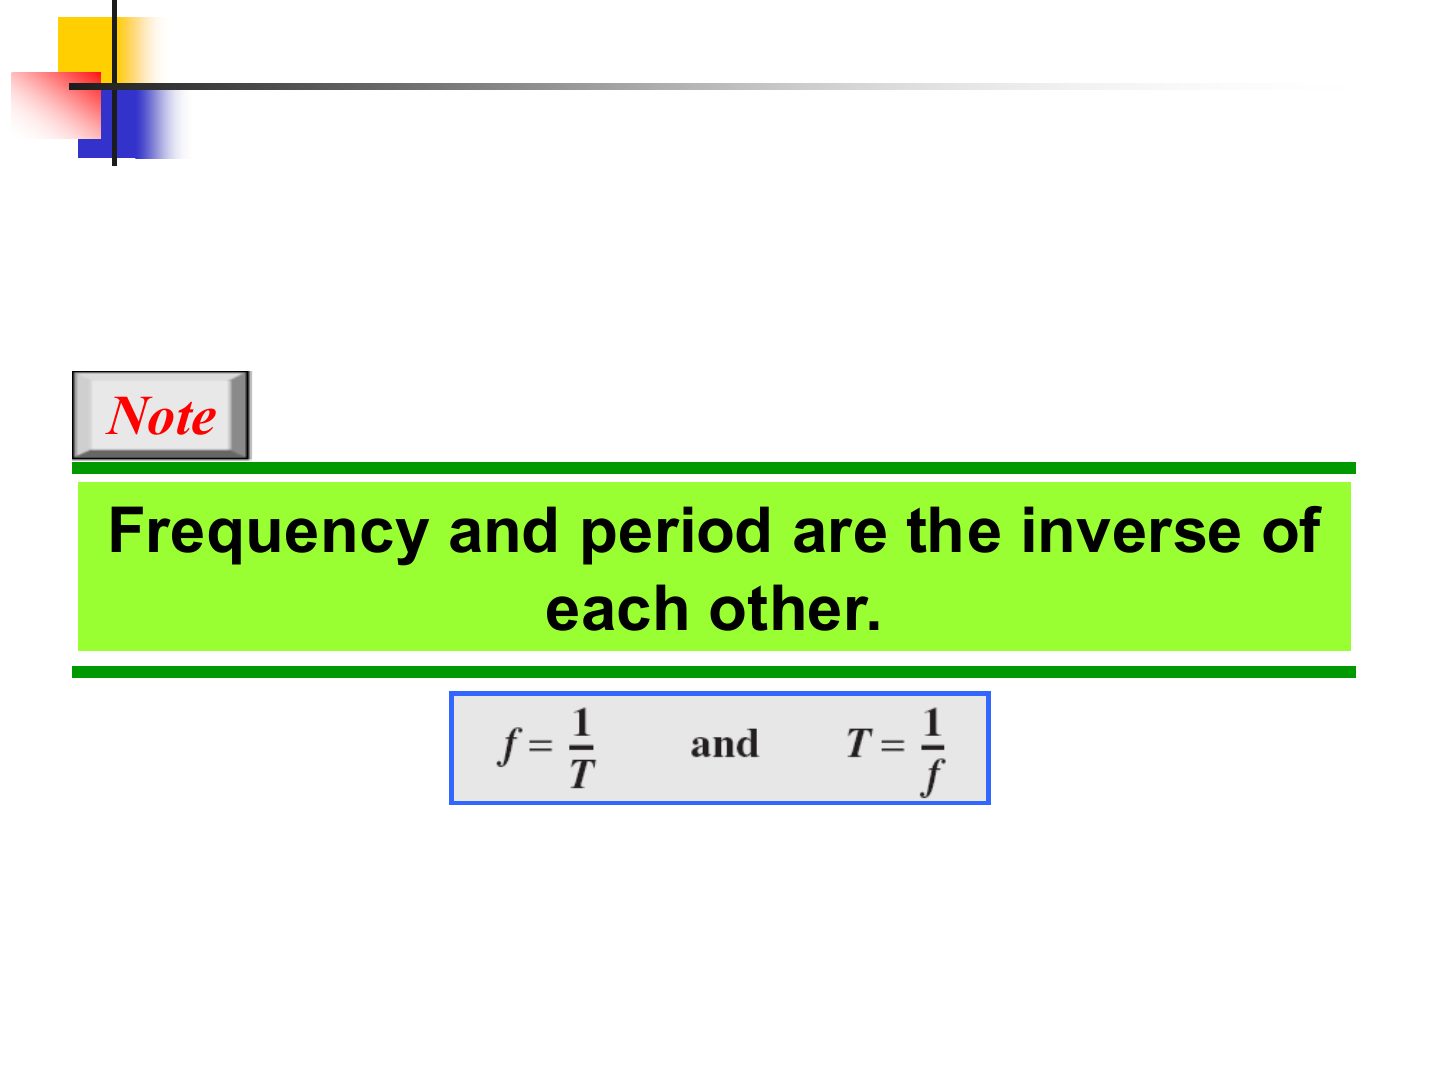
Notes
f in hertz (cycles per second), T in seconds.
Memory trick Units pair up: s ↔ Hz, ms ↔ kHz, µs ↔ MHz, ns ↔ GHz.
Exam angle
Q5 · period of a 5 kHz signal
An analog signal has a frequency of 5 kHz. Its period is:
- Tutorial 3, Q5: T = 1/5000 = 0.0002 s = 200 µs.
An analog signal has a frequency of 5 kHz. What is its period, and how are frequency and period related?
Compare with the model answer
They are inverses: T = 1/f. T = 1/5000 Hz = 0.0002 s = 200 µs.
Example
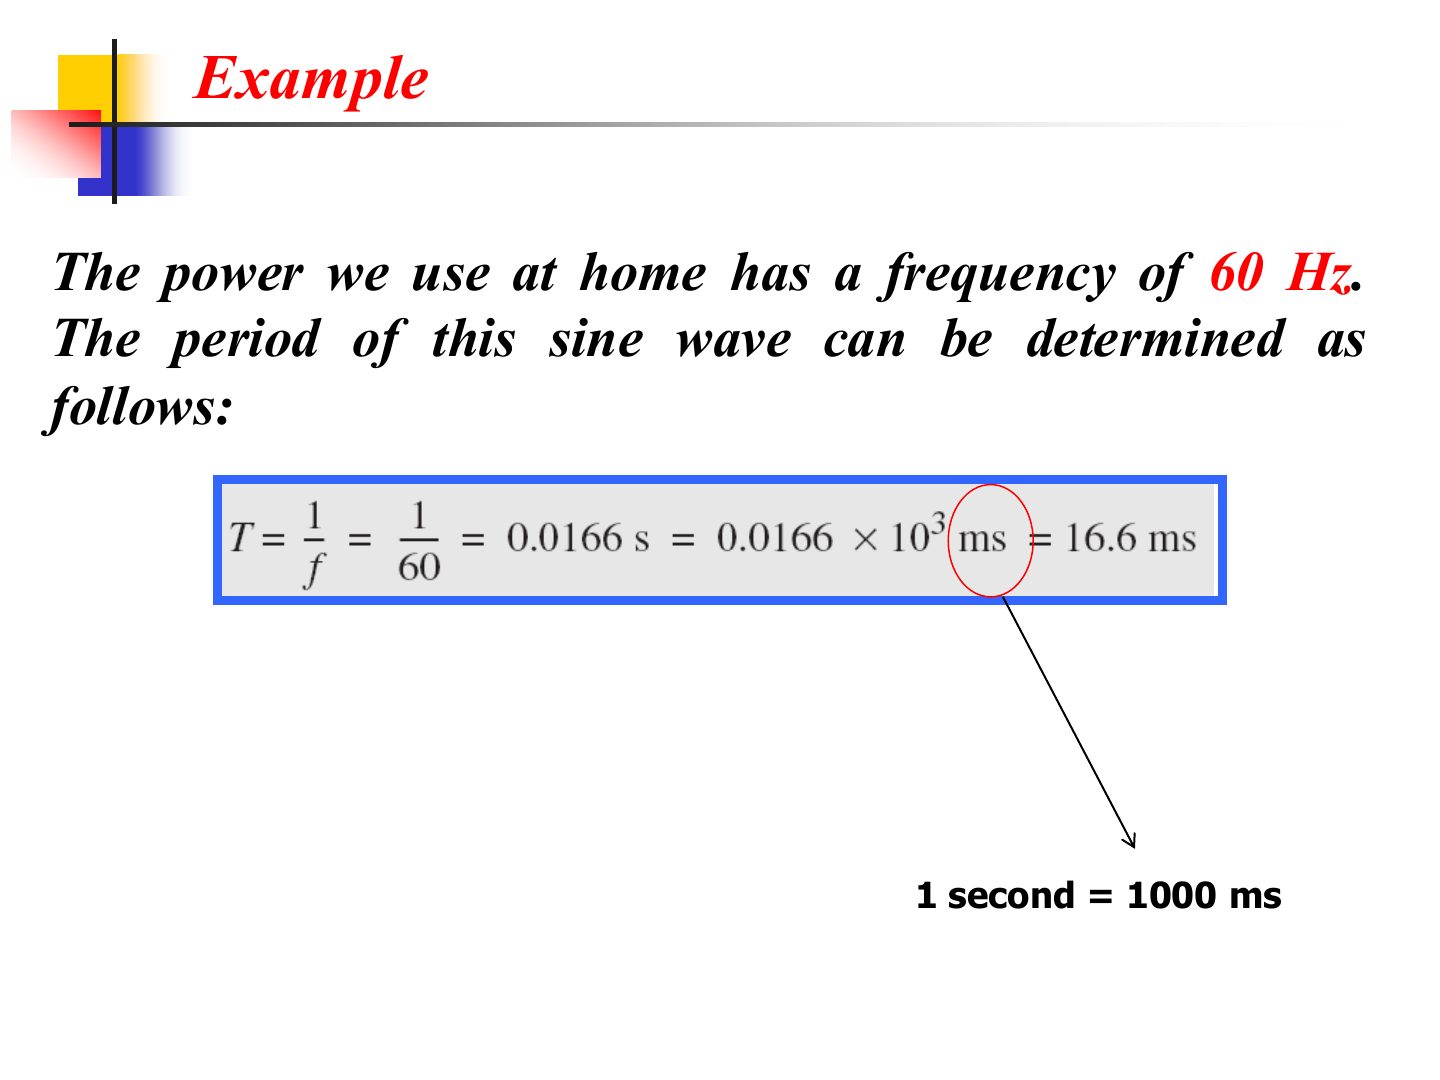
Notes
Multiply seconds by 1000 to get ms.
Example
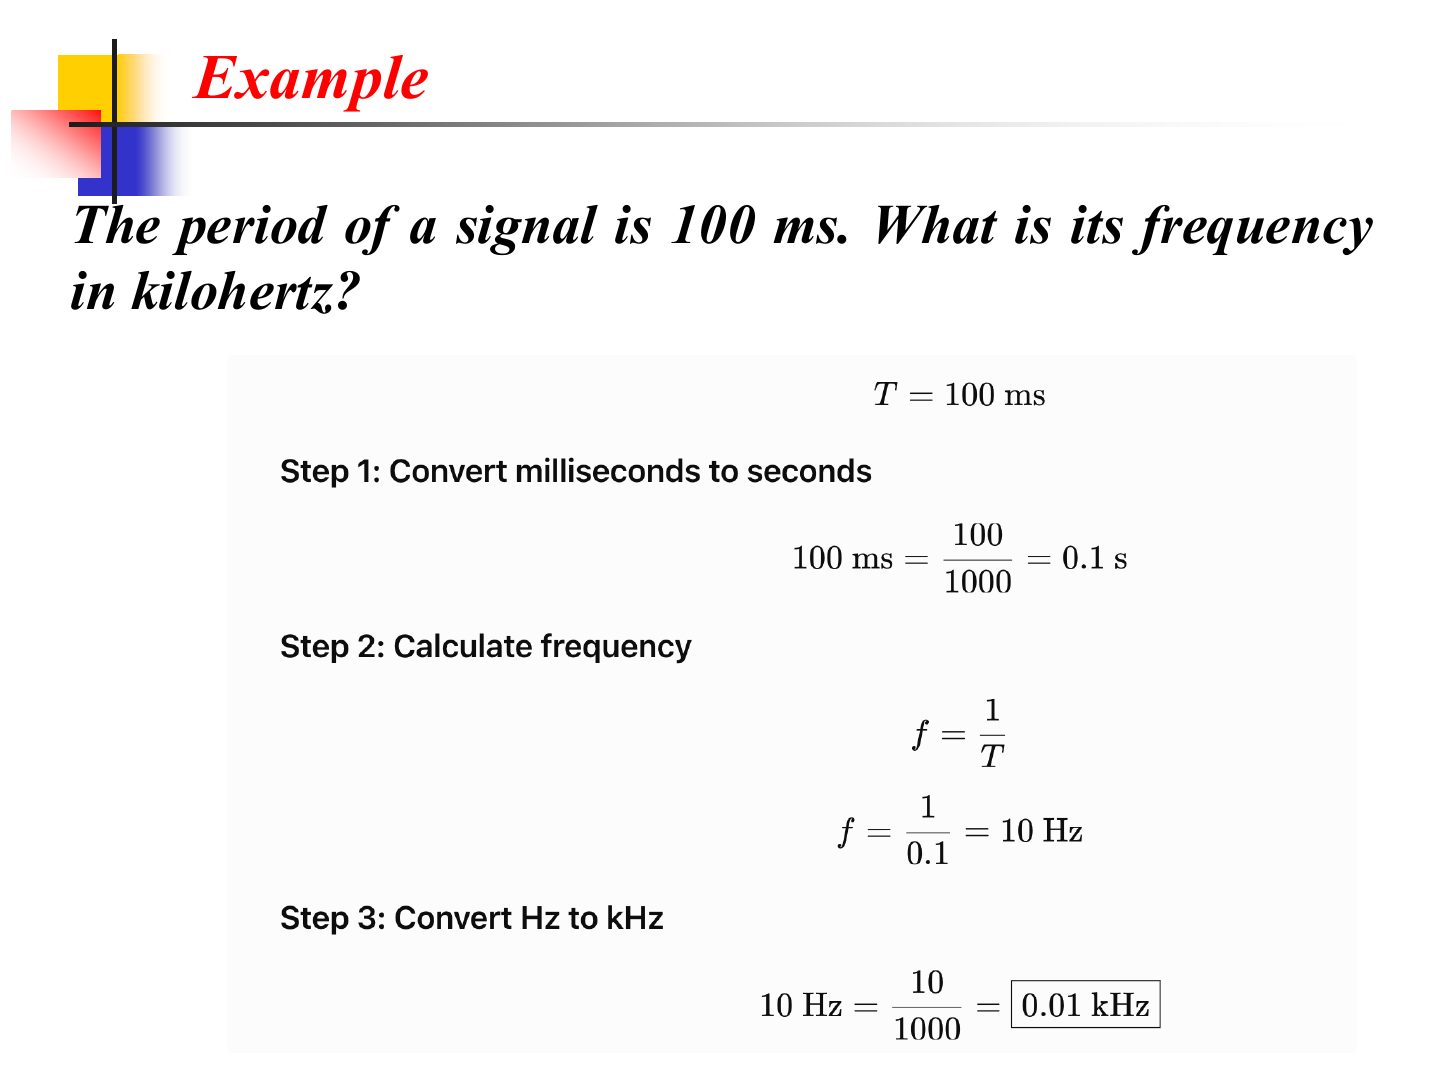
Notes
Always convert to base units (s, Hz) first, then to the unit asked.
Exam angle
A signal has a period of 4 ms. Its frequency is:
- 1 / 0.004 s = 250 Hz.
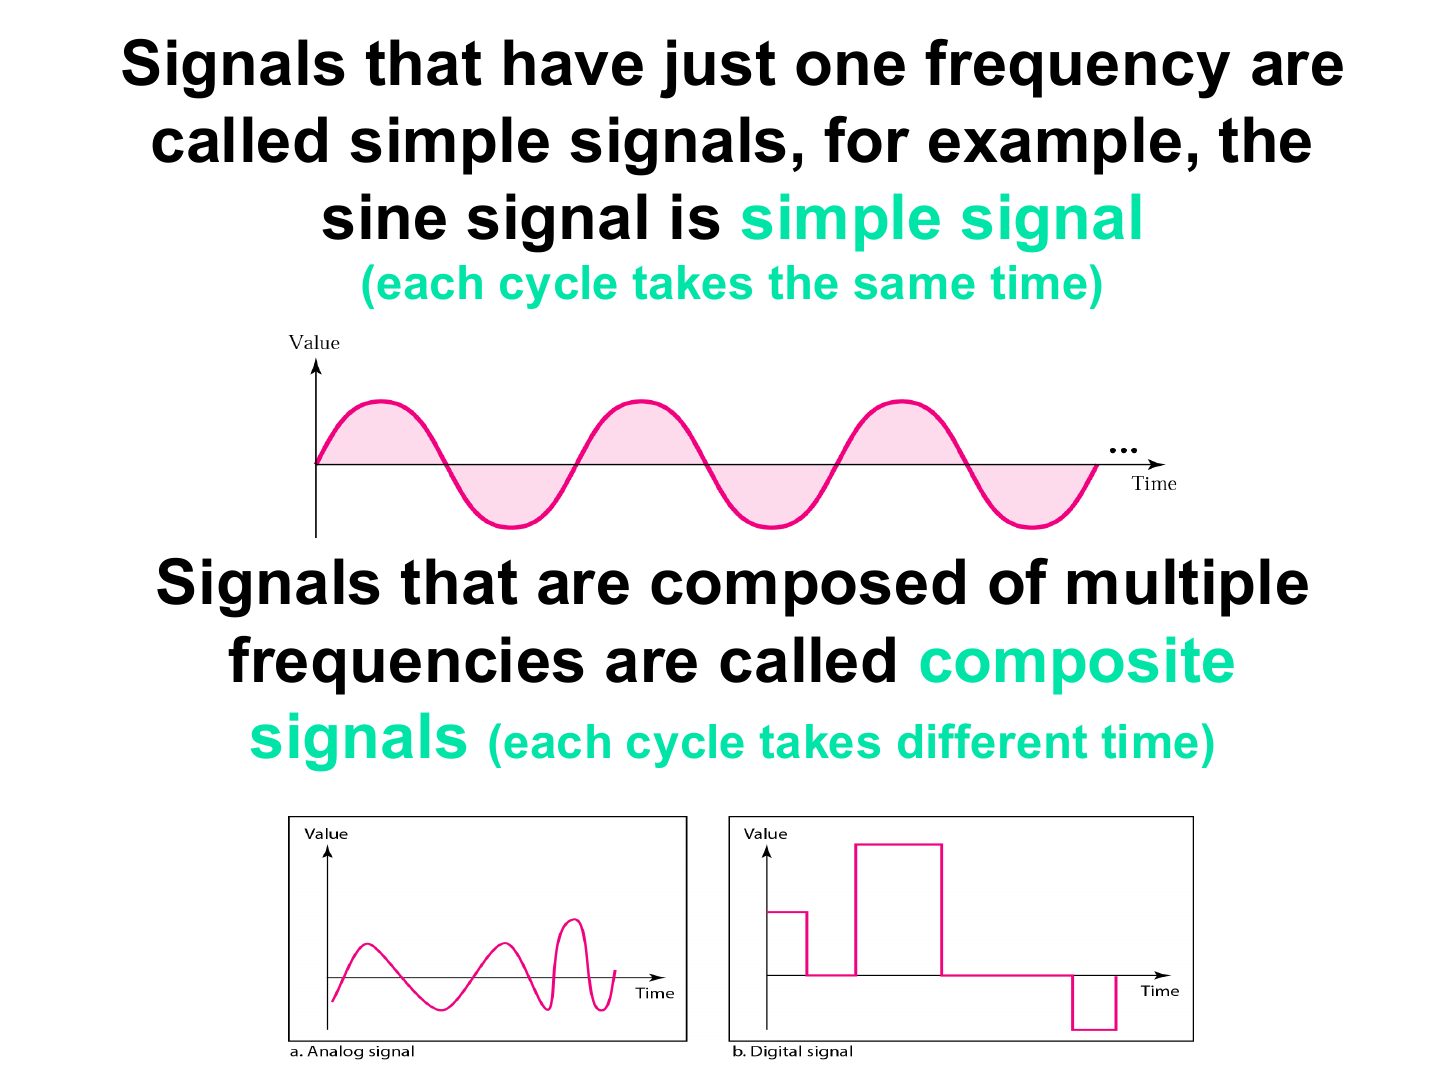
Simple and composite signals
Notes
Simple = one sine wave = one frequency. Composite = many sine waves added together.
Exam angle
Q8 · simple vs. composite signal
What is the key difference between a simple and a composite signal?
Compare with the model answer
A simple signal is a single sine wave, so it has one frequency. A composite signal is several sine waves with different frequencies, amplitudes or phases combined.
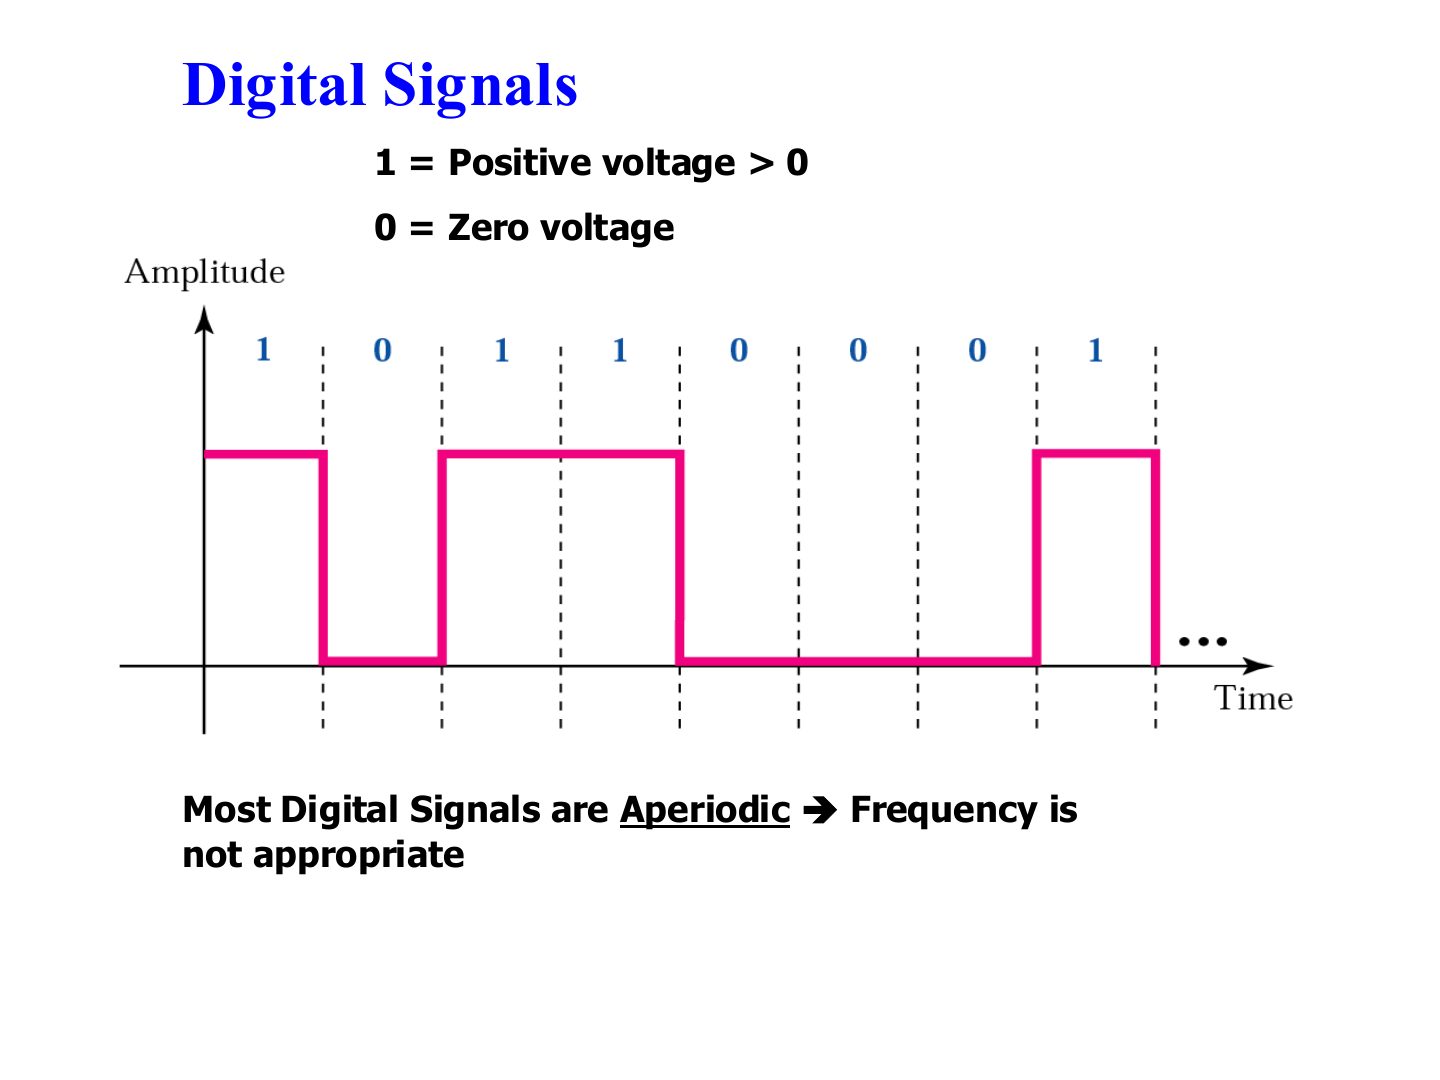
Digital Signals
Notes
For digital signals we use bit rate and bit interval instead of frequency and period.
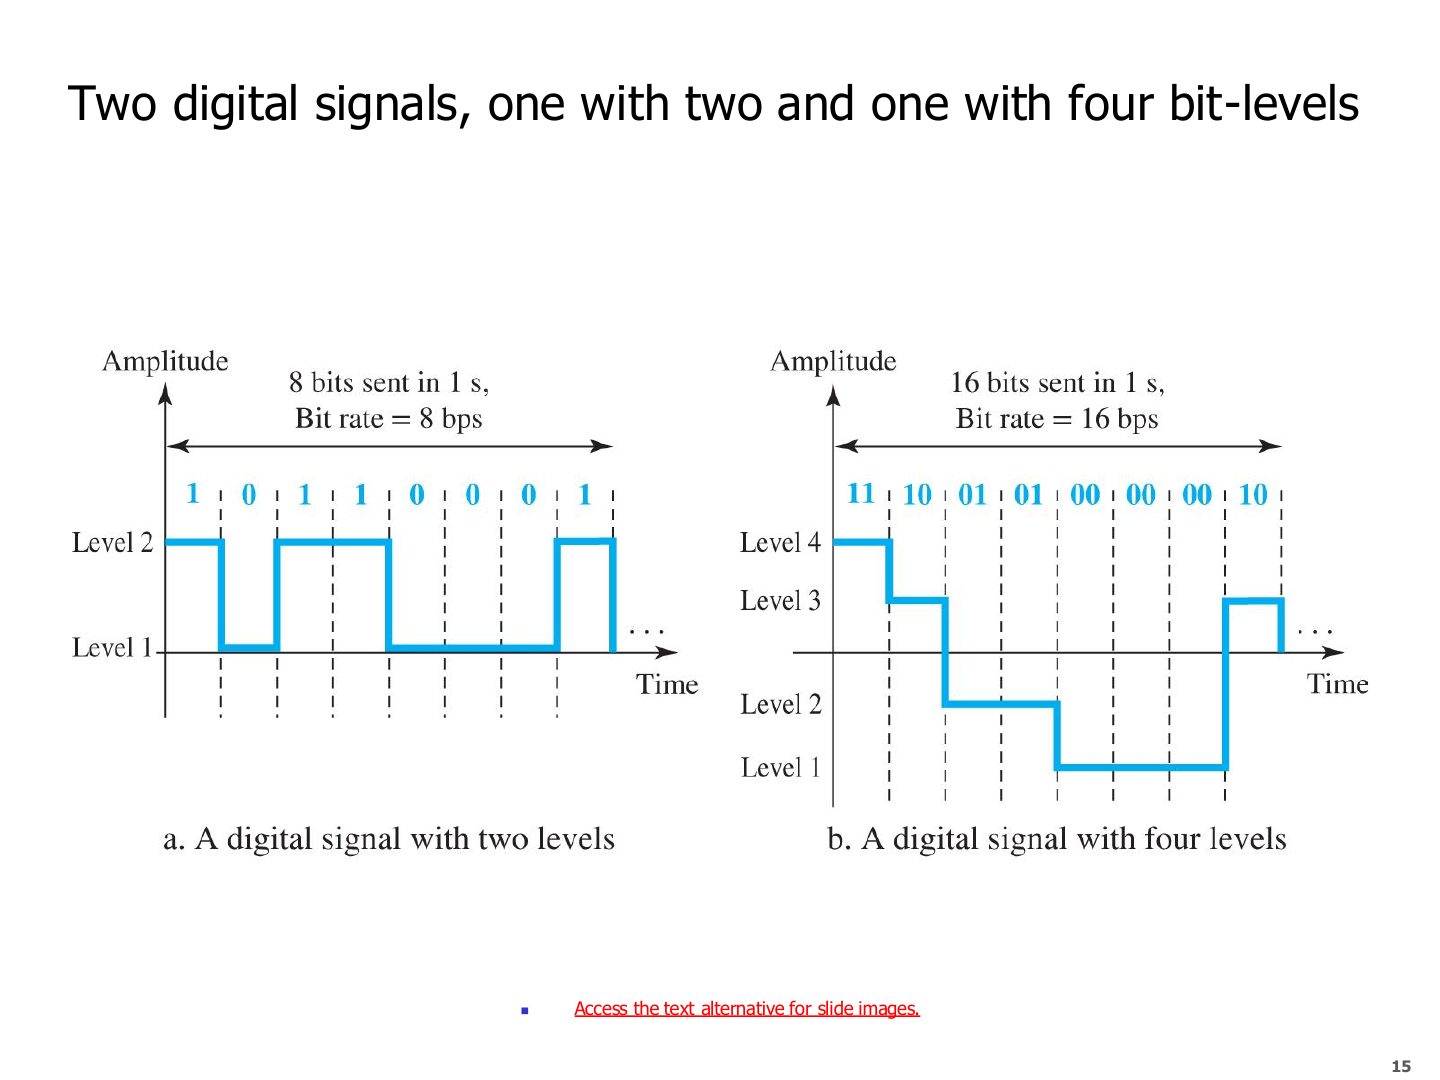
Two digital signals, one with two and one with four bit-levels
Notes
With L levels, each level carries log₂L bits: 2 levels → 1 bit, 4 levels → 2 bits, so twice the bit rate.
Exam angle
A digital signal has 8 levels. How many bits does each level carry?
- log₂8 = 3.
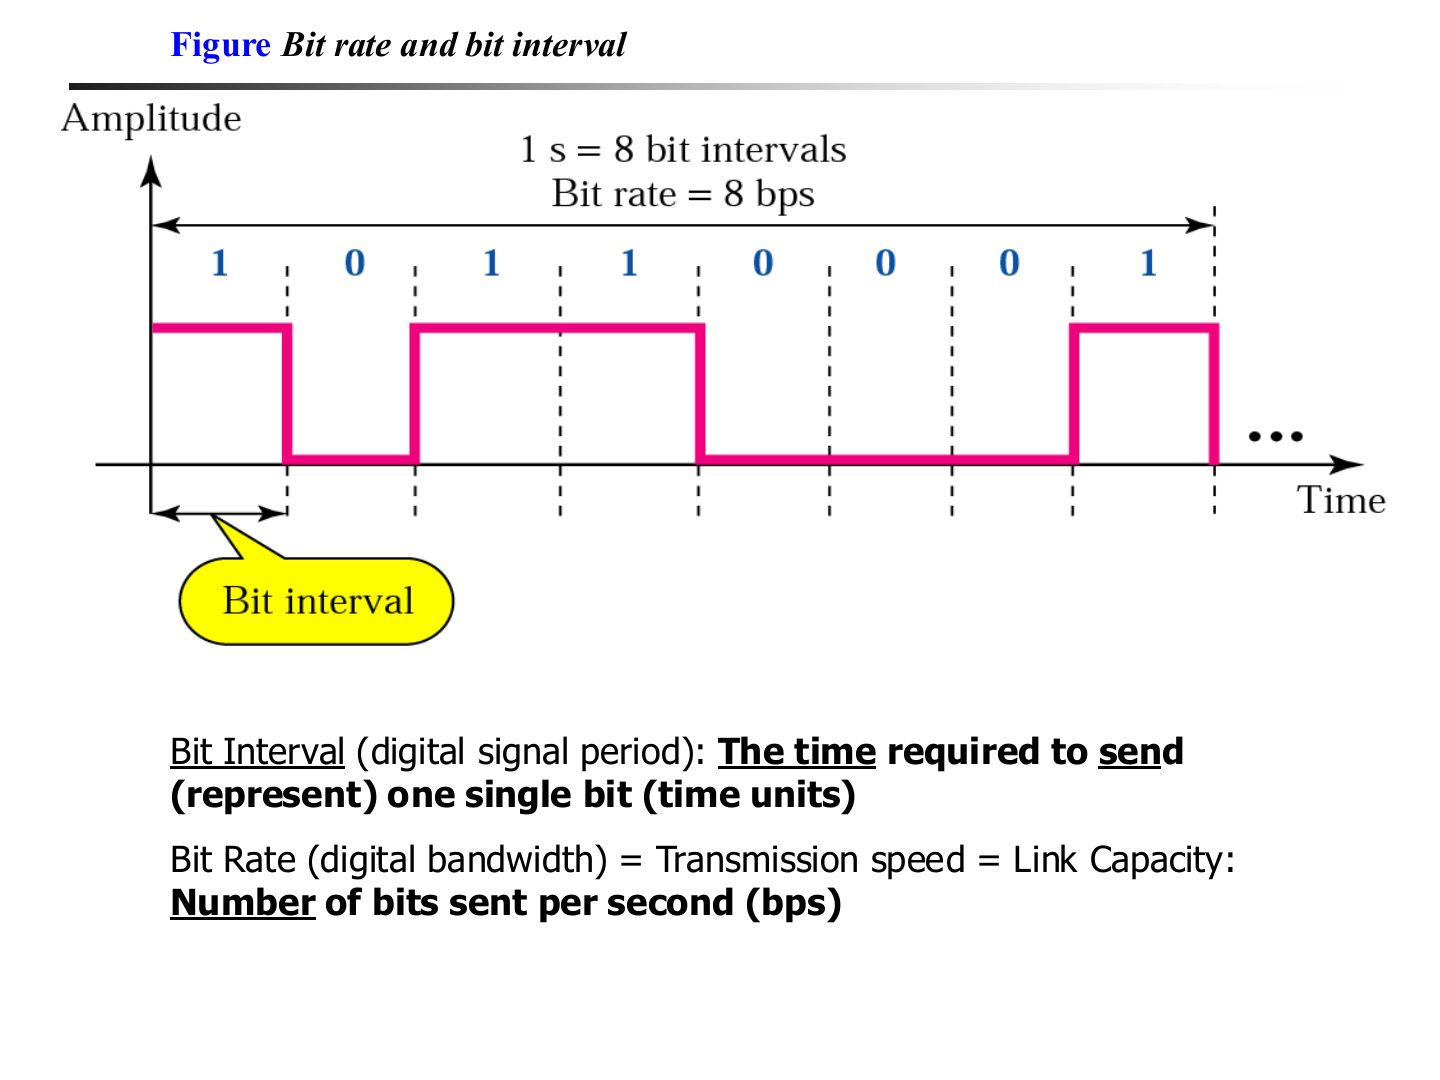
Bit rate and bit interval
Exam angle
Q1 · bit rate from a 50 µs bit interval
A digital signal has a bit interval of 50 µs. Its bit rate is:
- Tutorial 3, Q1: 1 / 0.00005 s = 20,000 bps = 20 Kbps.
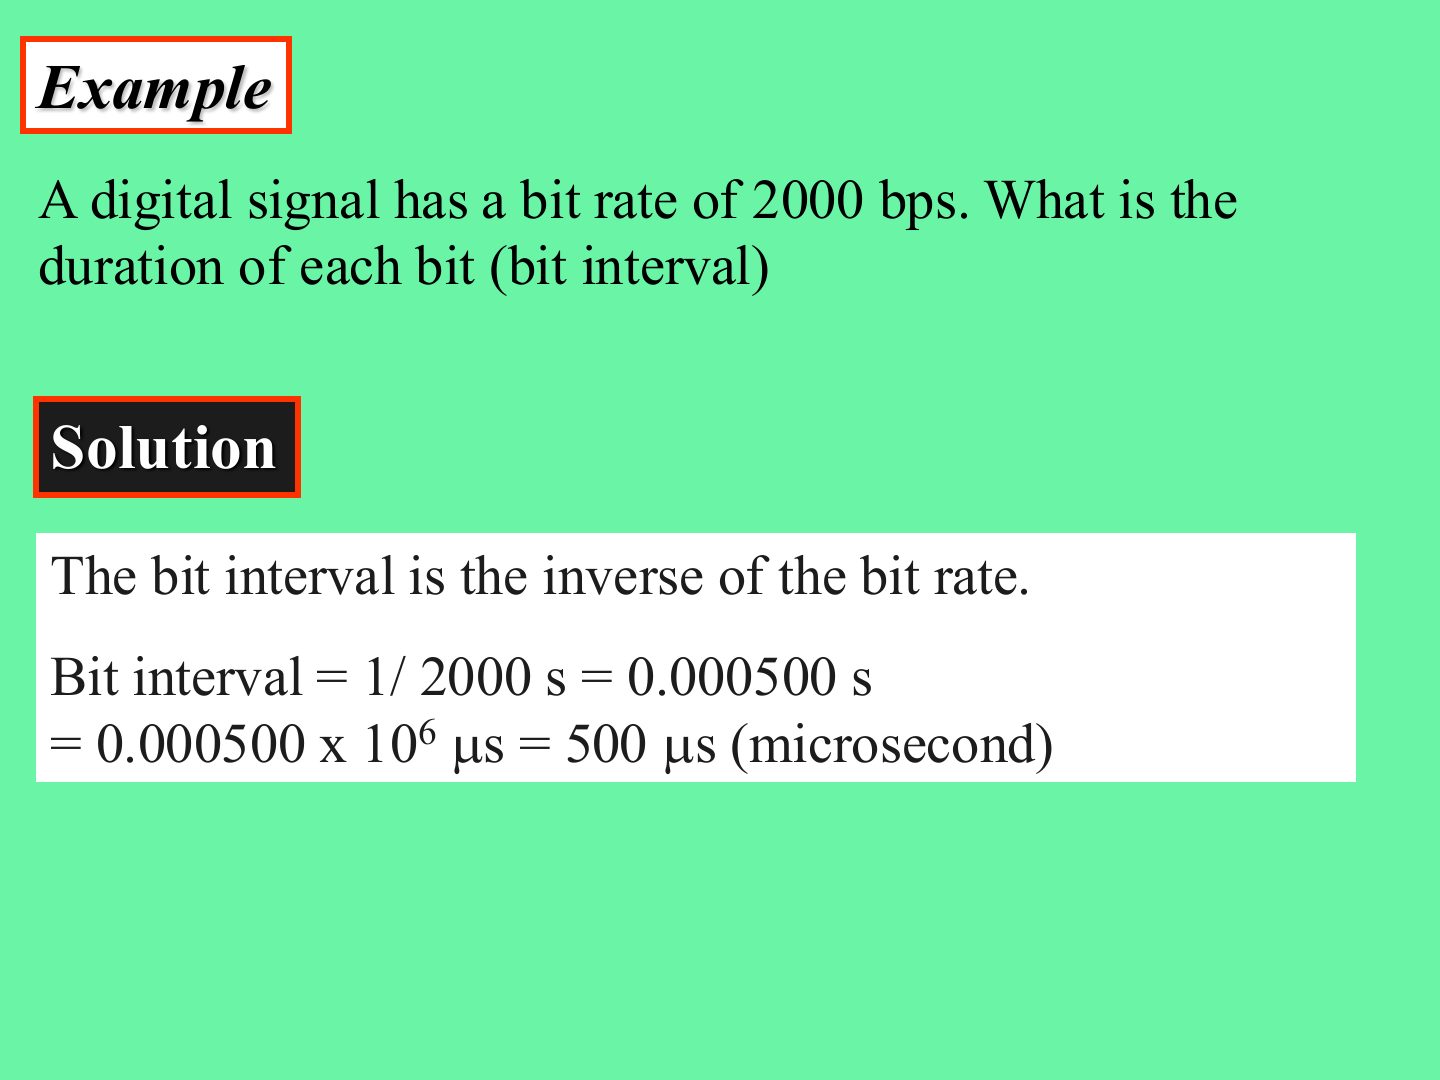
Example: bit interval
Notes
Seconds × 10⁶ = µs.
Exam angle
A signal has a bit rate of 4000 bps. Each bit lasts:
- 1/4000 = 0.00025 s = 250 µs.
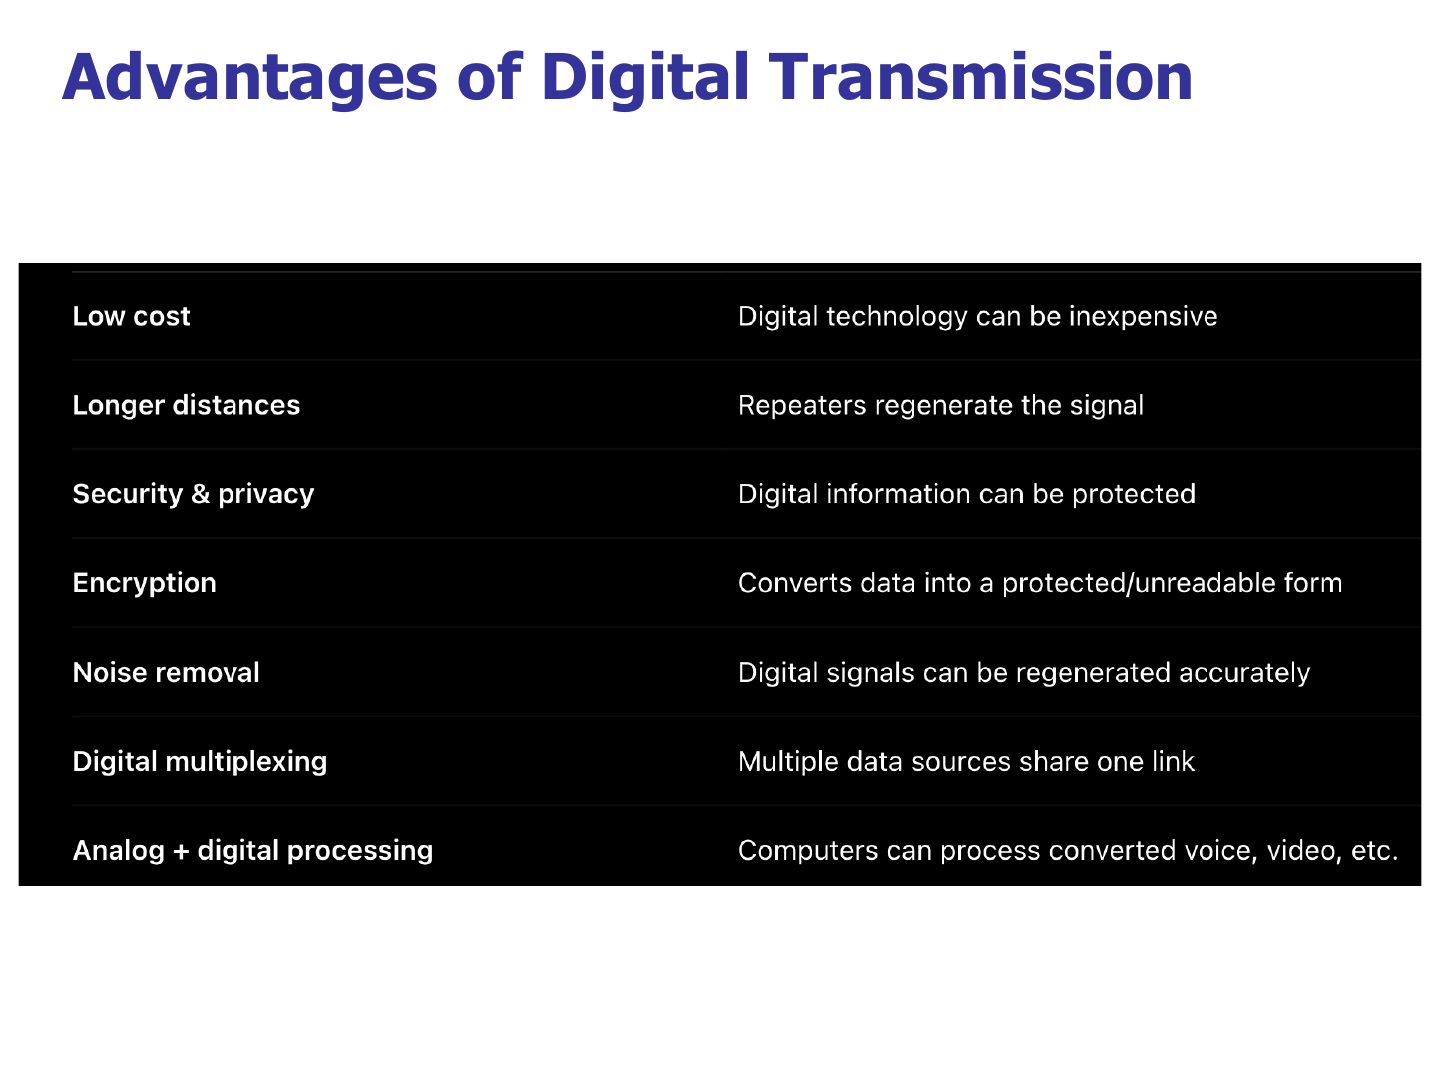
Advantages of Digital Transmission
Exam angle
Related question: Q2 · what a repeater does
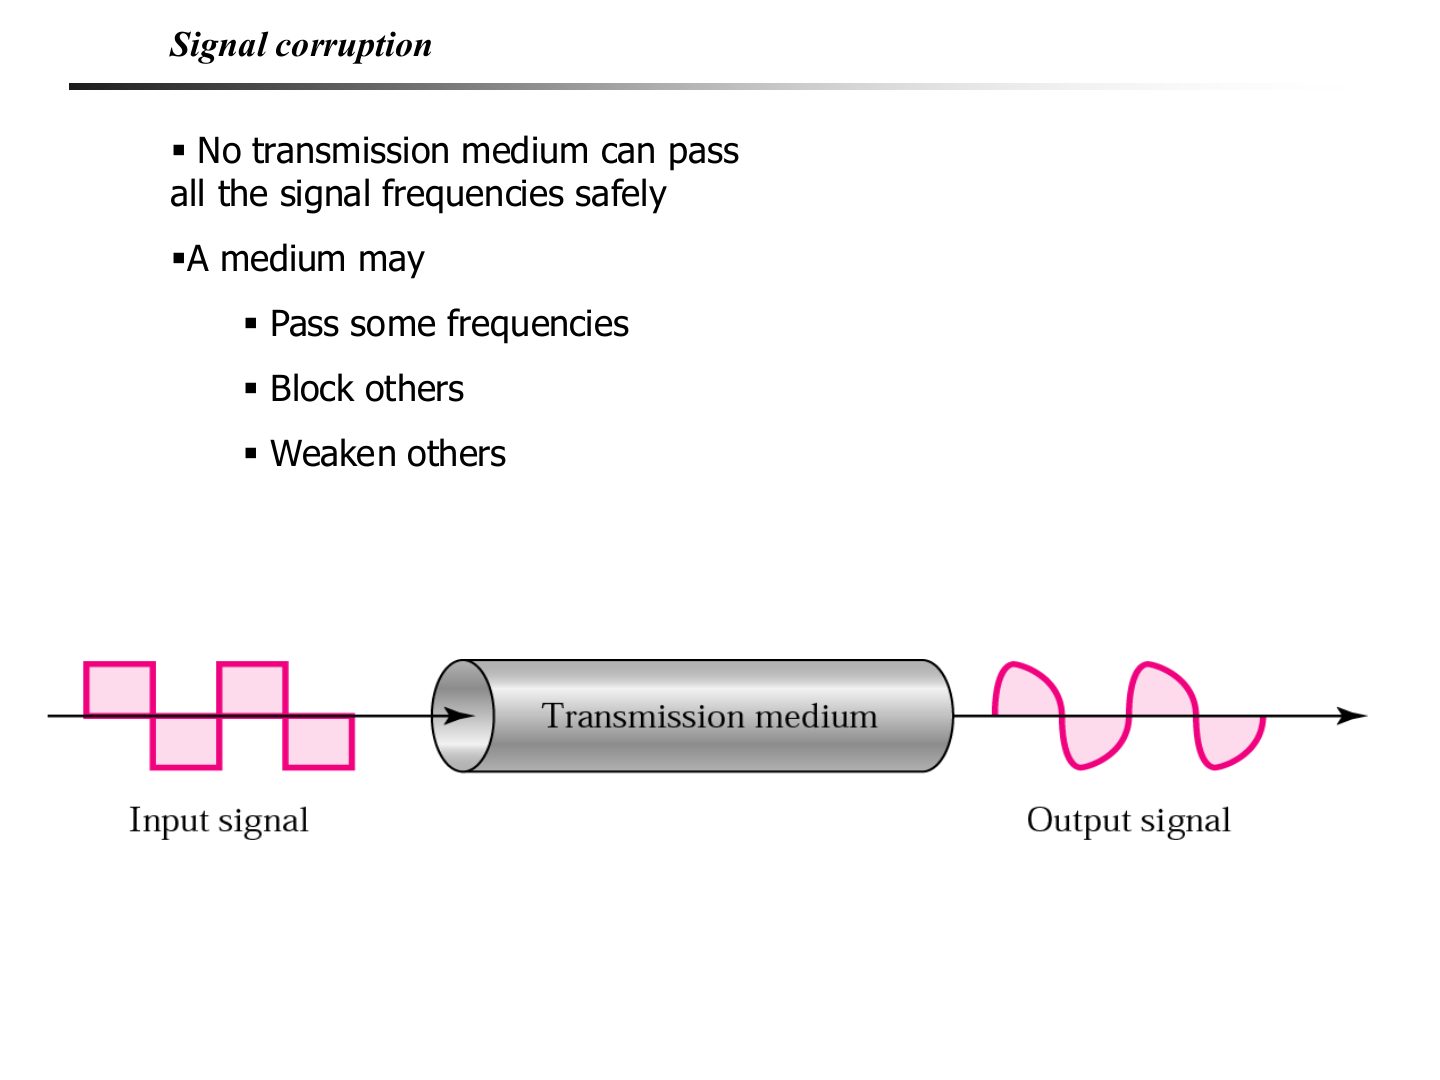
Signal corruption
Notes
A medium passes some frequencies, blocks others and weakens others, so the output never equals the input exactly.
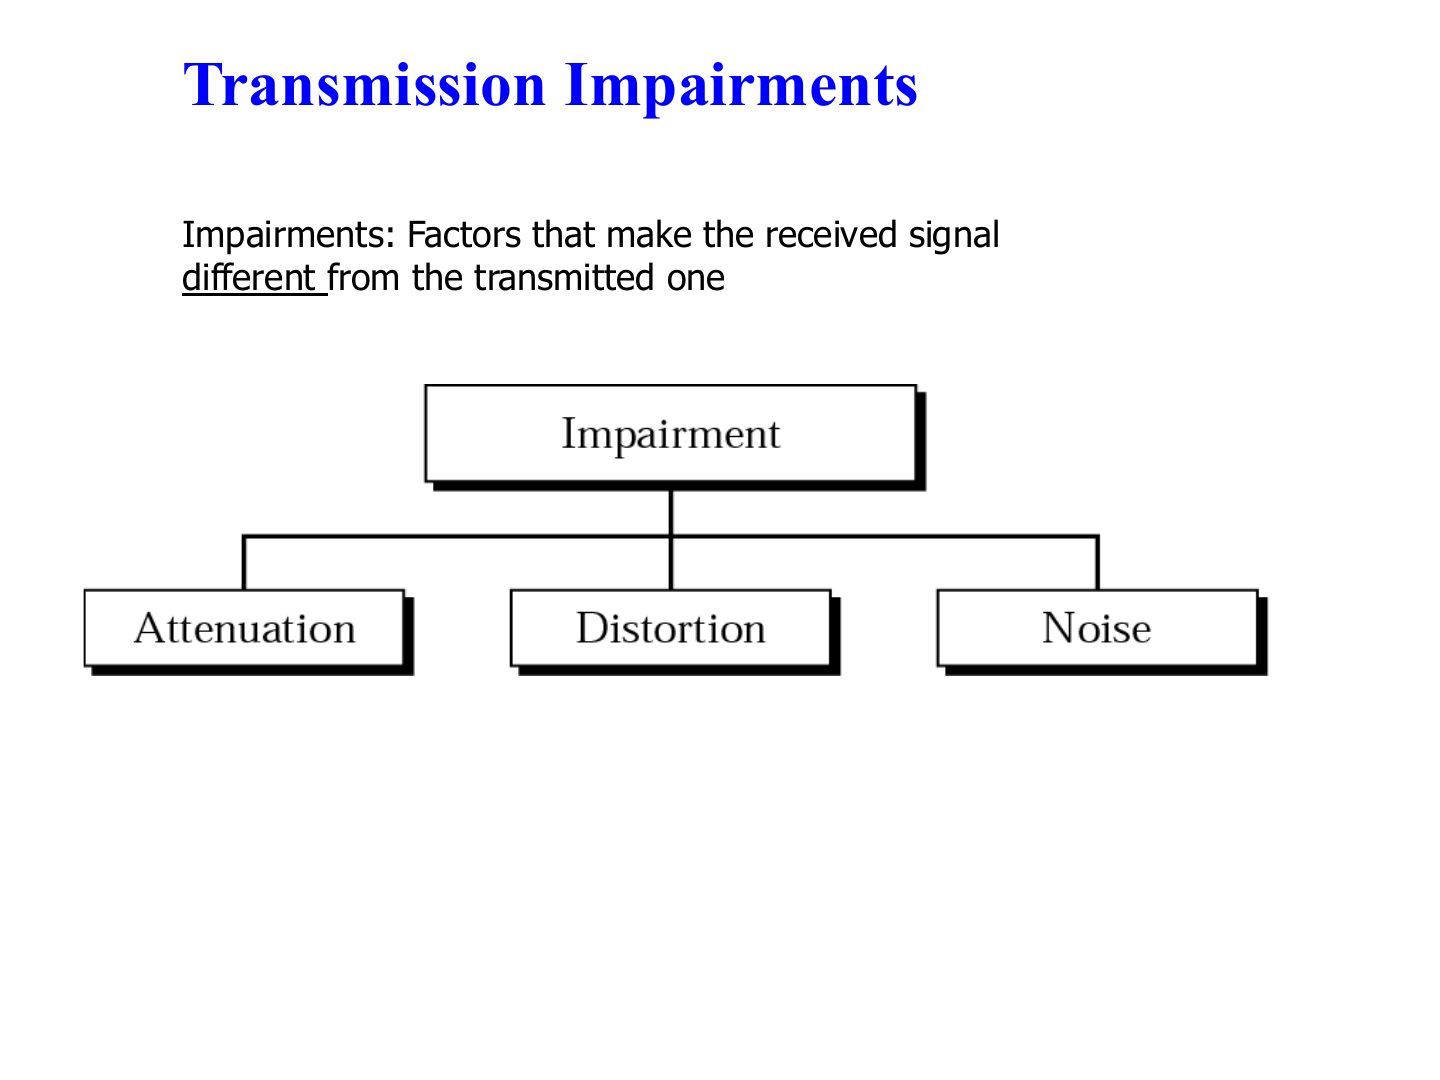
Transmission Impairments
Notes
Three impairments: attenuation, distortion, noise.
Memory trick “ADN”: Attenuation (weaker), Distortion (reshaped), Noise (extra signal).
Exam angle
Which is NOT a transmission impairment?
Attenuation
Notes
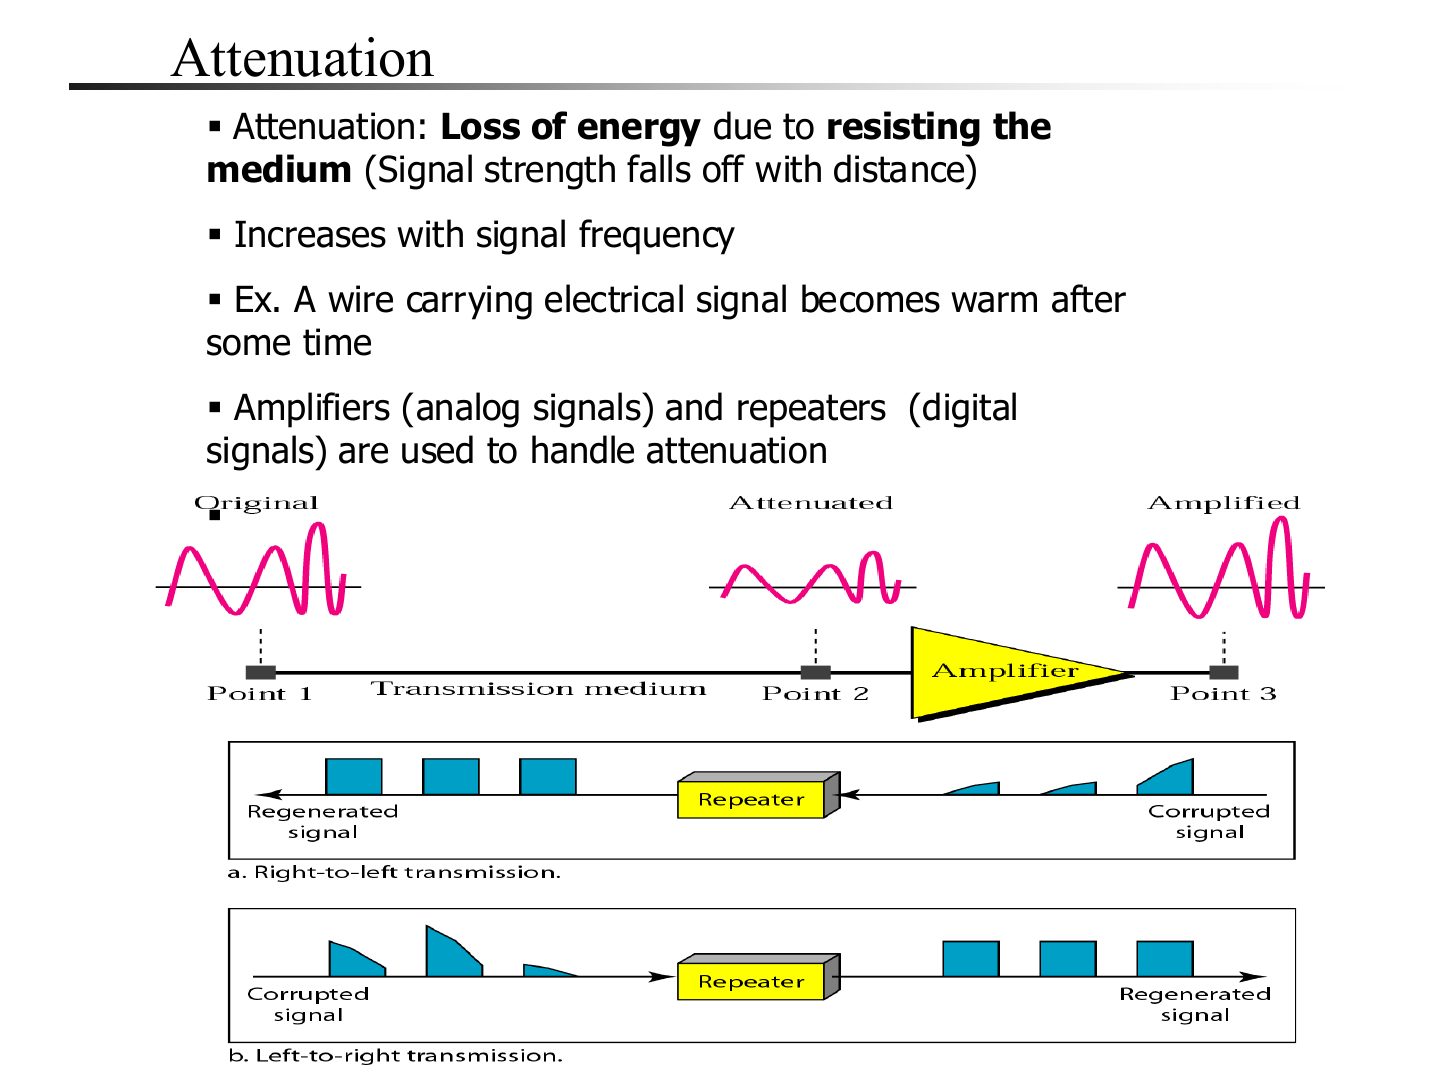
Attenuation = LOSS OF ENERGY (the wire heats up). Worse with distance and with higher frequency.
Fix: amplifiers for analog, repeaters for digital (they regenerate a clean copy).
Trap Amplifiers boost noise too; repeaters regenerate the original bits.
Exam angle
Q2 · repeater regenerates the weakened signal
Loss of signal energy due to the resistance of the medium is called:
What does a repeater do and why is it needed in digital transmission?
Compare with the model answer
It receives a weakened or distorted digital signal, regenerates it and sends a clean copy on. Signals lose strength over distance (attenuation), so repeaters let digital data travel further without losing its form.
Distortion
Notes
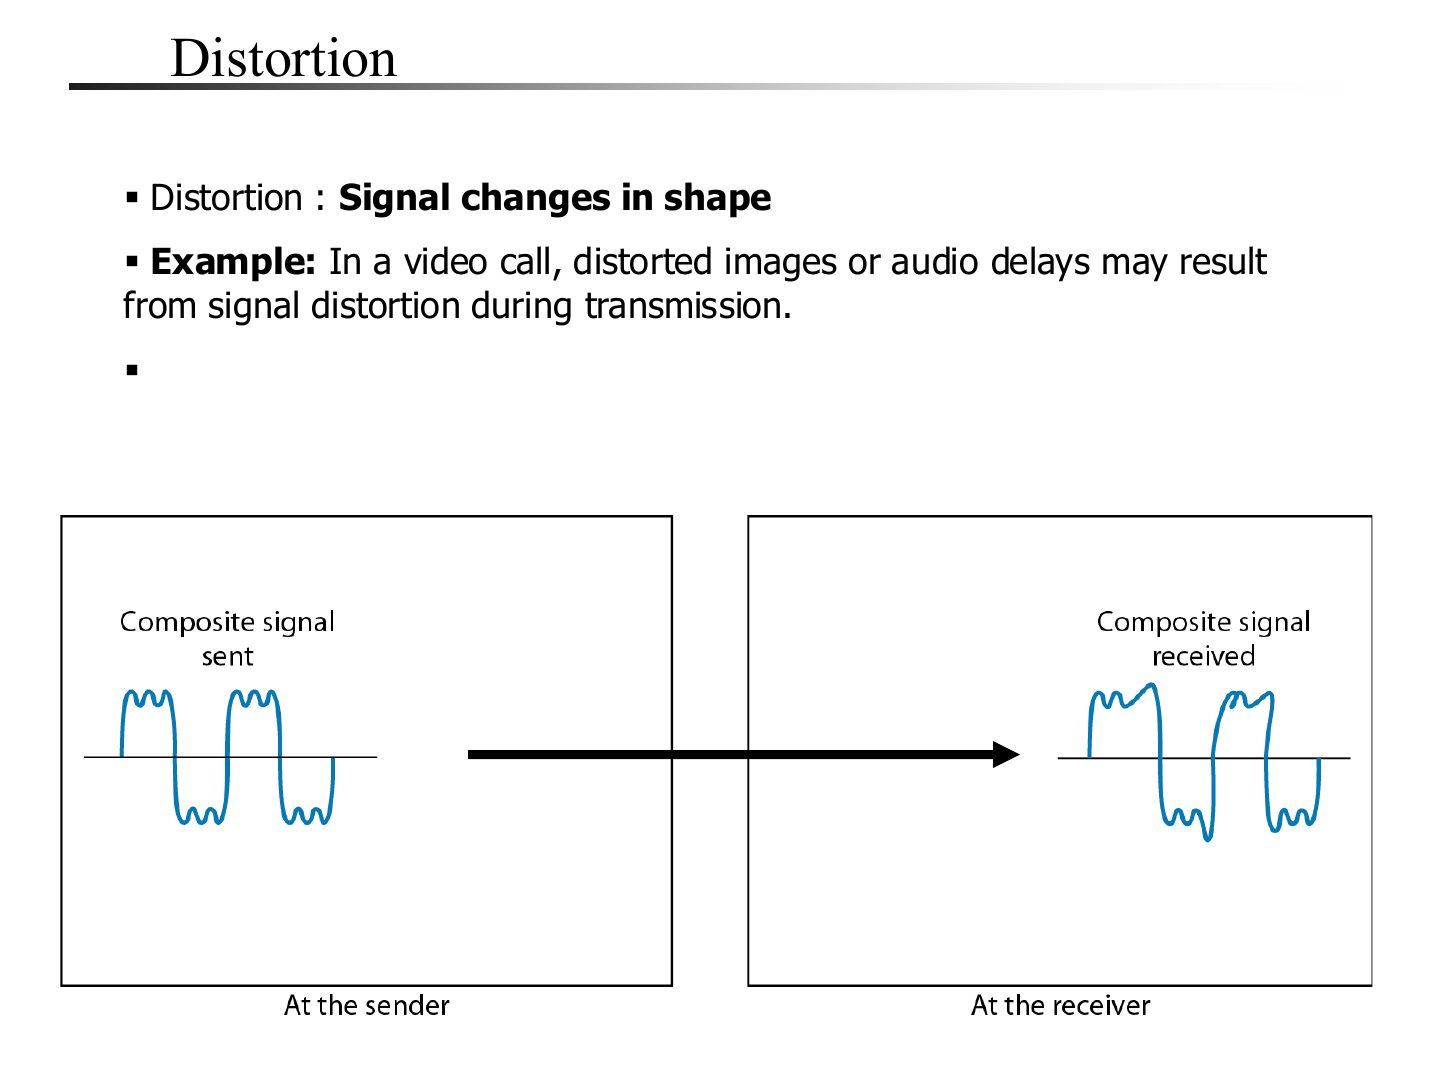
Distortion = the signal changes SHAPE (its frequency components arrive with different delays). Typical for composite signals.
Exam angle
A composite signal arrives with a changed shape. This impairment is:
Noise
Notes
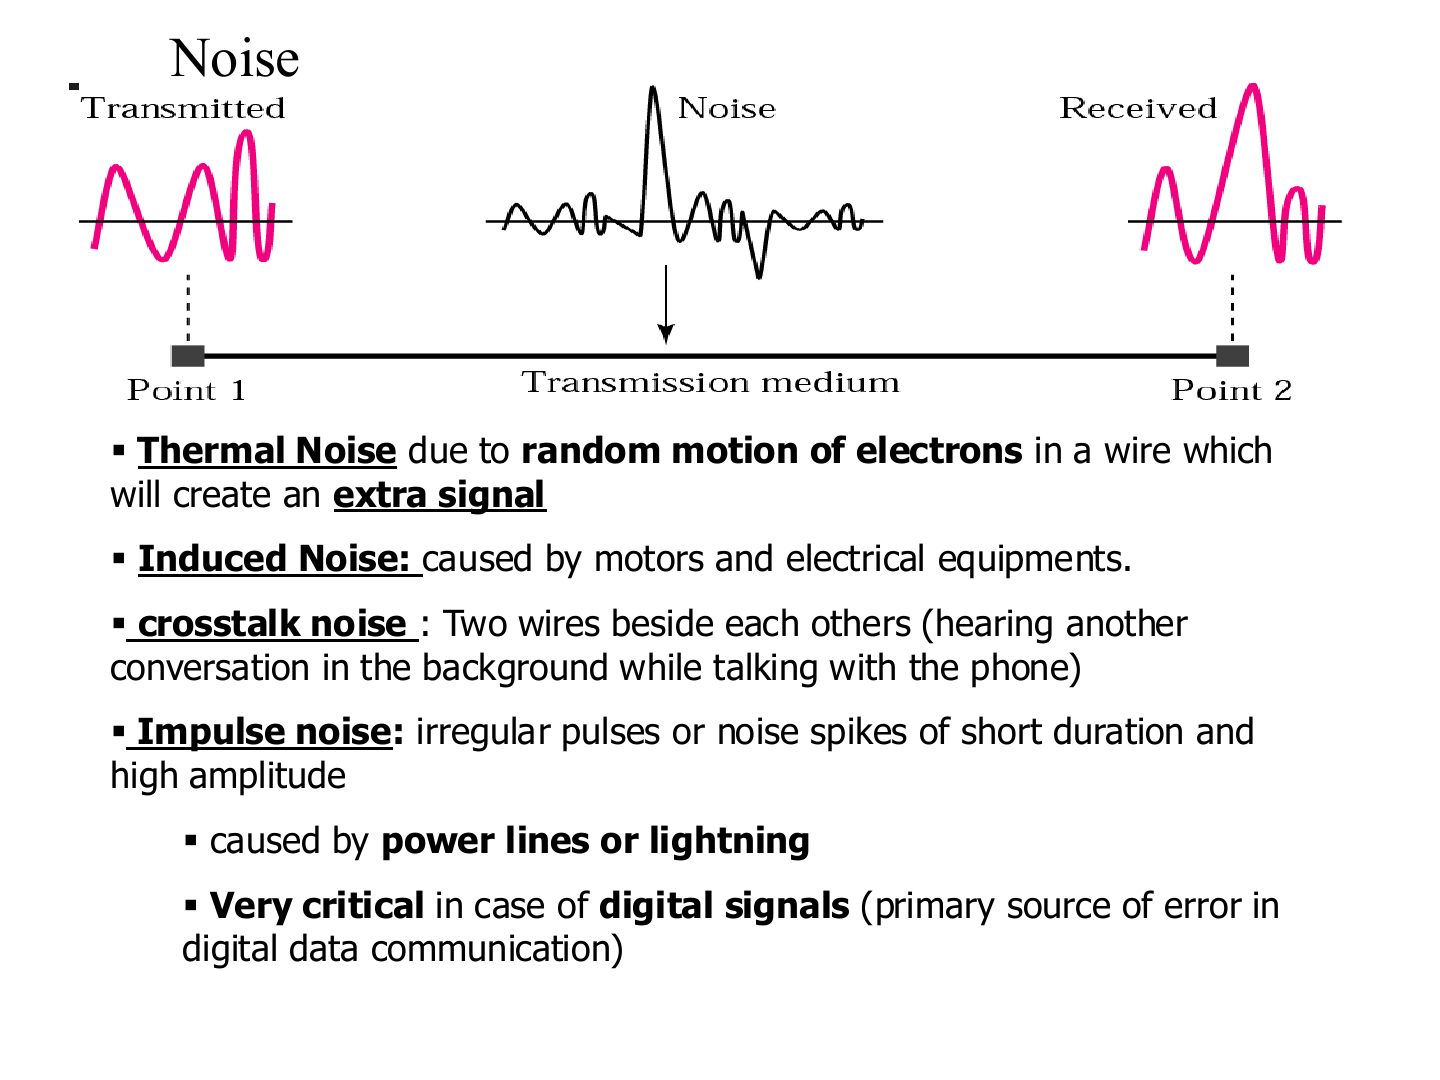
Crosstalk: one wire picks up a neighbour’s signal (hearing another call).
Memory trick Crosstalk = “cross talk”: someone else’s conversation crossing into yours.
Exam angle
Q6 · background conversation = crosstalk
Q9 · nearby electrical equipment = induced noise
On a phone call you hear a faint conversation from another call. Which impairment is this, and under which category?
Compare with the model answer
Crosstalk, which is a kind of noise: a signal from one line leaking into another nearby line.
A long-distance link has many errors because of nearby electrical equipment. Which impairment, and how would you reduce it?
Compare with the model answer
Induced noise (electromagnetic interference), a kind of noise. Reduce it with shielded or twisted-pair cable, by moving cables away from the equipment, by using fiber, and with error detection.
Which noise is the primary source of error in digital data communication?
Performance: propagation time and speed
Notes
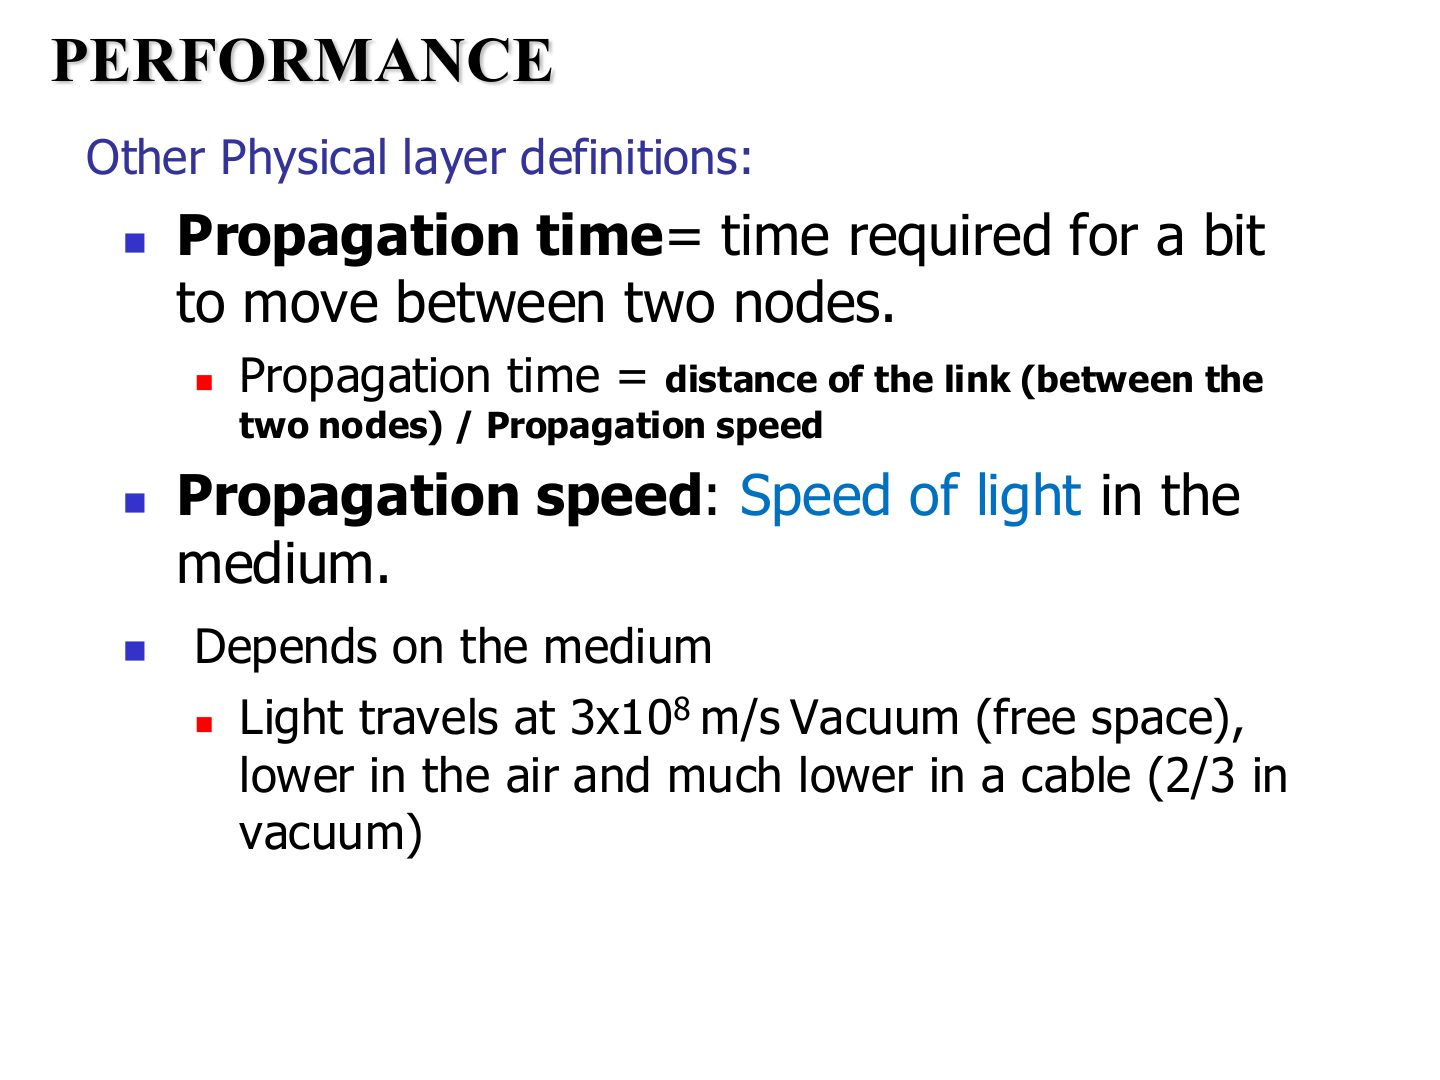
Trap Convert km to m before dividing by m/s.
Exam angle
Q4 · 2,000 km at 2 × 10⁸ m/s
Sender and receiver are 2,000 km apart and the signal travels at 2 × 10⁸ m/s. Propagation time?
- Tutorial 3, Q4: 2,000,000 m / 2 × 10⁸ = 0.01 s = 10 ms.
Propagation Time
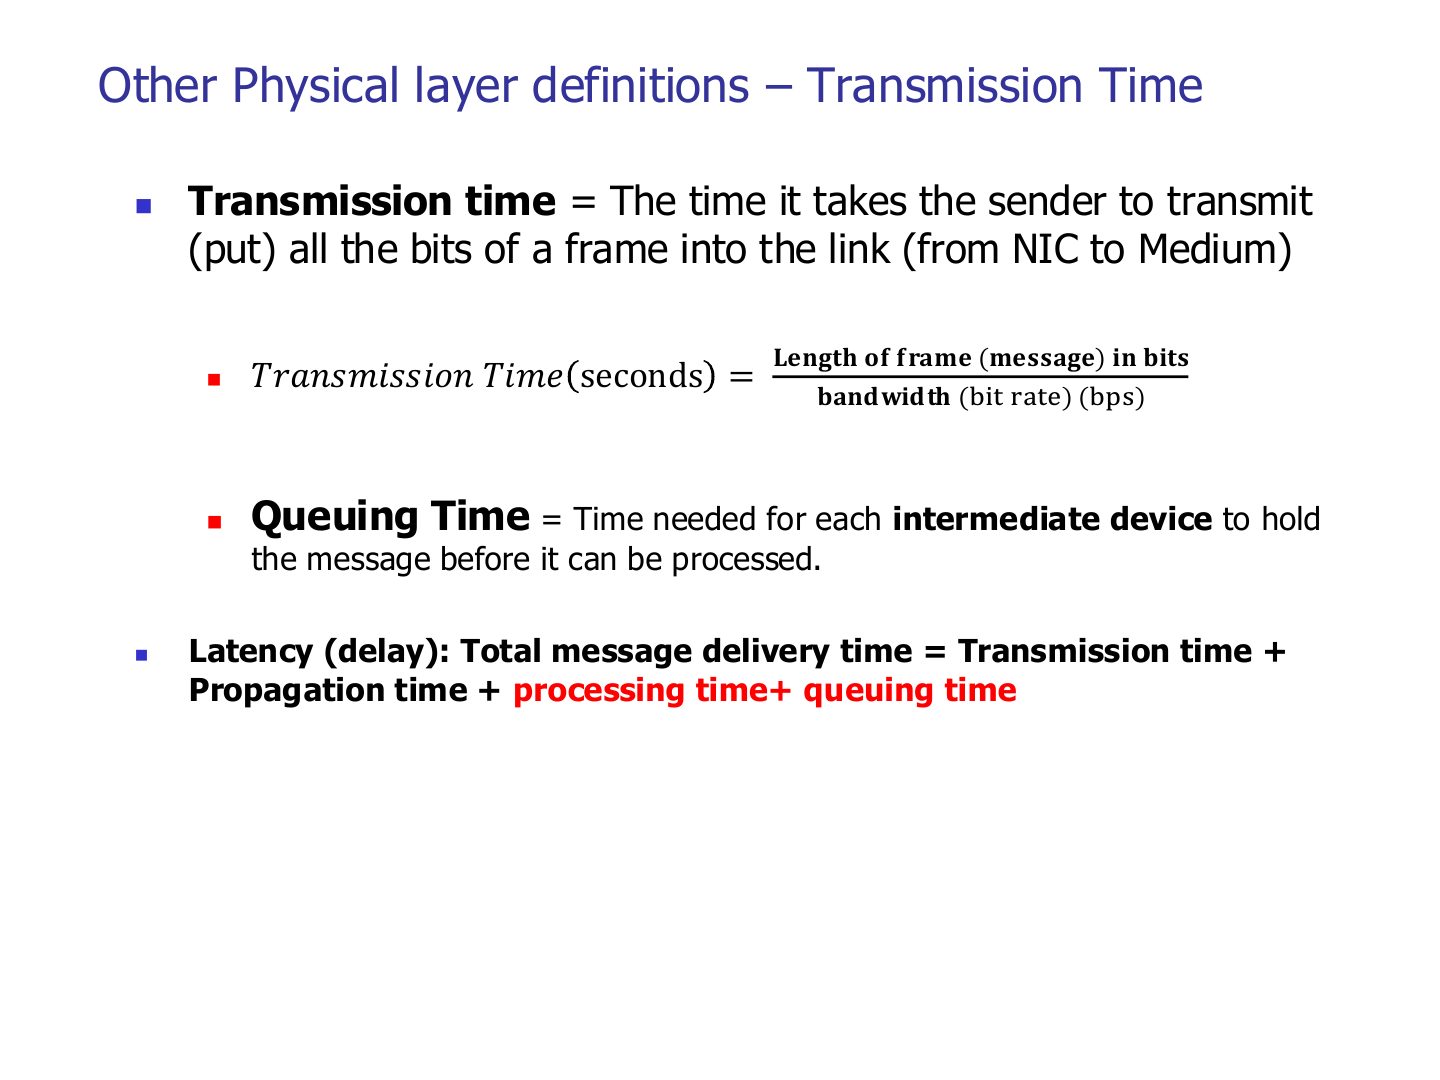
Other Physical layer definitions – Transmission Time
Notes
Transmission time = size / bandwidth: depends on message size, not distance.
Memory trick Propagation = how FAR. Transmission = how BIG. Queuing = how BUSY.
Trap 1 MB = 8 Mb: multiply bytes by 8 first.
Exam angle
Q7 · 1 MB over 1 Mbps
A 1 MB file is sent over a 1 Mbps link (ignore propagation). Transmission time?
- Tutorial 3, Q7: 8 Mb / 1 Mbps = 8 s.
Which delay depends on the size of the message?
List the four components of latency.
Compare with the model answer
Propagation time + transmission time + queuing time + processing time.
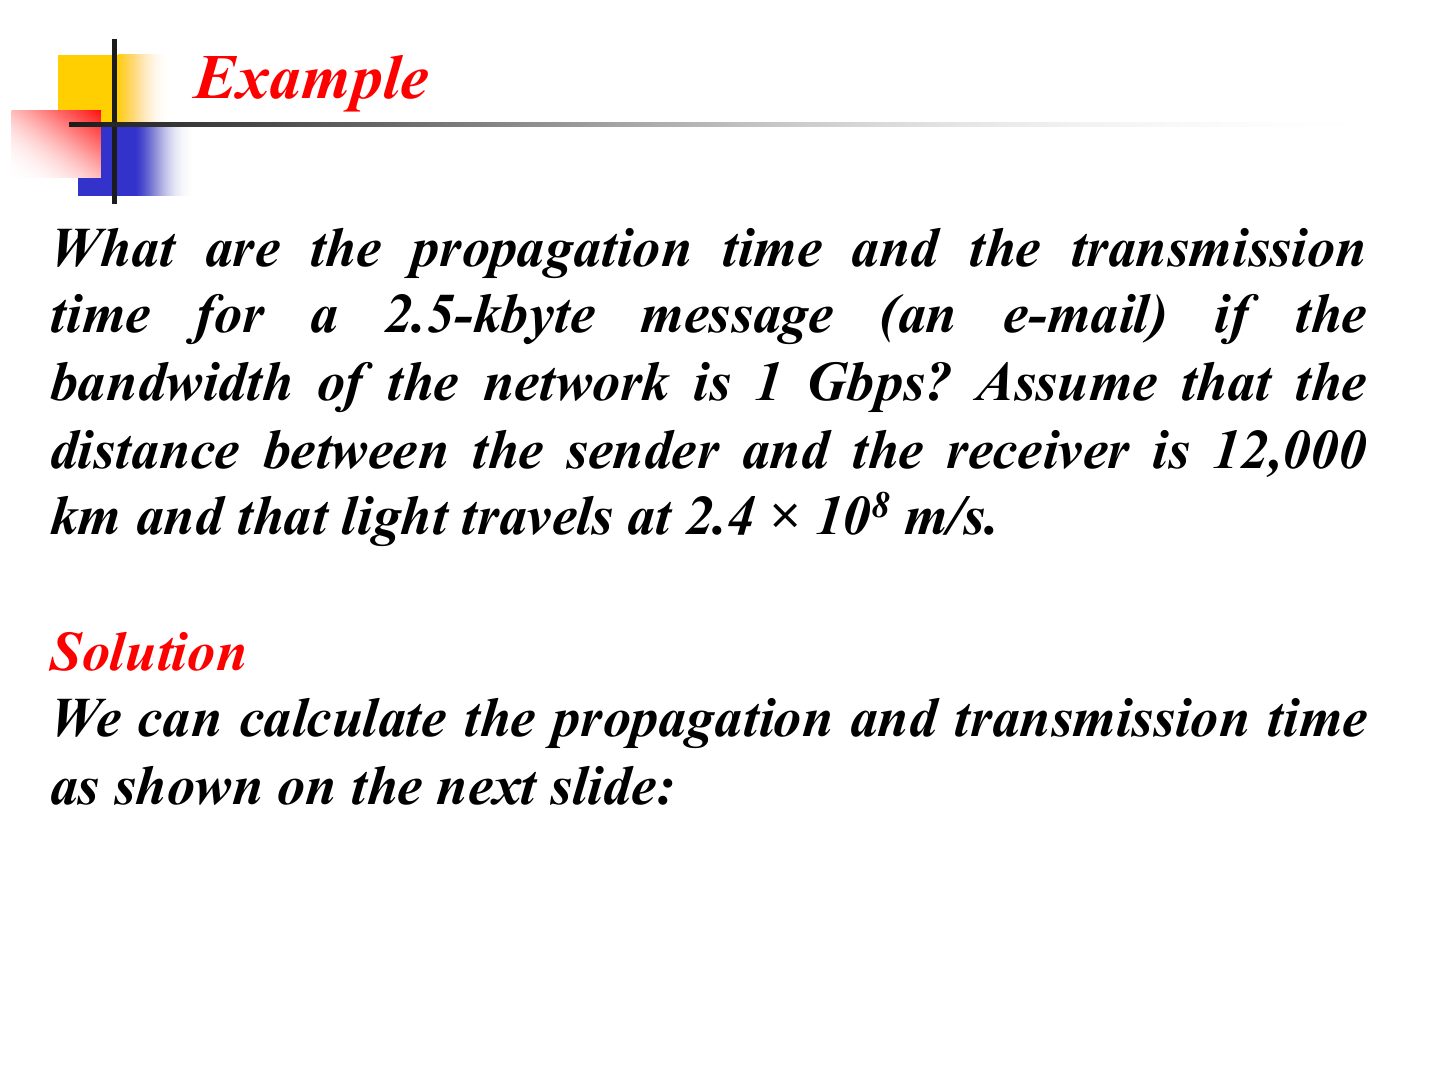
Example
Notes
Short message + fast link: guess which delay wins before you calculate.
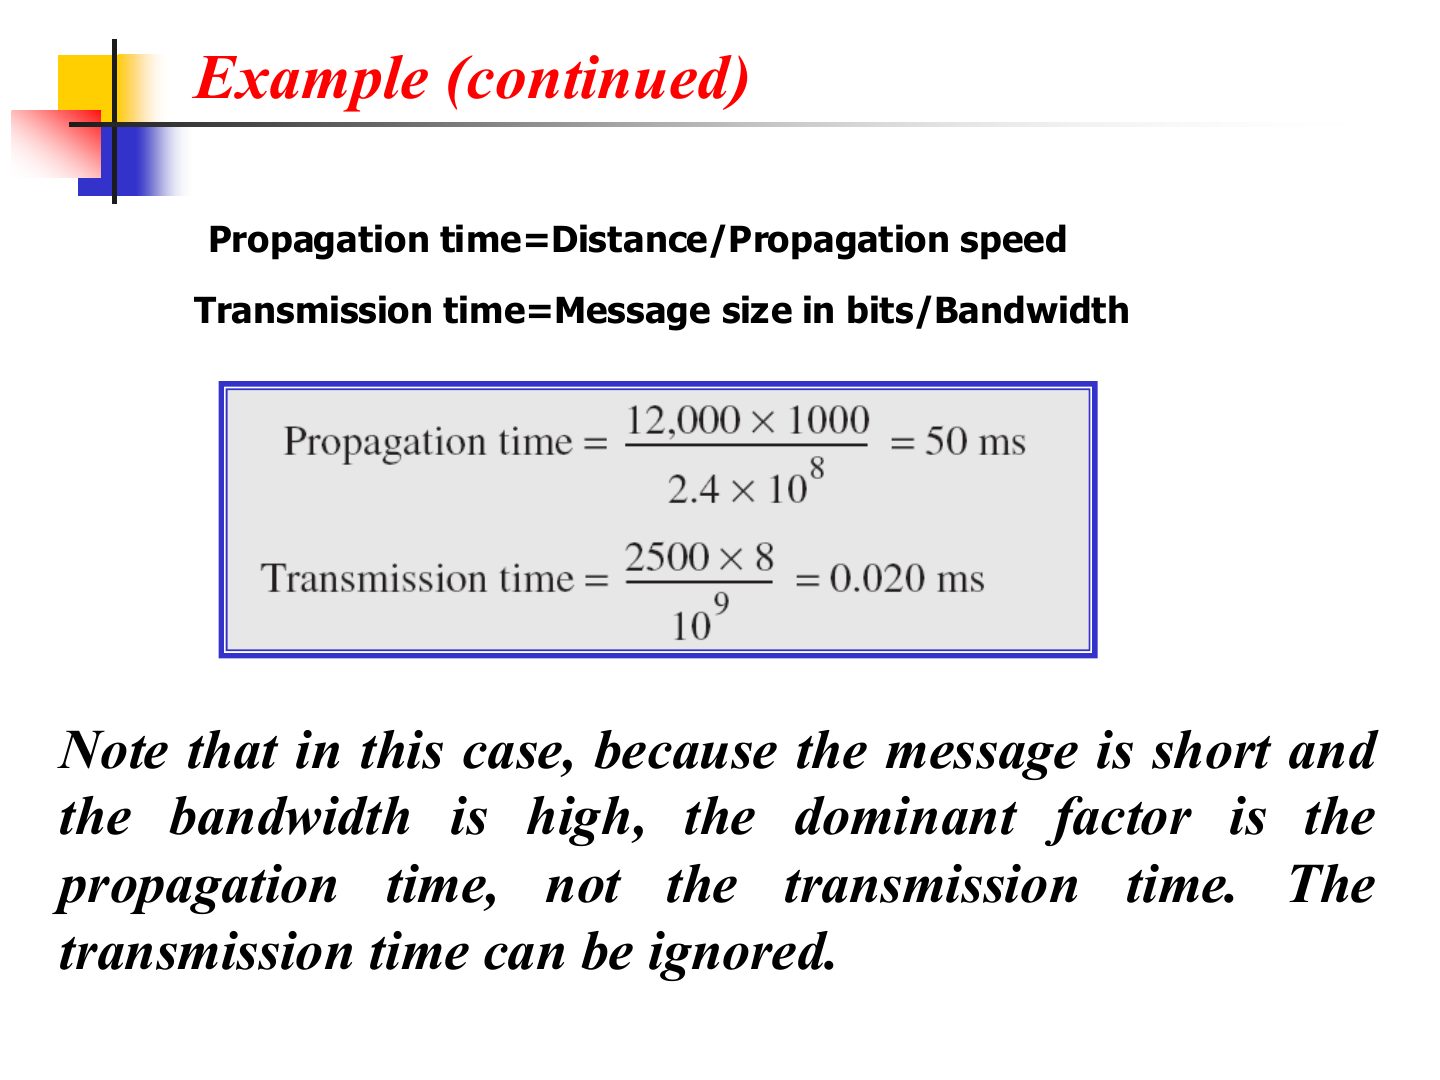
Example (continued)
Notes
Small message on a fast link: propagation dominates.
Exam angle
For a short e-mail on a 1 Gbps link across 12,000 km, the transmission time dominates.
- Propagation (50 ms) dominates; transmission is only 0.02 ms.
Example
Example (continued)
Notes
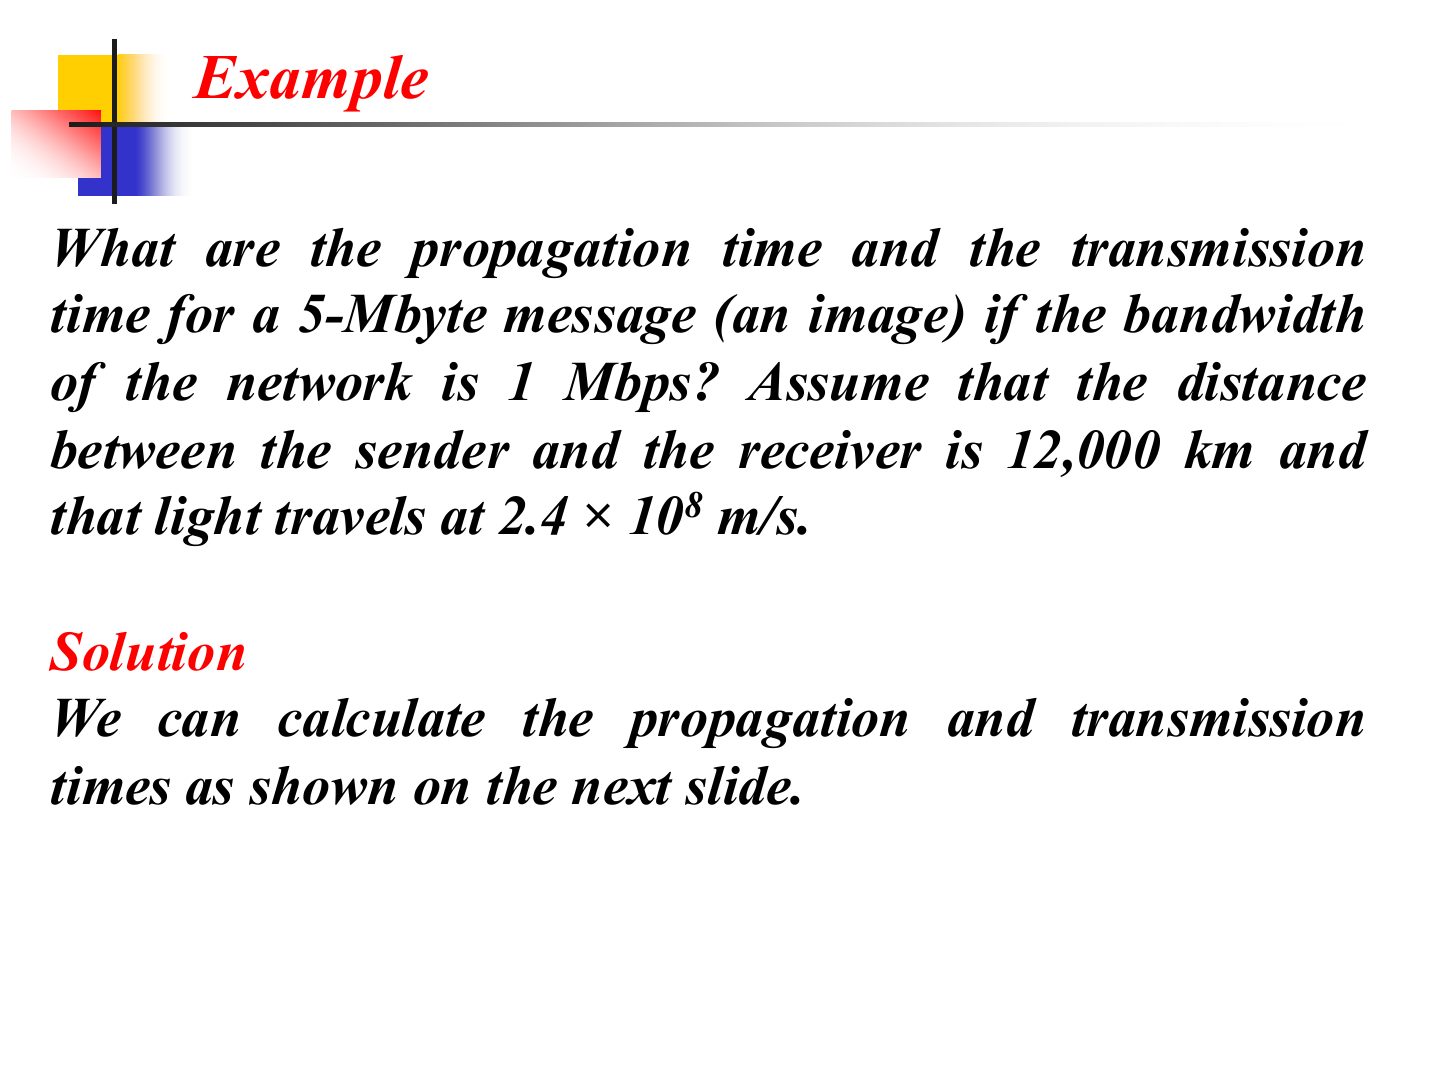
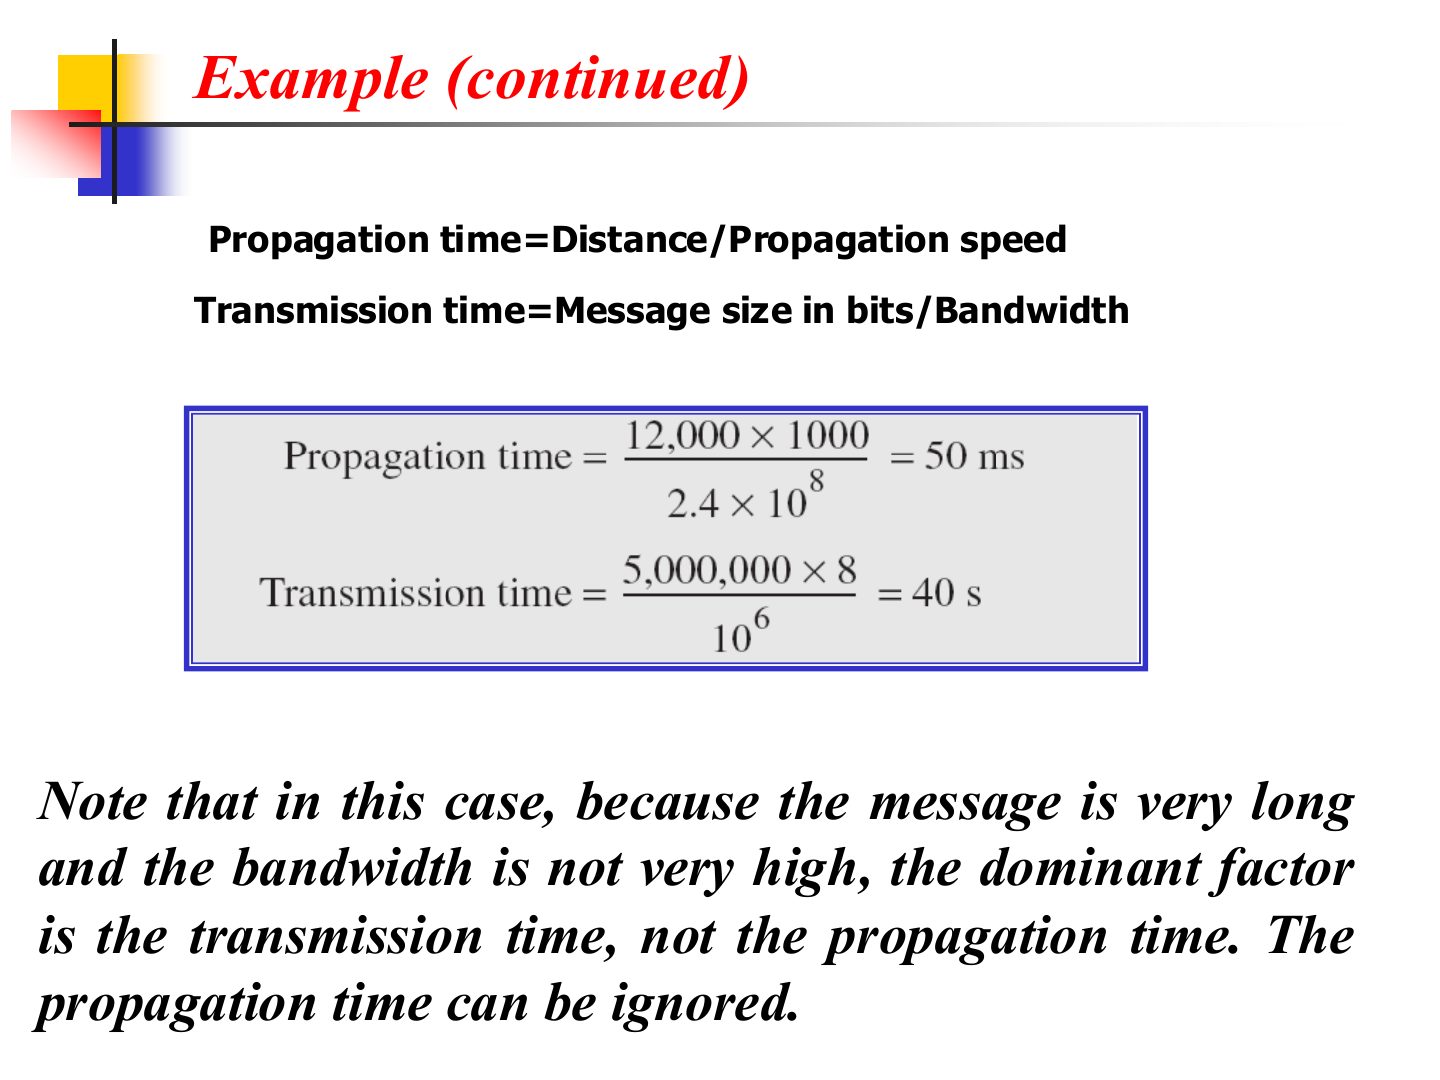
Same distance, same 50 ms propagation. Big message on a slow link: transmission dominates.
Exam angle
A 5 MB image is sent on a 1 Mbps link over 12,000 km (2.4 × 10⁸ m/s). Which delay dominates?
Example: a satellite link
Notes
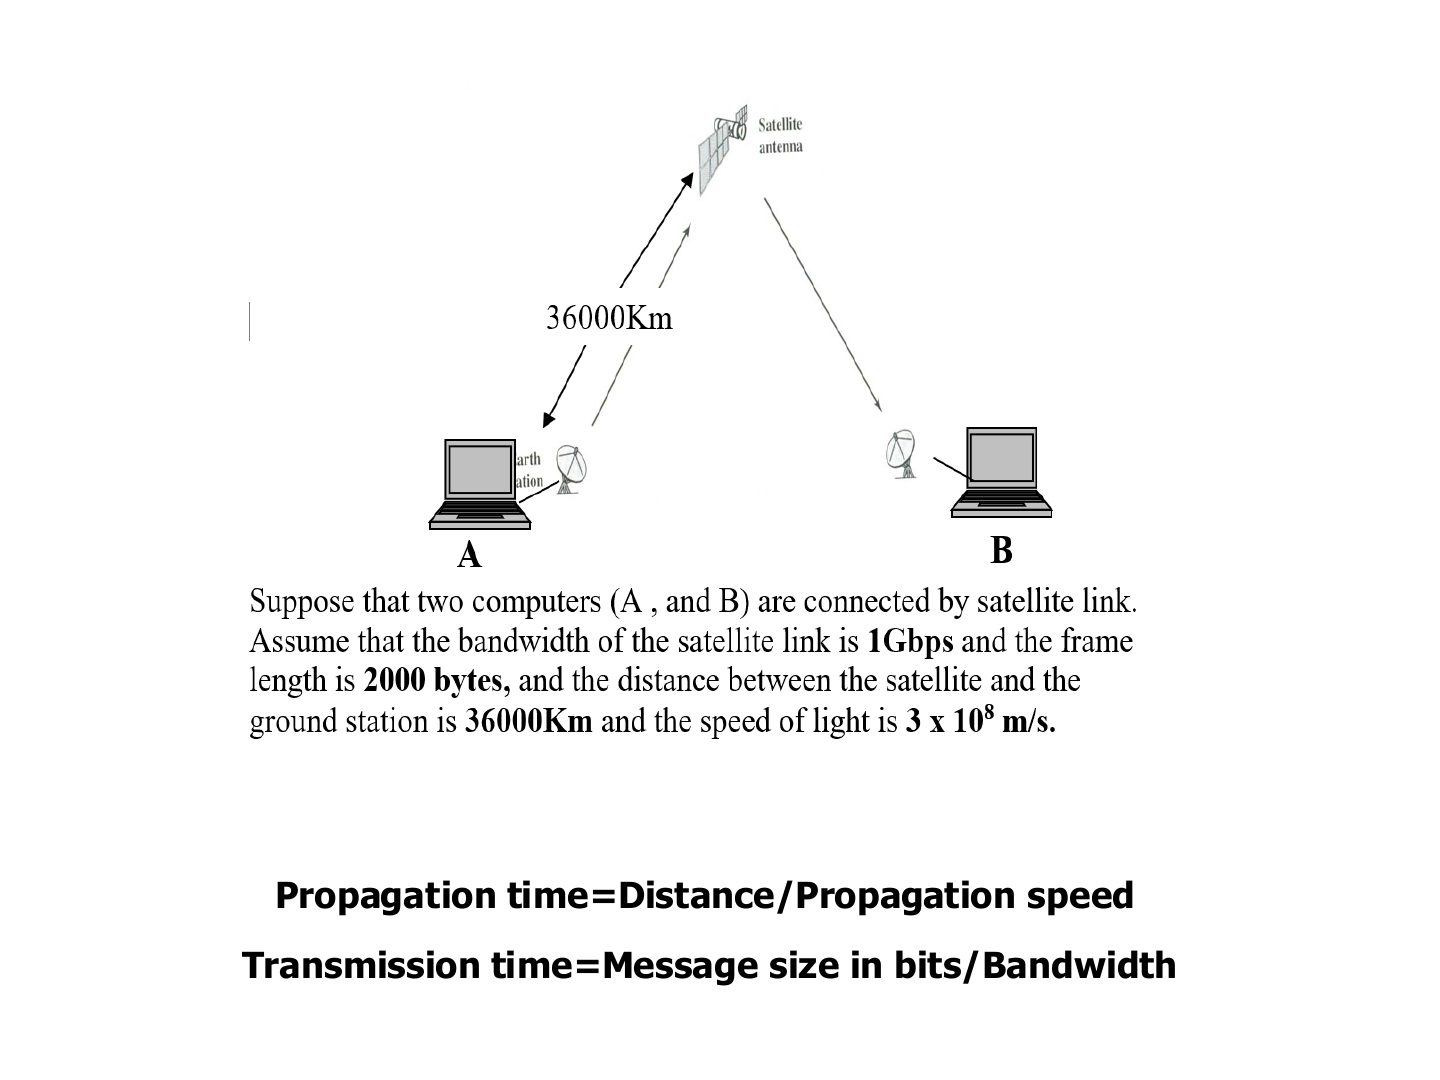
A → satellite → B is 2 × 36,000 = 72,000 km: propagation = 72 × 10⁶ / 3 × 10⁸ = 0.24 s (0.12 s for one leg).
Exam angle
In the satellite example (36,000 km up, 36,000 km down, 3 × 10⁸ m/s), the propagation time from A to B is:
- 72,000,000 m / 3 × 10⁸ m/s.
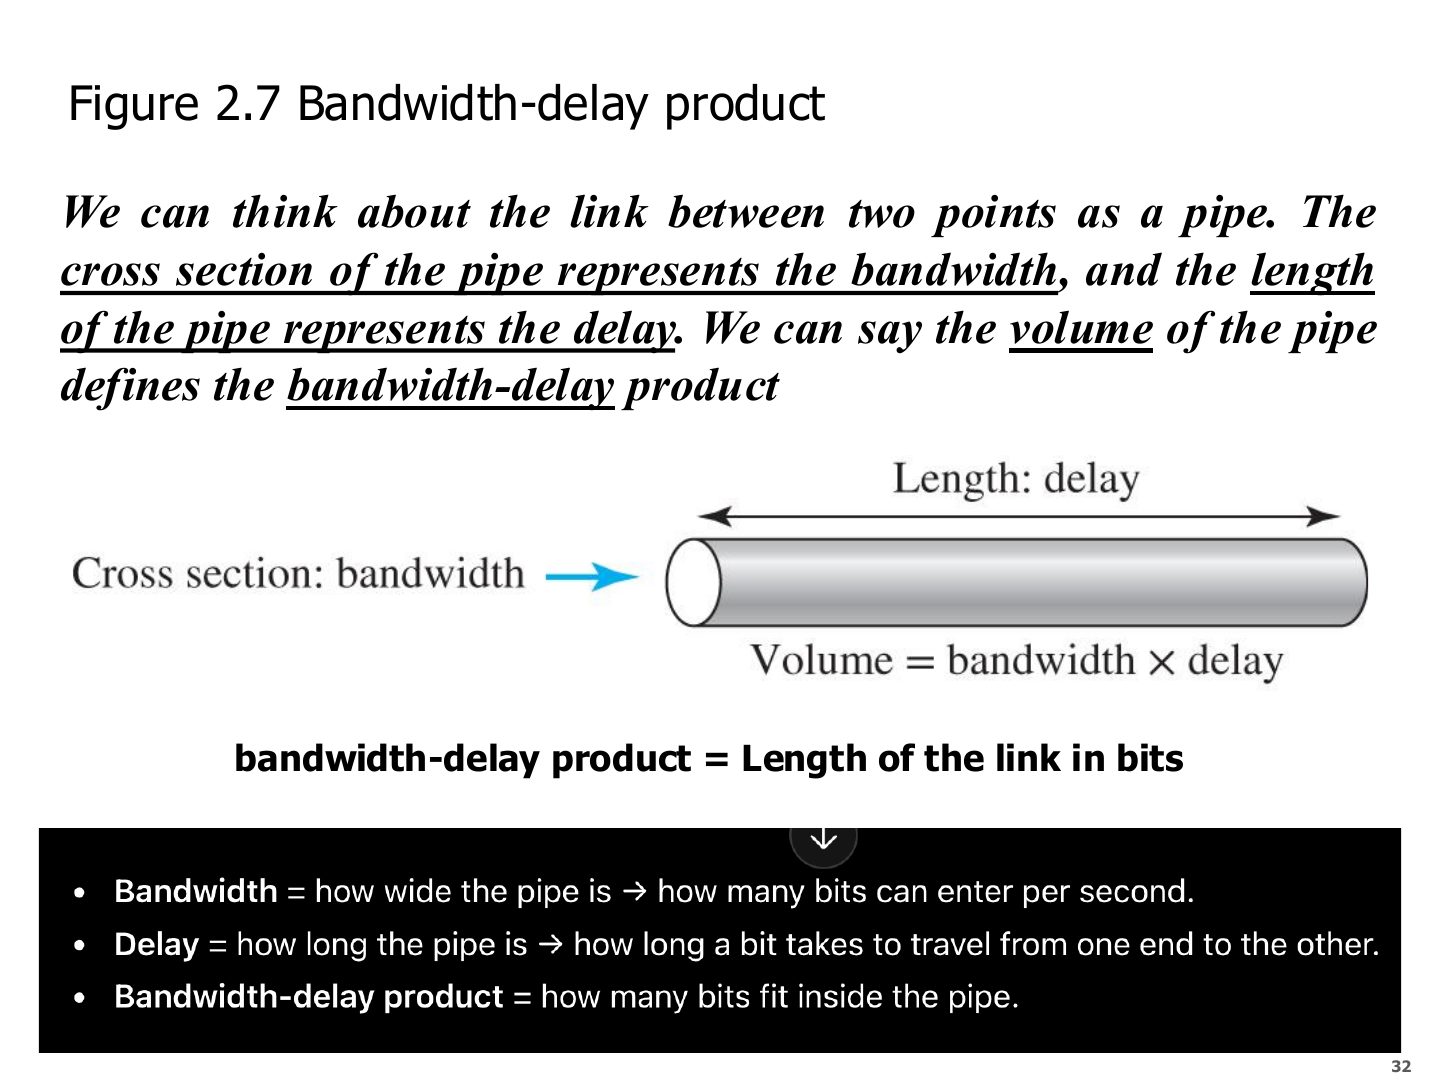
Bandwidth-delay product (Figure 2.7)
Exam angle
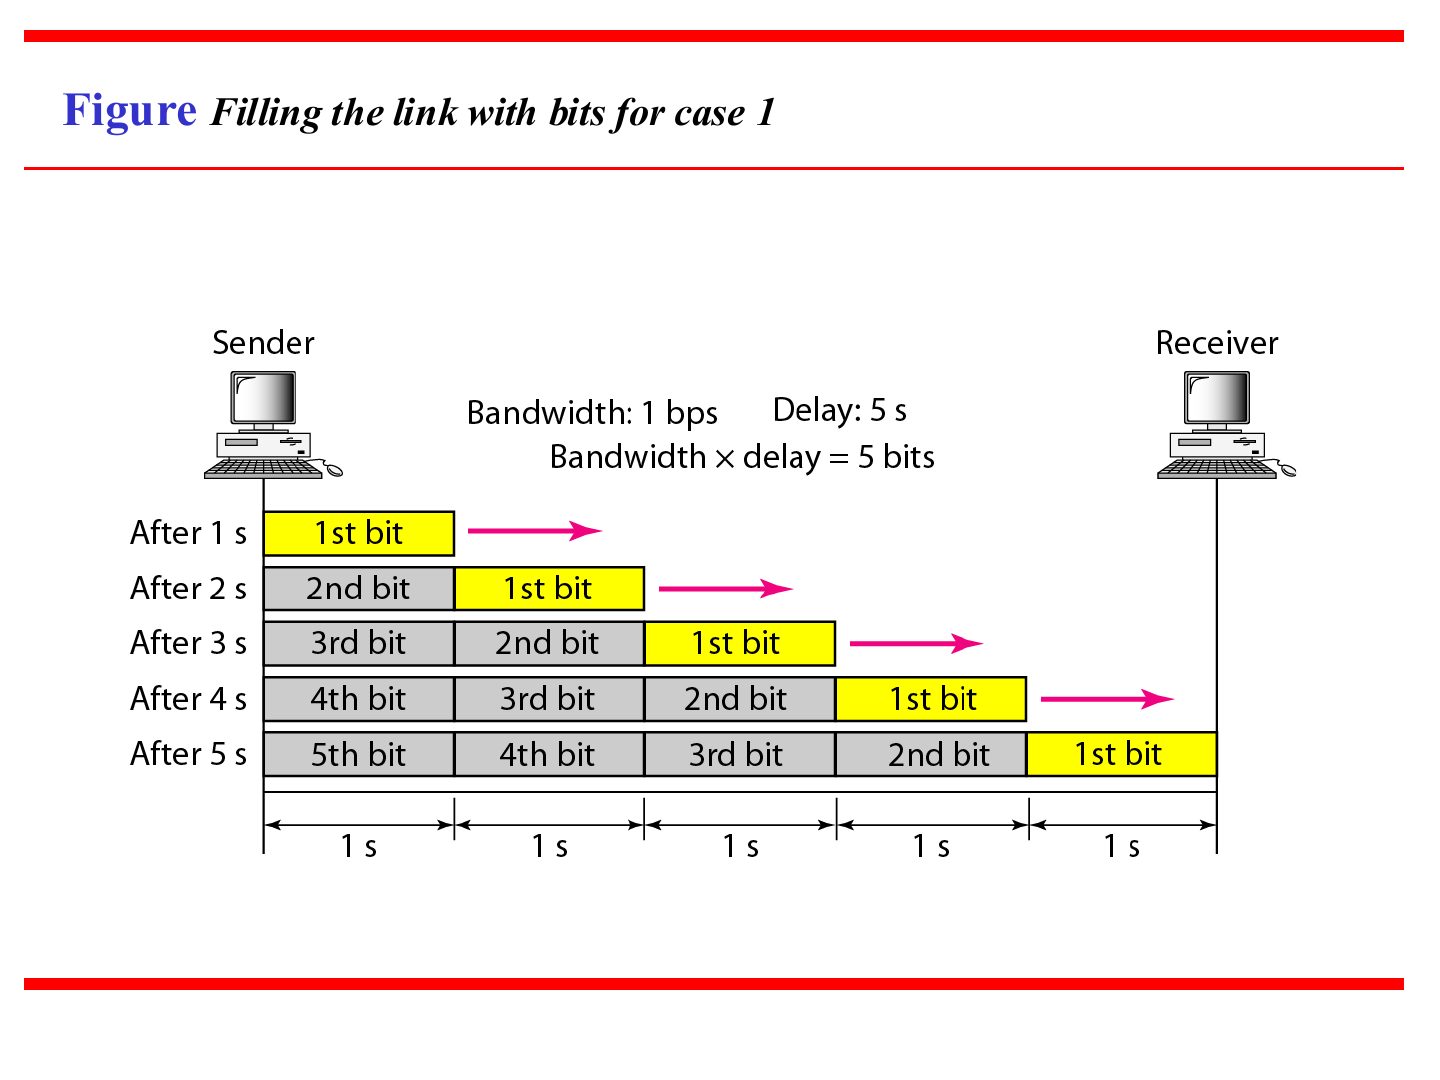
Q10 · 5 bps × 5 s
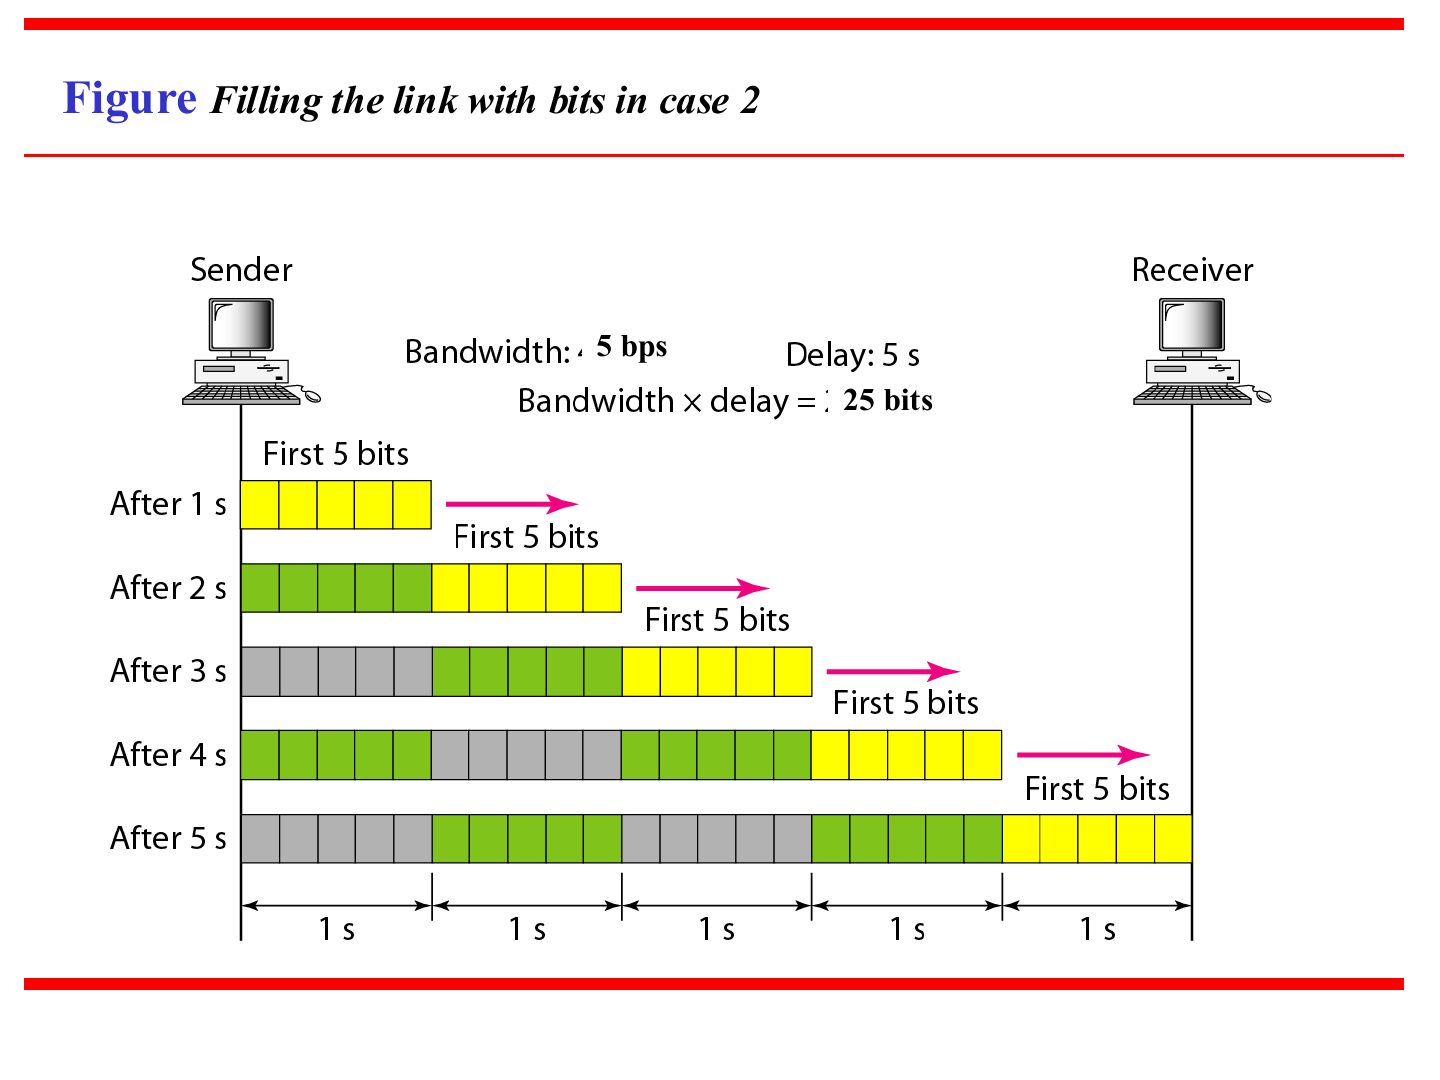
A link has a bandwidth of 5 bps and a delay of 5 s. Its bandwidth-delay product is:
- Tutorial 3, Q10.
A 10 Mbps link has a 2 ms delay. How many bits fill the link?
- 10⁷ × 0.002 = 20,000 bits.
Filling the link with bits for case 1
Filling the link with bits in case 2
Notes
5 bps × 5 s = 25 bits: the Tutorial 3 numbers.
Exam angle
Q10 · bits in the pipe after 5 s
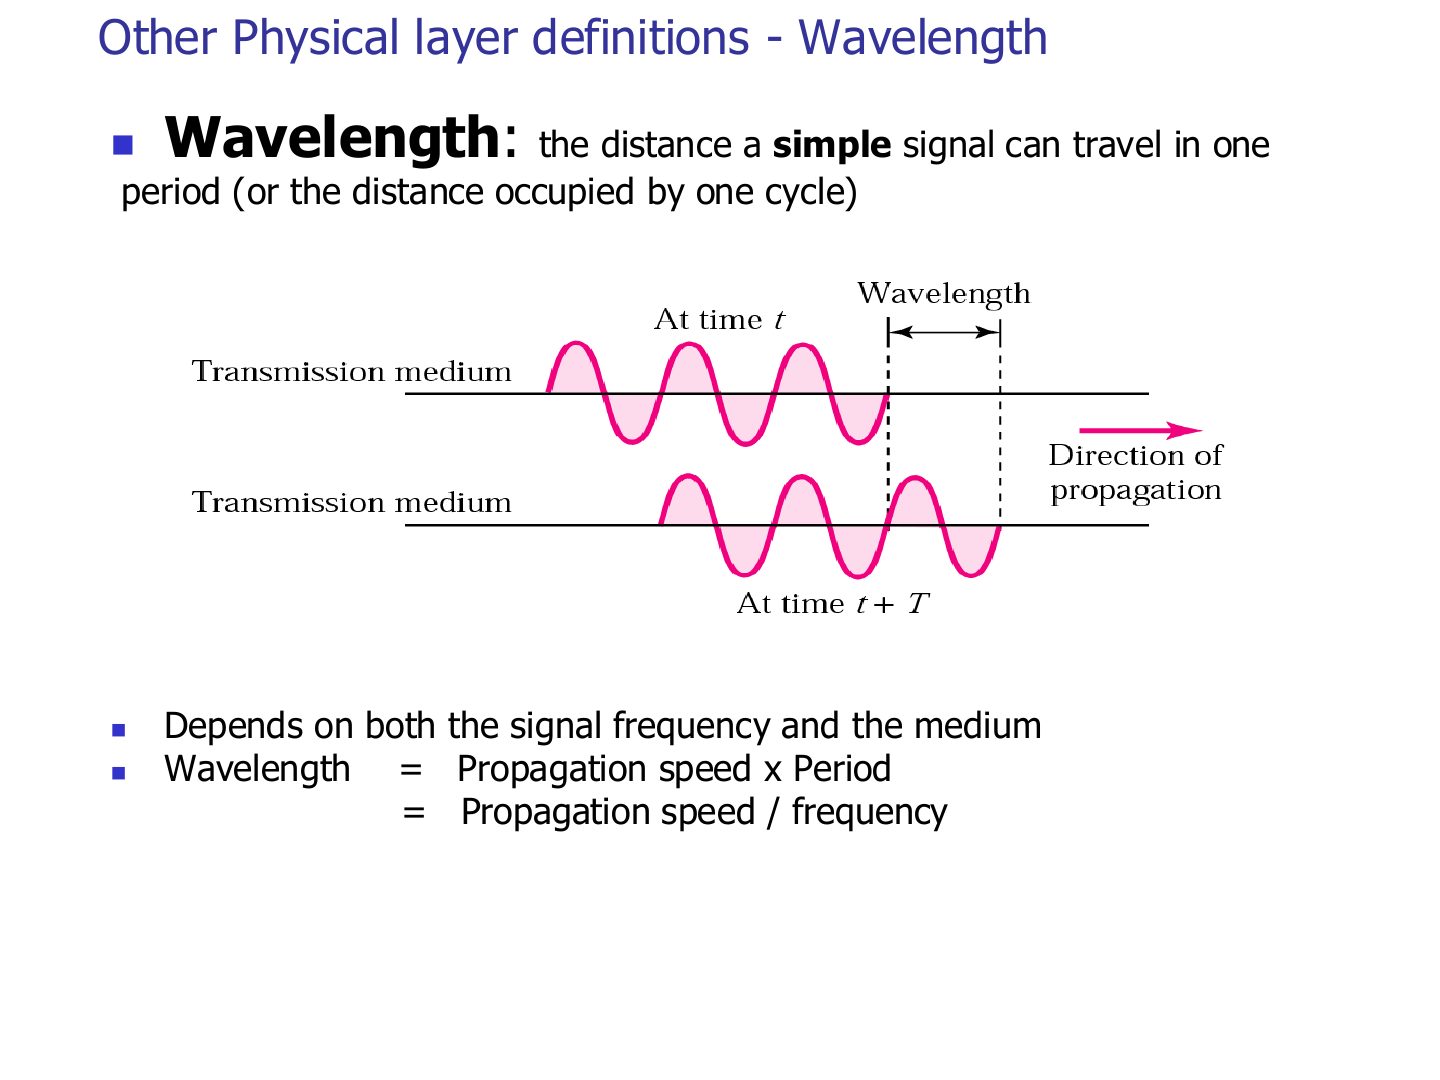
Other Physical layer definitions - Wavelength
Exam angle
A 1 MHz signal travels at 2 × 10⁸ m/s. Its wavelength is:
- 2 × 10⁸ / 10⁶ = 200 m.